INVITE-ONLY SCRIPT
已更新 Directional Analyzer
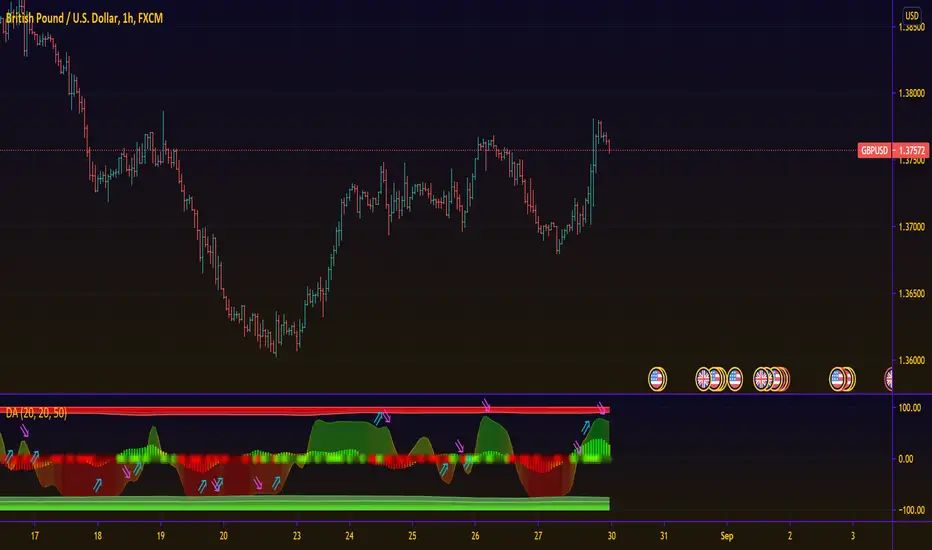
This script attempts to equip users with the necessary information about the direction of an instrument, and essentially it is a synergy of 3 algorithms.
The first algorithm (plotted as dots at level 0) studies the balance of delta volatility that constitutes the current bar and answers if bulls or bears are in control at that exact bar time
The second algorithm (plotted as an area) studies the development of delta volatility over the defined period by means of a polynomial regression. Effectively, it provides an overall picture of the trend strength.
The third algorithm (plotted as a line with arrow labels) utilizes simple elements of neural network in conjunction with some custom filters to predict the focal point that a trend will reverse its direction. This is predictive in nature, hence always adopt this with caution. While the labels display the predicted direction, the colors of the line also reflect the state of the current bar as well, adding to the confirmation of the first algorithm.
May you be on the right side of the trade.
發行說明
Update the logics behind the predictive models.Further clean up the code for faster execution.
發行說明
Major Update:- A new predictive algorithm has been included, and the correlation between this new one and the old one will be utilized to provide directional forecast now plotted as arrows. The line part has been removed due to underperformance in giving confirmation of direction.
- A self-optimizing filter has been added to the algorithms that analyze the current bar state (plotted as dots at zero line) and the overall strength of the trend (plotted as the area - now made parameterless). This filter significantly removes the lag and overshoots compared to without the filter
- A new algorithm has also been added (plotted as columns), which is based on my interpretation of entropy in information theory. This shall perform quite similarly to the area part, but tailored to usually lead the overall strength of the trend. This mean that the confluence of the columns part and areas part gives extra conviction to trend bias.
- Dynamic Overbought/ Oversold levels are introduced to identify potential trend reversal (usage: compared against the area part)
發行說明
Minor changes in default settings發行說明
Migration to Pine V5僅限邀請腳本
僅作者批准的使用者才能訪問此腳本。您需要申請並獲得使用許可,通常需在付款後才能取得。更多詳情,請依照作者以下的指示操作,或直接聯絡QallianceTech。
TradingView不建議在未完全信任作者並了解其運作方式的情況下購買或使用腳本。您也可以在我們的社群腳本中找到免費的開源替代方案。
作者的說明
Send me a direct message for life-time access request.
免責聲明
這些資訊和出版物並非旨在提供,也不構成TradingView提供或認可的任何形式的財務、投資、交易或其他類型的建議或推薦。請閱讀使用條款以了解更多資訊。
僅限邀請腳本
僅作者批准的使用者才能訪問此腳本。您需要申請並獲得使用許可,通常需在付款後才能取得。更多詳情,請依照作者以下的指示操作,或直接聯絡QallianceTech。
TradingView不建議在未完全信任作者並了解其運作方式的情況下購買或使用腳本。您也可以在我們的社群腳本中找到免費的開源替代方案。
作者的說明
Send me a direct message for life-time access request.
免責聲明
這些資訊和出版物並非旨在提供,也不構成TradingView提供或認可的任何形式的財務、投資、交易或其他類型的建議或推薦。請閱讀使用條款以了解更多資訊。