VWAP Flow ParmezanThe "Official Bank Flow VWAP" is a comprehensive trading suite designed for institutional Forex traders.
This indicator solves the problem of chart clutter by combining two critical components of liquidity: Price (Value) and Time (Sessions). It is specifically optimized for EUR/USD and GBP/USD on intraday timeframes (M5, M15), helping you identify high-probability setups where "Fair Value" meets "Volatility."
Key Features
1. Multi-Timeframe VWAP Hierarchy Unlike standard indicators, this tool visualizes the interaction between three distinct timeframes:
Daily VWAP (Dynamic Color): Your primary trend filter. Green when Bullish (Price > VWAP), Red when Bearish (Price < VWAP).
Weekly VWAP (Orange Dots): Represents the medium-term balance. Acts as a magnet for mean reversion mid-week.
Monthly VWAP (Purple Line): The institutional "line in the sand." Major support/resistance level.
2. Standard Deviation Bands (Market Balance) The indicator plots SD1 and SD2 bands around the Daily VWAP:
Inner Zone (SD1): Represents the "Fair Value" area.
Outer Bands (SD2): Represents overbought/oversold conditions. Useful for identifying mean reversion plays back to the center.
3. Official Exchange Sessions (Time) Forget confusing "killzones." This tool highlights the Official Open times for major exchanges, adjusted for Daylight Savings via New York time:
London Open (08:00 LDN): The start of European volume.
New York Open (08:00 NY): The injection of US liquidity.
London Close/Fix: The daily overlap close, often marking trend reversals.
Note: Sessions are visualized with non-intrusive black "shadow" backgrounds to keep your chart clean.
4. "Ghost" Levels (Previous VWAP) A unique feature that plots the closing VWAP level of the previous day. Institutional algorithms often target these "untested" levels as Take Profit targets or liquidity pools.
How to Use
Trend Following: If Price is above the Daily VWAP (Green) during the London Open, look for Long entries targeting the SD1/SD2 upper bands.
Mean Reversion: If Price hits the SD2 Band while far away from the Weekly VWAP, look for a reversal back to the mean.
Confluence: The strongest signals occur when price touches a key VWAP level (e.g., Weekly VWAP) specifically during the highlighted Session Start times.
Settings
Timezone: Defaults to America/New_York to automatically handle DST shifts for London/NY opens.
Visuals: Fully customizable colors and transparency. Default is set to a "Dark Mode" friendly professional palette.
[b]forex

3 EMA with Alerts 2025This indicator plots three key EMAs (20, 50, and 200) directly on the chart, making it easy to track short-, medium-, and long-term trends. A color-coded table is displayed in the top-right corner for quick reference.
The script also includes smart alerts that trigger only when the state changes:
• 🔵 EMA 20 crossing above EMA 50 & EMA 200 → Bullish signal
• 🔴 EMA 20 crossing below EMA 50 & EMA 200 → Bearish signal
This tool is designed for traders who want clean visuals, reliable alerts, and simplified trend recognition in 2025 markets.

INSTITUTIONAL MOMENTUM [@Ash_TheTrader]⚡ The Impulse Engine: Institutional Velocity & Smart Structure System
Subtitle/Short Description: Stop looking at just Open and Close. Visualize the speed of price action, detect institutional footprints, and trade off dynamic "living" market structure that flips and burns automatically. Developed by @Ash_TheTrader.
The Hidden Dimension of Price Action
Most traders look at a standard candlestick and see four data points: Open, High, Low, and Close.
But this hides the most critical information: The struggle.
Did the buyers step in aggressively in the first 5 minutes, pushing price to highs instantly? (Institutional buying)
Or did it take 59 minutes of slow, grinding effort to reach that high? (Retail exhaustion/Trap)
Standard candles look identical in both scenarios. The Impulse Engine, developed by @Ash_TheTrader, solves this by visualizing the "Speed of Price" (Velocity) directly onto your chart, combined with a state-of-the-art, dynamic market structure system.
It’s not just an indicator; it’s a complete market X-ray.
1. The Velocity Painter: See the Speed ⚡
The core of this system is the Velocity Engine. It looks "inside" your current timeframe bar (using lower timeframe data) to calculate how fast price traveled to its extremes.
It paints the bars based on institutional urgency, allowing you to ignore the noise and focus on the momentum.
The Visual Code:
⚡ NEON CYAN (Bullish Impulse) : Aggressive buying. Price ripped from the open to the high very quickly. This is where the smart money is stepping on the gas.
⚡ NEON MAGENTA (Bearish Impulse): Aggressive selling. Price crashed from the open to the low immediately.
💤 FADED GREY (Exhaustion/Trap): The "grind." Price took a long time to reach its extremes. These are often low-momentum environments or potential traps waiting to reverse.
STANDARD GREEN/RED: Normal market flow with no significant velocity extremes.
"Trade the Neon, Ignore the Grey." — @Ash_TheTrader
2. Smart Structure: "Living" Levels 🏗️
Old-school pivot indicators clutter your chart with endless historical lines that are no longer relevant. The Impulse Engine uses a "Living Structure" algorithm that manages the lifecycle of every support and resistance level.
It only shows you the two most relevant Resistance levels (R1, R2) above price, and the two most relevant Support levels (S1, S2) below price.
Risk-Based Classification:
You choose the structure based on your trading style in the settings:
Scalp Mode: Detects short-term, 5-bar swings. (Thin dotted lines).
Trend Mode: Detects standard trend swings (21-bar). (Dashed lines).
Major Swing: Detects deep, major structural points (60-bar). (Thick solid lines).
The "Flip & Burn" Mechanic (Viral Feature) 🔥
This is where the system gets smart. It understands market mechanics:
The Flip (Role Reversal): If a Resistance level is broken by a candle close, it automatically turns Gold and becomes Support (Flip). The same applies to Support turning into Resistance. You no longer need to guess if an old level will hold from the other side.
The Burn (Auto-Cleaning): If a "Flipped" level is broken again, the system recognizes it has lost its structural integrity. The line is instantly "burned" (removed from the chart).
This ensures your chart only ever shows levels that are active and respected.
3. Whale Signs: The Footprint of Big Money 🐋
Sometimes, velocity isn't enough. You need to see raw power.
The Whale Sign feature detects massive expansions in volatility. It flags any candle whose range is significantly larger (default 2x) than the average of the previous two candles.
💚 Green Triangle + $ (Below Bar): A massive bullish expansion candle. A "Wake Up" call for longs.
❤️ Red Triangle + $ (Above Bar): A massive bearish expansion candle. A warning sign for shorts.
These often precede sustained velocity moves.
4. The Pro HUD (Heads-Up Display) 💻
In the bottom right corner, the dynamic HUD gives you a real-time health check of the current candle.
Status Header: Instantly tells you if the current candle is IMPULSE, EXHAUSTION, or NORMAL.
Live Velocity %: The exact speed score. The text color changes to Neon during impulses and fades to grey during exhaustion.
Mode Info: Reminds you which risk setting you are currently using (e.g., Mode: ).
Signature: The official @Ash_TheTrader stamp of quality.
How to Trade With The Impulse Engine
This system is designed for confluence. Never trade a signal in isolation.
📈 Strategy 1 : The "Velocity Bounce" (Trend Continuation)
Ensure the market is trending (e.g., making higher highs).
Wait for price to pull back to a Smart Support level (Cyan dashed line or Gold "Flip" line).
Trigger: Look for a Neon Cyan Impulse Candle to form right off that support level. This confirms institutions are defending the structure with speed.
📉 Strategy 2: The "Whale Breakout"
Identify a consolidation zone below a Smart Resistance level.
Trigger: A Whale Sign ($) appears on a candle that successfully closes above the Resistance level.
Confirmation: The very next candle should ideally be a Neon Impulse candle continuing the move.
Conclusion
The markets are moved by aggression and speed. By obscuring this data, standard charts put you at a disadvantage.
The Impulse Engine brings this hidden data to the forefront, combining institutional velocity detection with smart, automated market structure that reacts to price just like a professional trader would.
Trade faster, trade smarter.
Developed by @Ash_TheTrader.
(Disclaimer: This tool is for informational purposes only and does not constitute financial advice. Always manage your risk.)

NEURAL FLOW | The AI-Powered Regime Classifier [by @Ash_TheTrade📉 Stop Trading Blindly. Filter the Noise with AI.
Why do your favorite strategies work perfectly one week and bleed your account the next?
The answer is simple: Context.
A Moving Average crossover works in a trend but gets slaughtered in chop. RSI works in a range but fails in a strong breakout. Most indicators are "dumb"—they apply the same math regardless of the market's current reality.
I created Neural Flow to fix this.
Developed by @Ash_TheTrader, this isn't just another buy/sell arrow indicator. It is a sophisticated market Regime Classifier built on concepts derived from machine learning (Lorentzian Distance algorithms).
It doesn't just tell you where price is; it tells you what the market is doing.
🧠 The Concept: How It Works
The core idea behind this script is simple yet powerful: Don't trade unless the environment is right.
The Neural Flow algorithm acts like a veteran trader watching over your shoulder. It analyzes multiple "neurons" (data points representing momentum, volatility, and cyclicality) and compares the current price action to historical data.
By identifying what "state" the market is currently in, it paints your chart in real-time, acting as the ultimate filter for any strategy you use.
👁️ The 4 Market Regimes
The indicator instantly classifies the market into one of four distinct states, visualizing them with a full-chart background glow and candle painting:
1. 🐂 Bull Trend (Neon Green)
The market has clear upward momentum, healthy RSI, and strong trend orientation.
Action: Look for Long entries. Buy dips.
2. 🐻 Bear Trend (Neon Red)
The market has clear downward momentum and weak underlying metrics.
Action: Look for Short entries. Sell rallies.
3. 🚫 CHOP (Grey/Monochrome)
This is the most important feature. The AI has detected low volatility squeeze conditions or directionless ADX. This is where 80% of traders lose money due to fake-outs and whipsaws.
Action: DO NOT TRADE. Sit on your hands and preserve capital.
4. ⚡ Breakout Detected (Gold/Yellow)
The algorithm has detected a sudden, violent expansion in volatility (Bollinger Width explosion) following a period of chop. The direction is not yet confirmed, but a big move is imminent.
Action: Get ready. Watch for a transition into a Bull or Bear regime.
💻 The Glassmorphism Dashboard & AI Confidence
In the corner of your chart, you will find a futuristic, transparent "Glass UI" dashboard designed by @Ash_TheTrader.
It provides instant situational awareness without cluttering your view.
The AI Confidence Score:
This is your conviction meter. It calculates how aligned the various "neurons" of the algorithm are (ranging from 0% to 100%).
A Bull Trend with 40% Confidence might be weak and prone to reversal.
A Bull Trend with 85%+ Confidence indicates strong confluence across multiple data points.
Pro Tip from @Ash_TheTrader: Only take trades when the AI Confidence is above 75%.
🚀 How to Use This in Your Trading
This tool is designed to be versatile.
As a Strategy Filter (Recommended): Use your existing favorite strategy (e.g., MACD, SMC, Price Action). Before taking a trade, glance at the Neural Flow background.
Your strategy says Buy, but the background is Grey (Chop)? Skip the trade.
Your strategy says Sell, and the background is Red (Bear)? Take the trade with confidence.
As a Standalone System: Wait for the market to transition out of "Grey Chop" into a "Green Bull" or "Red Bear" regime. Confirm that the "AI Confidence" on the dashboard is high (>70%), and enter in the direction of the new trend.
⚙️ Settings & Customization
While the default settings are tuned for most markets, @Ash_TheTrader believes in flexibility:
Training Window: Adjust the sensitivity of the regime detection.
Visuals: Customize all colors to match your chart aesthetic.
Glass Dashboard: Move it, resize it, or turn it off completely.
Baseline EMA: Toggle the 50-period baseline reference line on or off to keep your charts ultra-clean.
A Note from the Author:
"Trading isn't about catching every move; it's about catching the right moves and staying safe during the noise. I built this tool to help me instantly recognize when to step on the gas and when to hit the brakes. I hope it brings clarity to your charts."
— @Ash_TheTrader
Disclaimer: This tool is for informational purposes only and does not constitute financial advice. Always manage your risk.

VCAI Stochastic RSI+VCAI Stoch RSI+ is a cleaned-up Stochastic RSI built with V-Core colours for faster, clearer momentum reads and more reliable OB/OS signals.
What it shows:
Purple %K line → bearish momentum strengthening
Yellow %D line → bullish momentum building and smoothing
Soft purple/yellow background bands → OB/OS exhaustion zones, not just raw 80/20 triggers
Midline at 50 → balance point where momentum shifts between bull- and bear-side control
Optional HTF mode → run Stoch RSI from any timeframe while viewing it on your current chart
How to read it:
Both lines rising out of OS → early bullish shift; pullbacks that hold direction favour continuation
Both lines falling from OB → early bearish shift; bounces into the purple OB zone can become fade setups
Lines stacked and moving together → strong, cleaner momentum
Lines crossing repeatedly → low-conviction, choppy conditions
OB/OS shading highlights exhaustion so you focus on moves with context, not every 80/20 tick
Why it’s different:
Classic Stoch RSI is hyper-sensitive and mostly noise.
VCAI Stoch RSI+ applies V-Core’s colour-driven regime logic, controlled OB/OS shading, and optional HTF smoothing so you see momentum structure instead of clutter — making it easier to judge when momentum is genuinely shifting and when it’s just another wiggle.

VCAI RSI Divergence +VCAI RSI Divergence+ is an RSI that shows trend, momentum, and divergence using V-CoresAI colour logic instead of a single white line.
What it shows:
Yellow RSI line → bullish momentum (RSI above its MA; buy-side pressure in control)
Purple RSI line → bearish momentum (RSI below its MA; sell-side pressure in control)
Thin blue line → fast RSI moving average that drives the colour flips
Dashed 70/30 lines → classic OB/OS zones
Background bands → soft purple in OB, soft yellow in OS to mark exhaustion areas
How to read it:
Yellow & rising → momentum shifting bullish; pullbacks into yellow OS band can be accumulation zones
Purple & falling → momentum shifting bearish; pushes into purple OB band can be distribution/sell zones
Hard colour flips (yellow ↔ purple) mark trend regime changes, not minor RSI noise
Divergence mode (on/off)
The divergence engine scans RSI and price pivot structure:
Bullish divergence (yellow) → price lower low + RSI higher low
Bearish divergence (purple) → price higher high + RSI lower high
Lines and tags appear only where a meaningful disagreement between price and RSI exists, giving early context for potential reversals or fade setups.
Together, the momentum colours + optional divergence mapping give a far clearer market read than a standard RSI, with zero clutter and no guesswork.

VCAI Volume LiteVCAI Volume Lite is a clean, modern take on volume analysis designed for traders who want a clearer read on participation without loading multiple indicators.
This Lite edition focuses on the essentials:
real activity vs dead sessions
expansion vs contraction
momentum shifts around breakouts and pullbacks
No hype, no filters, no hidden logic — just a straightforward volume tool rebuilt with the VCAI visual framework.
Use it to quickly spot:
stronger moves backed by genuine participation
weak pushes running on low volume
areas where momentum may stall or accelerate
Part of the VCAI Lite Series.

DeM Trend Bias Strength with Alerts (RB Trading)This tool is built to help users understand trend direction, exhaustion, and momentum shifts on the daily timeframe. It highlights when a market is transitioning from weakness to strength or strength to weakness by displaying color-coded bias bars. The script does not forecast future outcomes and should be used as an analytical aid.
Intended Usage
• Timeframe: Daily
• Instruments: Works on most FX pairs and liquid markets
• Style: Trend and bias evaluation
• Purpose: Identify early signs of momentum recovery within ongoing trends
How It Works
Bias Rotation Engine
The script measures directional pressure and smooths it into a bar display that changes color as conditions shift.
• Green bars show rising strength conditions
• Red bars show declining strength conditions
• Transitional periods often appear near market turning points and consolidation zones
This helps users visually separate healthy directional trends from weakening phases.
Trend Alignment Filter
The bars are designed to be interpreted alongside moving averages or broader trend tools. When the bars turn higher while price respects an upward structure, it often supports continuation themes. When the bars weaken during downward phases, it highlights potential areas where the trend retains control.
Identifying Exhaustion and Recovery
Repeated cycles in the bar display can highlight areas where:
• Downside pressure is fading before an upswing
• Upside pressure is fading before a pullback
• Consolidation is forming before a breakout
These transitions tend to align with moments shown in the image where the arrows mark bias shifts occurring before price acceleration.
How to Use It
• Wait for a clear color rotation before making any decisions
• Confirm with the daily trend and price structure
• Avoid using the tool by itself for entries
• Combine with support and resistance, moving averages, and candle structure
• Not intended for scalping or intraday signals
Why Daily Chart Works Best
The daily timeframe smooths out noise and gives the strength bars enough data to reveal genuine trend transitions. Higher timeframes also reduce false rotations that are common in lower timeframes.
Notes
The script does not predict or guarantee price movement. It processes historical inputs to help the user understand directional conditions. Each trader should apply their own risk plan and confirm levels before acting on any idea.

FVG Maxing - Fair Value Gaps, Equilibrium, and Candle Patterns
What this script does
This open-source indicator highlights 3-candle fair value gaps (FVGs) on the active chart timeframe, draws their midpoint ("equilibrium") line, tracks when each gap is mitigated, and optionally marks simple candle patterns (engulfing and doji) for confluence. It is intended as an educational tool to study how price interacts with imbalances.
3-candle bullish and bearish FVG zones drawn as forward-extending boxes.
Equilibrium line at 50% of each gap.
Different styling for mitigated vs unmitigated gaps.
Compact statistics panel showing how many gaps are currently active and filled.
Optional overlays for bullish/bearish engulfing patterns and doji candles.
1. FVG logic (3-candle gaps)
The script focuses on a strict 3-candle definition of a fair value gap:
Three consecutive candles with the same body direction.
The wick of candle 3 is separated from the wick of candle 1 (no overlap).
A bullish gap is created when price moves up fast enough to leave a gap between candle 1 and 3. A bearish gap is the mirror case to the downside.
In Pine, the core detection looks like this:
// Three candles with the same body direction
bull_seq = close > open and close > open and close > open
bear_seq = close < open and close < open and close < open
// Wick gap between candle 1 and candle 3
bull_gap = bull_seq and low > high
bear_gap = bear_seq and high < low
// Final FVG flags
is_bull_fvg = bull_gap
is_bear_fvg = bear_gap
For each detected FVG:
Bullish FVG range: from high up to low (gap below current price).
Bearish FVG range: from low down to high (gap above current price).
Each zone is stored in a custom FVGData structure so it can be updated when price later trades back inside it.
2. Equilibrium line (0.5 of the gap)
Every FVG box gets an optional equilibrium line plotted at the midpoint between its top and bottom:
eq_level = (top + bottom) / 2.0
right_index = extend_boxes ? bar_index + extend_length_bars : bar_index
bx = box.new(bar_index - 2, top, right_index, bottom)
eq_ln = line.new(bar_index - 2, eq_level, right_index, eq_level)
line.set_style(eq_ln, line.style_dashed)
line.set_color(eq_ln, eq_color)
You can use this line as a neutral “fair value” reference inside the zone, or as a simple way to think in terms of premium/discount within each gap.
3. Mitigation rules and styling
Each FVG stays active until price trades back into the gap:
Bullish FVG is considered mitigated when the low touches or moves below the top of the gap.
Bearish FVG is considered mitigated when the high touches or moves above the bottom of the gap.
When that happens, the script:
Marks the internal FVGData entry as mitigated.
Softens the box fill and border colors.
Optionally updates the label text from "BULL EQ / BEAR EQ" to "BULL FILLED / BEAR FILLED".
Can hide mitigated zones almost completely if you only want to see unfilled imbalances.
This allows you to distinguish between current areas of interest and zones that have already been traded through.
4. Candle pattern overlays (engulfing and doji)
For additional confluence, the script can mark simple candle patterns on top of the FVG view:
Bullish engulfing — current candle body fully wraps the previous bearish body and is larger in size.
Bearish engulfing — current candle body fully wraps the previous bullish body and is larger in size.
Doji — candles where the real body is small relative to the full range (high–low).
The detection is based on basic body and range geometry:
curr_body = math.abs(close - open)
prev_body = math.abs(close - open )
curr_range = high - low
body_ratio = curr_range > 0 ? curr_body / curr_range : 1.0
bull_engulfing = close > open and close < open and open <= close and close >= open and curr_body > prev_body
bear_engulfing = close < open and close > open and open >= close and close <= open and curr_body > prev_body
is_doji = curr_range > 0 and body_ratio <= doji_body_ratio
On the chart, they appear as:
Small triangle markers below bullish engulfing candles.
Small triangle markers above bearish engulfing candles.
Small circles above doji candles.
All three overlays are optional and can be turned on or off and recolored in the CANDLE PATTERNS group of inputs.
5. Inputs overview
The script organizes settings into clear groups:
DISPLAY SETTINGS : Show bullish/bearish FVGs, show/hide mitigated zones, box extension length, box border width, and maximum number of boxes.
EQUILIBRIUM : Toggle equilibrium lines, color, and line width.
LABELS : Enable labels, choose whether to label unmitigated and/or mitigated zones, and select label size.
BULLISH COLORS / BEARISH COLORS : Separate fill and border colors for bullish and bearish gaps.
MITIGATED STYLE : Opacity used when a gap is marked as mitigated.
STATISTICS : Toggle the on-chart FVG statistics panel.
CANDLE PATTERNS : Show engulfing patterns, show dojis, colors, and the body-to-range threshold that defines a doji.
6. Statistics panel
An optional table in the corner of the chart summarizes the current state of all tracked gaps:
Total number of FVGs still being tracked.
Number of bullish vs bearish FVGs.
Number of unfilled vs mitigated FVGs.
Simple fill rate: percentage of tracked FVGs that have been marked as mitigated.
This can help you study how a particular market tends to treat gaps over time.
7. How you might use it (examples)
These are usage ideas only, not recommendations:
Study how often your symbol mitigates gaps and where inside the zone price tends to react.
Use higher-timeframe context and then refine entries near the equilibrium line on your trading timeframe.
Combine FVG zones with basic candle patterns (engulfing/doji) as an extra visual anchor, if that fits your process.
Hope you enjoy, give your feedback in the comments!
- officialjackofalltrades

VectorCoresAI SMA + Bollinger Fusion v1VectorCoresAI — SMA + Bollinger Fusion (Free)
A clean, modern visual tool combining four key SMAs with an adaptive Bollinger structure.
This script merges two of the most widely used charting concepts into one simple, readable view:
Included
✔ SMA 21
✔ SMA 50
✔ SMA 100
✔ SMA 200
✔ Bollinger Bands with adjustable length + multiplier
✔ Adaptive “Fusion Squeeze” shading to highlight compression phases
✔ Optional visibility toggles for each SMA
✔ Lightweight, non-intrusive overlay
What this indicator is designed for
This tool helps traders quickly understand:
Trend alignment using the 21/50/100/200 SMAs
Volatility conditions around the Bollinger midline
Price compression and expansion
Early awareness of breakout environments
Clean visual structure without clutter
Everything is intentionally simple and transparent.
No predictions, no signals, no trading advice — just clean chart structure.
Why this version is unique
Instead of using standard Bollinger visuals, this Fusion edition uses subtle adaptive shading to show when the bands contract.
This makes compression zones instantly visible without overwhelming the chart.
The SMAs are fixed to widely-used trend levels, giving consistent readings across all markets and timeframes.
Who this is for
Newer traders who want a clear introduction to SMAs + Bollinger Bands
Experienced traders who want a lightweight visual tool
Anyone building structure-based strategies
Users of the VectorCoresAI suite who want a simple companion tool
Notes
This indicator is part of the VectorCoresAI Free Tools collection.
All logic is open-source and educational only.
More tools coming soon.

Universal Lot Size Calculator (Forex, Index, Metals)Multi-functional lot size calculator with support for various instruments
🎯 MAIN FEATURES:
Universal — works with Forex, indices, metals, and custom instruments
Auto-detect — automatically detects instrument type by ticker
Precise position sizing - considering risk and currency conversions
Currency conversion — automatic conversion between deposit currencies
Advanced visualization — entry, stop-loss, take-profit lines
Smart table — convenient display of all parameters
⚙️ SETTINGS GROUPS:
📈 Instrument Settings
Instrument Type — selection: Auto, Forex, Index, Metals, Custom
Custom Contract Size — manual contract size configuration
Use Manual Exchange Rate — manual rate for currency conversion
💰 Account & Risk Settings
Deposit Currency — account currency (USD, EUR, GBP, CHF, JPY)
Account Size — deposit amount
Risk in % — risk percentage from deposit
🎯 Price Levels
Entry Price — entry price
Stop Price — stop-loss price
Target Price — take-profit price
Color settings for each line
📊 Risk/Reward Settings
Manual Target Price — manual TP setting
Show R Levels — display profit levels in R multiples
Show only last R level — show only the last R level
Number of R Levels — number of R levels (1-10)
🎨 Line Styles & Table Appearance
Line style settings (solid, dashed, dotted)
Line width
Table position and size
Color schemes
📈Supported instrument types:
Forex — standard lot 100,000
Indices — E-mini futures (US100=20, SP500=50, US30=5, DAX=25)
Metals — Gold=100 oz, Silver=5000 oz
Custom — user-defined contract size
📱 KEY FEATURES:
- Auto instrument detection:
Indices: US100, SP500, US30, DAX
Metals: XAUUSD (Gold), XAGUSD (Silver)
Forex: all currency pairs
- Smart table with key parameters:
Instrument type and contract size
Account size and risk
Entry/exit prices
Calculated lot size
- Visual elements:
Dynamic level lines
Labels with profit/loss calculations
R-levels for target prices
- Currency conversion:
Automatic rate fetching
Support for USD, EUR, GBP, CHF, JPY
Manual rate setting when needed
⚠️ IMPORTANT NOTES:
Contract sizes may vary between brokers
For CFD brokers use Custom type with Contract Size = 1
During weekends currency rates may be unavailable — use manual rate
When trading in different currencies verify conversion accuracy
🚀 HOW TO USE:
Select instrument type (Auto for auto-detection)
Set deposit size and account currency
Define risk percentage (1-100%)
Specify prices for entry, stop-loss, and take-profit
Use calculated lot to open positions
⚠️ RESETTING CALCULATIONS:
To reuse the calculator with new price levels, you need to:
Right-click on the indicator's table/chart
Select "Reset Points" from the context menu
OR manually update all three price levels (Entry, Stop Loss, Take Profit) in the settings

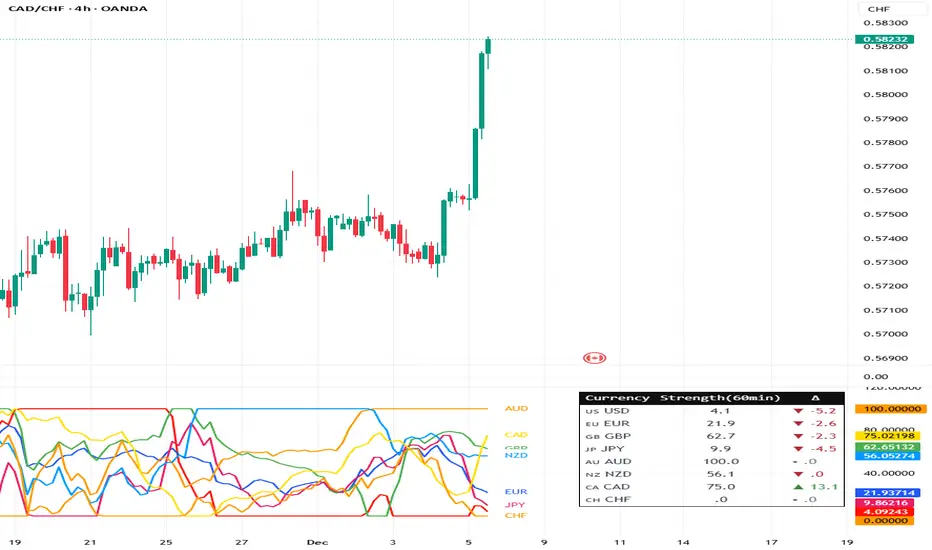
Currency Strength Meter (8 Majors) — invincible3
📊 Currency Strength Meter (8 Majors) — Description
The Currency Strength Meter (8 Majors) calculates the relative performance of the major global currencies — USD, EUR, GBP, JPY, AUD, NZD, CAD, CHF — using aggregated logarithmic returns across all major FX pairs. Strength values are normalized on every bar, allowing users to quickly identify the strongest and weakest currencies at any moment in time.
Each currency’s strength is computed from a basket of 7 related currency pairs, smoothed with EMA, converted into z-scores, and finally normalized to a 0–100 scale for easy comparison.
A built-in table displays the real-time strength for all currencies, along with bar-to-bar delta and directional arrows.
🔶 SETTINGS
General
Broker Prefix
Select the broker symbol prefix used for pair requests (e.g., OANDA:, FX_IDC:).
Calculation Timeframe
Timeframe used to calculate the log returns of currency pairs.
Higher timeframes reduce noise, lower timeframes increase sensitivity.
Lookback Bars
Number of bars (on the calculation timeframe) used to measure logarithmic performance.
Smoothing (EMA)
Smooths currency strength with an EMA of selectable length.
Plot Lines
Option to display the normalized strength of each currency (0–100) directly on the chart.
🔹 Strength Meter Table
Show Table
Enables the on-chart strength meter table.
Show ▲▼ Delta Arrows
Displays directional arrows indicating bar-over-bar momentum:
▲ increasing strength
▼ decreasing strength
• neutral
Size
Controls the table text size (Tiny → Huge).
Layout
Shows:
Currency name & flag
Strength (0–100)
Delta (current – previous bar)
🔶 USAGE
This indicator helps traders quickly determine which currencies are strong and which are weak , and how that strength evolves over time.
Because currencies are evaluated relative to one another , trend strength becomes easier to identify across FX pairs.
Use cases include:
Finding strong vs. weak currency pair combinations
Confirming trend continuation or exhaustion
Identifying momentum shifts through the delta column
Spotting early reversals when strength begins to diverge
Comparing currency performance over multiple timeframes
📈 Example Interpretation
If the USD shows:
Strength = 82
Delta = +3 (▲)
…USD is not only strong, but also getting stronger relative to the previous bar.
If AUD shows:
Strength = 22
Delta = -5 (▼)
…AUD is weak and weakening further.
This makes strong/weak pairing intuitive:
Prefer strong vs weak pairs (e.g., USD/AUD if USD strong & AUD weak)
Avoid neutral or mixed-strength pairs
🔶 DETAILS
Currency Strength Calculation
For each currency pair, the indicator calculates the log-return over the selected lookback window.
Each currency aggregates 7 major related pairs to form a composite strength value.
The aggregated value is smoothed using EMA.
All 8 currencies are converted into z-scores, then normalized to a 0–100 scale for cross-sectional comparison.
A bar-to-bar delta is computed to reveal strengthening or weakening momentum.
This structure ensures the indicator remains stable, consistent, and highly responsive for intraday and higher-timeframe trading.
FX OSINT - Institutional Midnight Intelligence For ForexFX OSINT — Institutional Midnight Intelligence For Forex
See Your FX Charts Like an Intelligence Briefing, Not a Guess
If you’ve ever stared at EURUSD or GBPJPY and thought:
Where is the real liquidity?
Is this move sponsored by smart money or just noise?
Am I buying into premium or discount?
…then FX OSINT is designed for you.
FX OSINT (Forex Open Source Intelligence) treats the FX market the way an analyst treats an investigation:
Collect open‑source signals from price, time, and volatility.
Map out liquidity, structure, and sessions in a repeatable way.
Present them in a clean, non‑cluttered dashboard so you can read context quickly.
No rainbow spaghetti. No 12 indicators stacked on top of each other. Just structured information, midnight visuals, and a clear read on what the market is doing right now.
Why FX OSINT Exists
Many FX traders run into the same problems:
Overloaded charts – multiple indicators fighting for space, none talking to each other.
Signals with no context – arrows that ignore structure, sessions, and liquidity.
Tools not tuned for FX – generic indicators that don’t care what pair you are on.
FX OSINT brings this together into one FX‑focused framework that:
Understands structure : BOS/CHOCH, swings, and trend across multiple timeframes.
Respects liquidity : sweeps, order blocks, and FVGs with controlled visibility.
Reads volatility & ADR : how far today’s range has developed.
Knows the clock : London, New York, and key killzones.
Scores confluence : a 0–100 engine that summarizes how much is lining up.
FX OSINT is built for traders who want structured, institutional‑style logic with a disciplined, midnight‑themed UI —not flashing buy/sell buttons.
1. Midnight Dashboard — Top‑Right Intelligence Panel
This panel acts as your compact “situation room”:
CONFLUENCE — 0–100 score blending trend alignment, volatility regime, sessions, liquidity events, order blocks, FVGs, and ADR context.
REGIME — Low / Building / Normal / Expansion / Extreme, driven by ATR relationships, so you know if you’re in chop, trend, or expansion.
HTF / MTF / LTF TREND — Higher‑, medium‑, and current‑timeframe bias in one place, so you see if you are trading with or against the larger flow.
ADR USED — How much of today’s typical range has already been consumed in percentage terms.
PIP VALUE — Approximate pip size per pair, including JPY‑style pairs.
Everything is bold, legible, and color‑coded, but the layout stays minimal so you can:
Look once → understand the context.
2. Structure, BOS, CHOCH — Smart‑Money‑Style Skeleton
FX OSINT tracks swing highs and lows, then shows how structure evolves:
Trend logic based on evolving swings, not just a moving average cross.
BOS (Break of Structure) when price expands in the direction of trend.
CHOCH (Change of Character) when behavior flips and the market structure changes.
Labels are selective, not spammy . You don’t get a tag on every minor wiggle—only when structure meaningfully shifts, so it’s easier to answer:
"Are we continuing the current leg, or did something actually change here?"
3. Liquidity Sweeps, Order Blocks & FVGs — The OSINT Layer
FX OSINT treats liquidity as a key information layer:
Liquidity sweeps — Detects when price spikes through recent highs/lows and then snaps back, flagging potential stop runs.
Order blocks — The last opposite candle before a displacement move, drawn as controlled boxes with limited lifespan to avoid clutter.
Fair Value Gaps (FVGs) — Three‑candle imbalances rendered as precise zones with a cap on how many can exist at once.
Under the hood, boxes are managed so your chart does not become a wall of old zones:
// Draw Order Blocks with overlap prevention
if isBullishOB and showOrderBlocks
if array.size(obBoxes) >= maxBoxes
oldBox = array.shift(obBoxes)
box.delete(oldBox)
newBox = box.new(bar_index , low , bar_index + obvLength, high ,
border_color = bullColor, bgcolor = bullColorTransp,
border_width = 2, extend = extend.none)
array.push(obBoxes, newBox)
Box limits keep the number of zones under control.
Borders and transparency are tuned so you still see price clearly.
You end up with a curated liquidity map , rather than a chart buried under every level price has ever touched.
4. Volatility, ADR & Sessions — Time and Range Intelligence
FX OSINT runs a Volatility Regime Analyzer and an ADR engine in the background:
Volatility regime — Five states (Low → Extreme) derived from fast vs. slow ATR.
ADR bands — Daily high/mid/low projected from the current daily open.
ADR used % — How far today’s move has traveled relative to its typical range.
On the time side:
Asia, London, New York sessions are softly highlighted with a single active background to avoid overlapping colors.
Killzones (e.g., London and New York opens) can be emphasized when you want to focus on where significant moves often begin.
Together, this helps you answer:
"What time is it in the trading day?"
"How stretched are we?"
"Is expansion just starting, or are we late to the move?"
5. ICT‑Style Add‑Ons — BOS/CHOCH, Premium/Discount, and Confluence
For modern FX / ICT‑inspired workflows, FX OSINT includes:
BOS / CHOCH labels — Clear structural shifts based on swings.
Premium / Discount zones — 25%, 50%, 75% levels of the daily range, so you know if you are buying discount in an uptrend or selling premium in a downtrend.
Confluence score — A single number summarizing how many conditions line up in the current context.
Instead of replacing your plan, FX OSINT compresses your checklist into the chart:
Structure
Liquidity
Session / Time
Volatility / ADR
Higher‑timeframe alignment
When these agree, the dashboard reflects it. When they don’t, it stays neutral and lets you see the conflict.
How To Use FX OSINT
FX OSINT is not a signal bot. It is an information engine that organizes context so you can apply your own plan.
A typical workflow might look like:
Start on higher timeframes (e.g., H4/D1) to form directional bias from structure, volatility regime, and ADR context.
Move to intraday timeframes (e.g., M15/H1) around your chosen sessions (London and/or New York).
Look for confluence :
HTF / MTF / LTF trends aligned.
Price in discount for longs or premium for shorts.
Recent liquidity sweep into a meaningful OB or FVG.
Confluence score at or above a level you consider significant.
Then refine entries using BOS/CHOCH on lower timeframes according to your own risk and execution rules.
FX OSINT aims to make sure you do not enter a trade without seeing:
Where you are in the day (ADR and sessions).
Where you are in the volatility cycle (regime).
Who currently appears in control (structure and trend).
Which liquidity was just targeted (sweeps and zones).
Design Choices and Scope
FX OSINT was designed around a few clear constraints:
FX‑focused — Logic and filters tuned for FX majors, minors, exotics, and metals. It is intended for FX markets, not for every possible asset class.
Open‑source — The full Pine Script code is available so you can read it, learn from it, and adapt it to your own workflow if needed.
Clear themes — Two main visual styles (e.g., dark institutional “midnight” and a lighter accent variant) with a focus on readability, not visual noise.
Chart‑friendly — Panels use fixed areas, session highlights avoid overlapping, and boxes are capped/pruned so the chart remains usable.
FX OSINT is for only Forex pairs, not anything else!
Hope you enjoyed and remember your Open Source Intelligence Matters 😉!
-officialjackofalltrades

AI Chakra for Global Markets by Pooja🌐 AI Chakra for Global Markets by Pooja
⚡ Advanced Multi-Signal Trading Framework for Forex & Crypto
AI Chakra is a complete institutional-grade market analysis system, combining
Trend + Structure + Momentum + Volatility + Breakouts + Multi-TF Context + Smart Levels
into a single clean and powerful charting tool.
Designed especially for Forex and Crypto, where speed, precision and clarity matter most.
✨ Key Features
1️⃣ 🎯 Smart Auto Buy/Sell Signal System
Signals appear only when multiple conditions align:
✔️ Buy Sell Signals include:
🟢 Supertrend in bullish zone
💪 RSI momentum in upper strength zone
🔄 CHoCH or BOS supporting upward shift
🚀 Breakout above key levels (Prev-Day High)
⚙️ Optional filters: ADX-Volatility + RSI-MA Protection
✔️ Sell Signals include:
🔴 Supertrend bearish
📉 RSI in weakness zone
🔄 CHoCH/BOS supporting downward structure
🕳️ Breakout below previous-day low
⚙️ Optional filters for momentum validation
📌 Signals are printed as clean labels — visually distinct and easy to interpret.
2️⃣ 🧠 Smart Money Concepts (SMC Suite)
Built-in structural analysis for professional traders:
🔶 CHoCH (Change of Character)
🔷 BOS (Break of Structure)
Every CHoCH/BOS is plotted with:
Horizontal structural level
Precision labels
ATR-adjusted spacing to avoid overlap
Perfect for identifying:
✔️ Trend reversals
✔️ Continuation breaks
✔️ Manipulation zones
✔️ Smart entry areas
3️⃣ 📊 Multi-Timeframe Trend Dashboard (Top-Down View)
A clean institutional-level dashboard across:
1m ▸ 5m ▸ 15m ▸ 30m ▸ 1H ▸ 4H ▸ 1D ▸ 1W ▸ 1M
Each timeframe evaluates:
EMA alignment
VWAP alignment
Supertrend direction
Shows 🔵 Bullish, 🔴 Bearish, ⚪ Neutral
in a visually intuitive format.
4️⃣ 📐 Auto Trendline System + Breakout Detection (Optional Module)
When enabled:
Detects swing highs/lows automatically
Draws dynamic support/resistance trendlines
Uses ATR / Stdev / Linear Regression slopes
Extends lines into future
Marks Breakout events with labels
Ideal for:
✔️ Crypto volatility
✔️ Forex swings
✔️ Breakout traders
✔️ Channel/wedge detection
5️⃣ 🏛️ Institutional Levels – Traditional Pivot Points
Includes complete dynamic Support/Resistance map:
Daily / Weekly / Monthly
Quarterly / Yearly
Multi-Year levels
Adjustable:
Line width
Line color
Price labels (Left/Right)
Works perfectly for:
XAUUSD
GBPJPY
EURUSD
BTCUSDT
NAS100
US30
📌 6. Volatility & Momentum Safety Filters (Optional)
ADX Filter
Allows signals only when volatility/trend strength is acceptable
Avoids signals in low-volatility sideways markets
RSI-MA Filter
Detects fake breakouts
Evaluates RSI displacement & momentum slope
Keeps only reliable directional conditions
These filters help refine signals for Forex (high-flow sessions) and Crypto (high-volatility assets).
📌 7. Previous-Day High/Low Break Detection
A pure price-action breakout feature tuned for global markets:
Detects clean breaks of yesterday’s high (bullish strength)
Detects breaks of yesterday’s low (bearish weakness)
Auto-avoids duplicate prints
Works extremely well in:
XAUUSD
GBPJPY
BTCUSDT
ETHUSDT
Indices like NAS100 or US30
6️⃣ 📡 JSON-Ready Alerts (Webhook Compatible)
Send signals directly to:
Telegram bots
Discord servers
Custom trading bots
Automation platforms
Every Buy/Sell alert includes JSON payload support.
🌍 Optimized for Global Markets
Forex
EURUSD • GBPJPY • XAUUSD • USDJPY • GBPUSD • AUDUSD
Majors, minors, exotics supported.
Crypto
BTC • ETH • SOL • BNB • XRP • Futures & Spot.
Timeframes Supported
Scalping: 1m–15m
Intraday: 30m–4H
Swing: 1D–1W–1M
⚠️ Policy-Safe Disclaimer
This script is a technical analysis tool, not financial advice.
It does not guarantee profits or automate trading decisions.
Always verify signals with your own strategy and risk management.
🌟 Final Summary
AI Chakra unifies:
📈 Trend
🧠 Structure
🎯 Signals
💹 Momentum
🔥 Breakouts
🏛️ Institutional Levels
🧩 Multi-TF Logic
🔐 ACCESS
This version is an Invite-Only Script.
Access is granted manually.
🛡 Support
This is an invite-only indicator.
Approved users may contact the author via the “Author’s Instructions” section on TradingView for help or usage guidance.

Finlu Momentum PRO What it does
Finlu Momentum PRO analyzes real price momentum and shows when the market is entering or leaving extreme zones, highlighting potential reversals or continuations with confirmation. It plots clean visual signals and can trigger real-time alerts.
Who it’s for
Traders who want to improve their entry and exit timing while avoiding the noise of traditional oscillators.
Recommended timeframes
15 min, 1 h, 4 h
Markets
Forex, indices, gold and cryptocurrencies.
Includes
Invite-only indicator: Finlu Momentum PRO
10-minute quick-start video guide
Risk management template
How to get access
Purchase access on the official page: finlutrading.systeme.io and enter your exact TradingView username at checkout.
Alternatively, you can send me a DM on Instagram @finlu_trading with the message “Finlu Momentum PRO access” to get the instructions.
Notes
Educational use only. Single-user license. Source code is not disclosed. Redistribution or reselling is strictly prohibited.


ATM PROThe world’s strongest indicator that combines multiple indicators together, providing you with entry points, targets, and stop-loss levels with extreme accuracy. You can adjust its inputs to suit Forex and crypto pairs according to your needs. It contains these tools, and you can modify them based on your requirements.
المؤشر الاقوى عالميا الذي جمع عدة مؤشرات معا , من خلاله سيعطيك نقاط ( دخول واهداف وايقاف خسارة ) بدقة متناهية وتستطيع ان تعدل المدخلات ليتناسب مع ازواج الفوركس والكريبتو بشكل يتناسب مع ما تحتاجه
يحتوي على هذه الادوات ويمكنك تعديلها حسب متطلباتك
SHORT EMA
LONG EMA
TREND EMA
MACD SHORT
MACD LONG
MACD SIGNAL
RSI LENGTH
ATR LENGTH
VOLUME MULTIPLIER
ATR TARGET 1.2.3.4.5
STOP LOSS MULTIPLIER
BY ATM TEAM

FusionFlow Pro – Trend & Regime🌀 FusionFlow Pro — Trend & Regime
Introduction
FusionFlow Pro is a visual trend-and-regime map designed for traders who prefer clarity over noise.
It blends multiple concepts—trend direction, volatility, volume behavior, higher-timeframe bias, and a smooth neon-gradient ribbon—into a single, readable structure.
This tool was built over many revisions and experiments, and it’s offered freely for the community. The goal is simple: provide a clean way to understand market context without overwhelming the chart.
About the Indicator
FusionFlow Pro combines several market components into one display:
• Trend Engine
Two adaptive moving averages form the core directional structure. Their separation, strength, and interaction define whether the market is leaning bullish, bearish, or neutral.
• Regime Classifier
The script can interpret either ADX or Choppiness Index to determine whether conditions favor trending behavior or range-bound phases.
• Volume & Momentum Influence
Volume expansion and short-term momentum add additional context, helping highlight when market participation is rising or cooling.
• Higher-Timeframe Bias (HTF)
The option to reference a larger timeframe gives users a broader directional backdrop while still trading on their preferred interval.
• Neon Ribbon Visualization
The slow MA forms the backbone of a multi-gradient, distance-based ribbon.
When price hugs the ribbon, the fill becomes subtle and transparent; as price moves away, the ribbon becomes more visible.
This creates an intuitive sense of distance, pressure, and trend engagement.
• HUD Panel
A compact top-right panel summarizes the current trend state, regime, volume condition, HTF bias, and most recent event.
It acts as a quick reference so the chart stays readable even at fast timeframes.
Color Interpretation
FusionFlow Pro uses color to convey structure at a glance:
Ribbon Line:
• Uptrend: green-cyan tone
• Downtrend: soft red-magenta tone
• Neutral: cool gray-blue
Ribbon Fill:
A neon gradient cycles from lime → aqua → blue → violet → soft red.
The specific color is determined by the slow MA’s position inside a 50-bar normalization window.
Opacity Behavior:
• Near the ribbon: color is more pronounced
• Approaching the candles: the fill fades smoothly
• At the extremes: almost fully transparent
This tapered fade is intentional—it helps the shape remain visible without overwhelming the candles underneath.
HUD Colors:
Each HUD value shifts based on conditions—bullish, bearish, neutral, trending, choppy, strong volume, etc.—making it easy to read with peripheral vision.
Settings & Customization
FusionFlow Pro allows users to customize its behavior without assuming any specific market or style.
Different symbols—indices, crypto, commodities, forex, individual stocks—can have very different volatility and rhythm. Because of that, many traders tweak the MA lengths, ATR multiplier, volume factor, and regime settings depending on the symbol or timeframe they prefer.
Shorter lengths generally create a more reactive environment; longer lengths smooth out noise. ATR buffer and volume requirements can be increased or reduced depending on how tightly or loosely the user wants FusionFlow Pro to respond.
Instead of prescribing “best settings,” FusionFlow Pro stays neutral and flexible.
Experimenting with adjustments is part of the workflow, and finding a comfortable configuration is encouraged.
Disclaimer
This script is published purely for chart visualization and educational use.
It does not provide financial advice, does not guarantee outcomes, and should not be used as a sole basis for trading decisions.
Users remain responsible for their own analysis and risk management.


ahax – CRT V0 ahax – CRT V0 is an enhanced CRT indicator that works on candlestick formations and generates BUY/SELL signals when certain conditions are met.
In this version, the classic CRT logic has been supplemented with additional controls for more stable operation, with a particular focus on reducing unnecessary signals. Each signal is generated based on the middle candlestick, and confirmation signals (+/-) can be displayed, if desired, based on the close of the next candle.
The indicator works based on the relationship between the left candlestick, the middle candlestick, and the right candlestick. It provides quick visual feedback on points such as trend reversals, potential manipulation, or reaction zones.
It is designed to be simple, clear, and clean, allowing you to adapt it to your own strategy.
It does not include any risk management or trading recommendations.

Myfxschool-HeatWave V25Introducing the MyFXSchool Leading Indicator™, a next-generation market prediction tool designed exclusively for traders who want accuracy, clarity, and early trend identification. Built using advanced price-action logic, institutional order-flow concepts, and dynamic volatility algorithms, this indicator gives you a true leading advantage—not just lagging signals.

Finlu CONTINUACIÓN PRO V3.4.7
Finlu Continuation PRO is an invite–only indicator designed to detect high–probability continuation zones after a strong impulse.
It helps you filter out noise, avoid random entries and stay aligned with the real trend.
The script was built to work together with Finlu Momentum PRO and with a structured trading plan.
You can use it on any asset (indices, forex, crypto, stocks) and on multiple timeframes, as long as you follow a clear process.
What it does
• Highlights momentum impulses and the areas where a continuation move is more likely.
• Filters many false signals that usually appear after overextended moves.
• Helps you synchronize your continuation entries with the main trend instead of fighting it.
• Can be integrated into any strategy based on structure, impulses and pullbacks.
This is not a “buy/sell” toy or a get–rich–quick tool.
It is meant for traders who value risk management, process and clarity.
Access
This is an invite–only script. If you want to use it as part of the full Finlu method, you can:
• Send me a message on Instagram @finlu_trading with the text “Quiero Continuación PRO”, or
• Join the Finlu Founders Group, where you get access to Finlu Momentum PRO, Finlu Continuation PRO and exclusive risk–management material.

Auto Position CalculatorA position sizing tool that automatically detects the instrument you're trading and calculates the correct position size based on your risk parameters.
What It Does
This indicator calculates how many contracts, lots, or shares to trade based on your account size, risk percentage, and stop loss distance. It auto-detects the instrument type and adjusts the point/pip value accordingly.
Supported Instruments
Futures: NQ, MNQ, ES, MES, YM, MYM, RTY, M2K, CL, MCL, GC, MGC
Forex: All major pairs (USD, EUR, GBP, JPY, etc.)
Index CFDs: NAS100, US500, US30, GER40, UK100
Metals: XAU, XAG
Crypto and Stocks: Automatic detection
How to Use
Set your account size and risk % in settings
Click the settings icon and place Entry, Stop Loss, and Take Profit on the chart
The position size and risk calculations appear automatically
Levels auto-reset at your chosen session (Asia, London, or New York open)
Limitations
CFD and forex pip values assume standard lot sizing - your broker may differ
Auto-detection relies on ticker naming conventions, which vary by broker/data feed
Session reset times are based on ET (Eastern Time)
