Welles Wilder MAHow to trade: Recommended for longer timeframes at least 4H. Buy when the green dot appears. Sell when the yellow dot appears. Welles Wilder moving average by XOOOOOOPine Script®指標由XOOOOOO提供33240
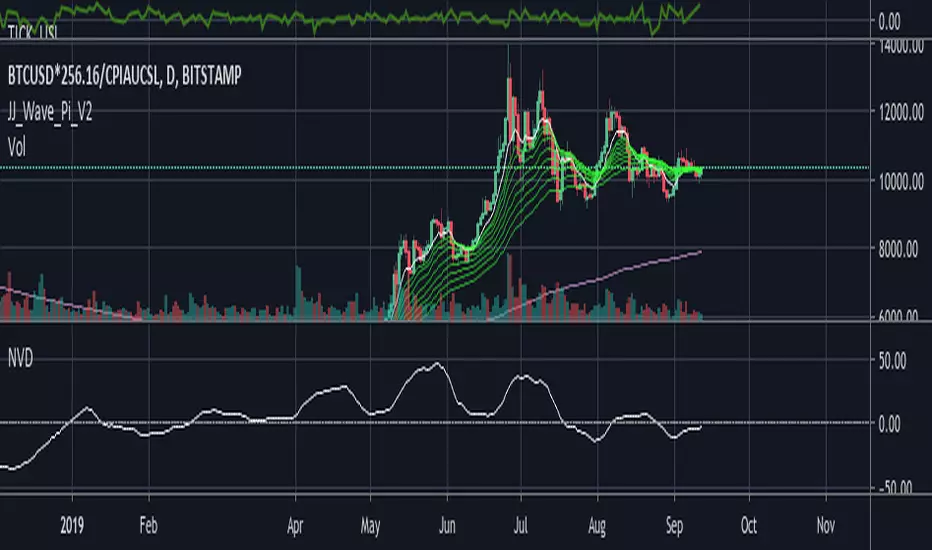
btc nominal value deviationpainfully alpha. someone w better pine/maf skillz should fix this up. Pine Script®指標由some_guy提供11
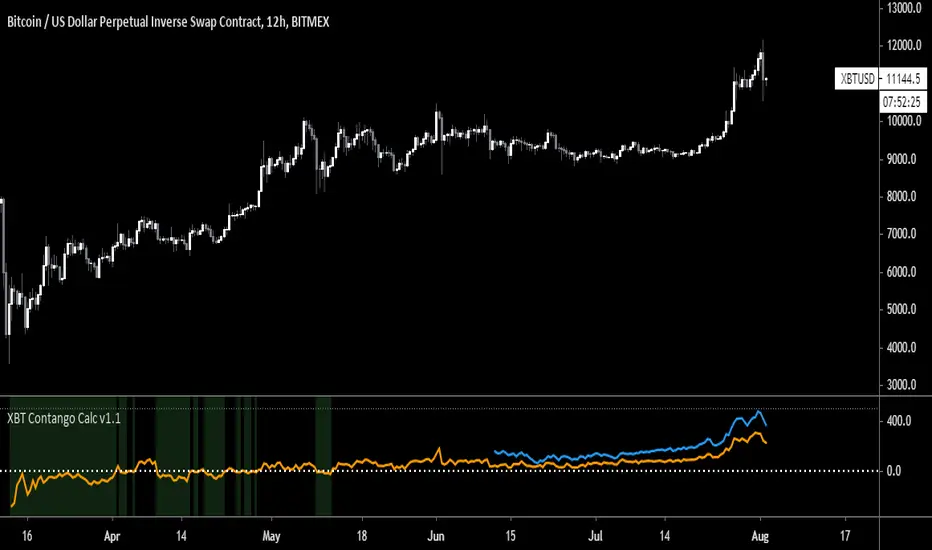
XBT Contango Calculator v1.1 This indicator measures value of basis (or spread) of current Futures contracts compared to spot. The default settings are specifically for Bitmex XBTU19 and XBTZ19 futures contracts. These will need to be updated after expiration. Also, it seems that Tradingview does not keep charts of expired contracts. If anyone knows how to import data from previous expired contracts, please let me know. This historical data could be valuable for evaluating previous XBT futures curves. Also, VERY important to understand is this indicator only works with Spot Bitcoin charts (XBTUSD, BTCUSD, etc). If you add this to any other asset chart, it would not be useful (unless you changed settings to evaluate a different Futures product). Contango and Backwardation are important fundamental indicators to keep track of while trading Futures markets. For a better explanation, Ugly Old Goat had done several medium articles on this. Please check out link below for his latest article on the subject... uglyoldgoat.com Notes on chart above should explain most of what you need to know on to use this indicator. The zero line is the spot price on the chart, so a positive value means Futures are trading at a premium (or in Contango). You can set a value of extreme Contango which will give an alert as red background (default setting is +$500). Green background will appear when Futures are trading at a discount to spot (Backwardation). Hope some people get some use out of this. This is my first attempt at coding anything, so any feedback would be greatly appreciated! BTC Donations: 3CypEdvBcvVHbqzHUt1FDiUG53U7pYWviV Pine Script®指標由SchamBTC提供已更新 44284
RSI Fibonacci Levels StrategyRSI with Fibonacci Levels Visually can be used as: - Countertrend indicator at extreme green/red lines - Follow trend indicator - Fibonacci supports and resistantes zones The strategy works as a follow trend How to trade: The indicator is more reliable in longer time frames, at least 4H Choose a fibonacci level as reference Buy when the RSI line turns green Sell when the RSI line turns red Pine Script®策略由XOOOOOO提供330
Lancelot ATR Volume MeterThis is an experiment I did a while back ago. I often think On Balance Volume is a great indicator as trend direction and volume cannot lie. However, I bumped into a few problems. It is slow, doesn't show volatility and often time it is prone to chop. That's why I added ATR to the equation. Original OBV calculation src > 0? : +volume : src < 0? -volume Modified OBV with ATR src > 0 ? +volume * (volume / atr) : src < 0? -volume * (volume / atr) I have used 2 ema for this modified OBV. ema 3 ema 18 By adding ATR to the equation we can smooth out many erratic price movement. (Stop hunting) Also, when price move slowly but steady, often prepping for a big move, this indicator will move faster. In short, this indicator prevents you from being stop hunted and also provide great entry for a trending market. Works well on BTCUSD XBTUSD, as well as other major liquid Pair. Feel free to follow me on Twitter @Lancelot_Auger for more free Alpha. Please acknowledge my effort by like and follow. And lastly, Save Hong Kong, the revolution of our times. Pine Script®指標由Lancelot_Augur提供1919805
Lancelot Band - ATR Reversal+Trending IndicatorThis is an indicator I created recently, with the mind of spotting where price might reverse and where the price is trending. You can see this as the primary indicator for your system, however, it is recommended you use this in conjunction with other confirmation indicators. This script focus solely on ATR or Average True Range. This indicator is the combination of the baseline from the Ichimoku cloud and the concept of the Keltner channel. Baseline period = 14 ATR period = 14 ATR Mult = 1.5 For reversal Long when price crossover Lower band & Stop loss at xLower band Sell when price crossunder Upper band & Stop loss at xUpper band For Trend Following Long when price crossover xUpper band and Stop loss at Upper band Short when price crossunder xLower band and Stop loss at Upper band Again, you will need other indicators to help you to succeed in this system. This indicator will not generate the best exit for your position but will generate a good entry signal when you use it with both volume indicator and exit indicator. Works well on BTCUSD XBTUSD, as well as other major liquid Pair. Feel free to follow me on Twitter @Lancelot_Auger for more free Alpha. Please acknowledge my effort by like and follow. And lastly, Save Hong Kong, the revolution of our times.Pine Script®指標由Lancelot_Augur提供已更新 359
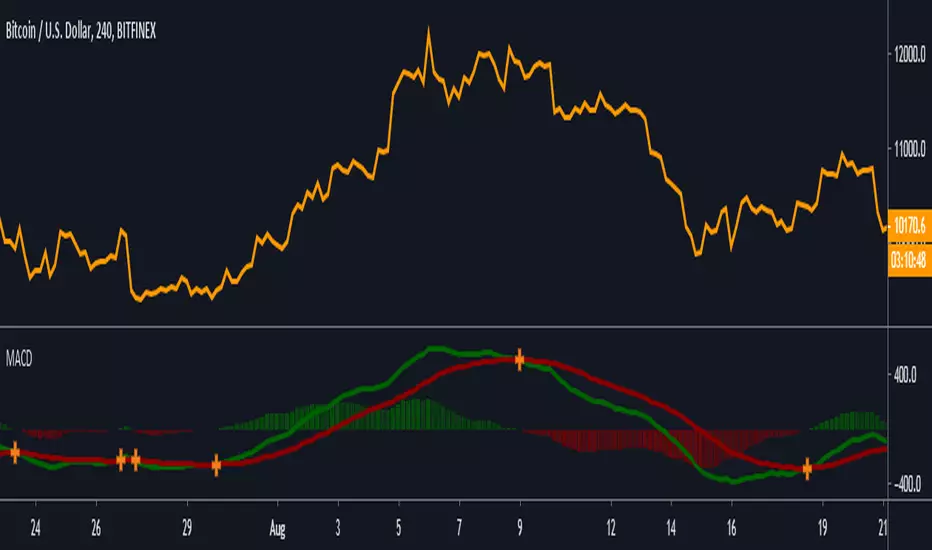
MACD [Gu5]Extremely popular indicator MACD (Moving Average Convergence/Divergence) Same design of my previous indicators Show Cross Line for a better visualization ``` Setting recommended for BTC "Fast Length" = 21 "Slow Length" = 55 "Signal Smoothing" = 14 Other markets try "Fast Length" = 12 "Slow Length" = 26 "Signal Smoothing" = 9 ``` -- El MACD (Convergencia/Divergencia de Medias Móviles) es uno de los mas populares indicadores Continuando con el mismo estilo de diseño de mis anteriores indicadores Destaca el cruce de medias para una mejor visualización Pine Script®指標由gu5tavo71提供已更新 11626
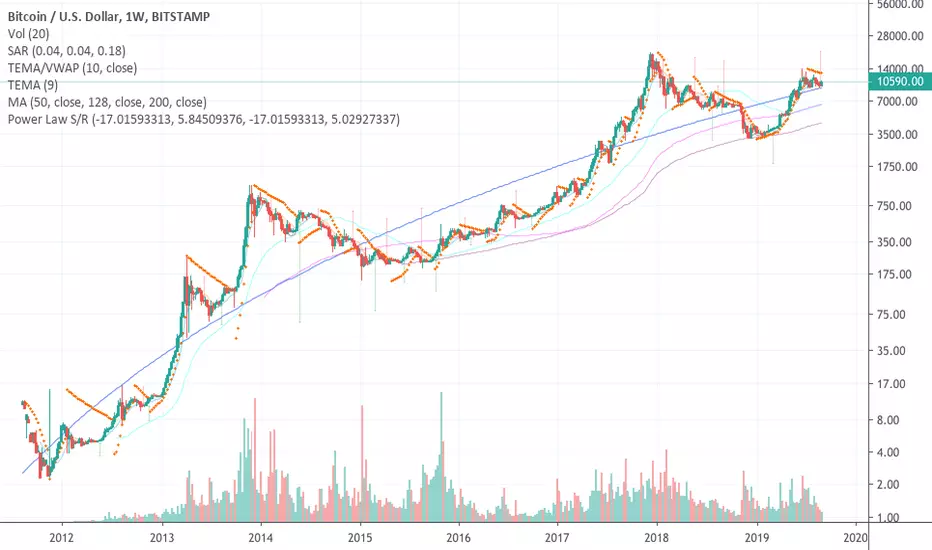
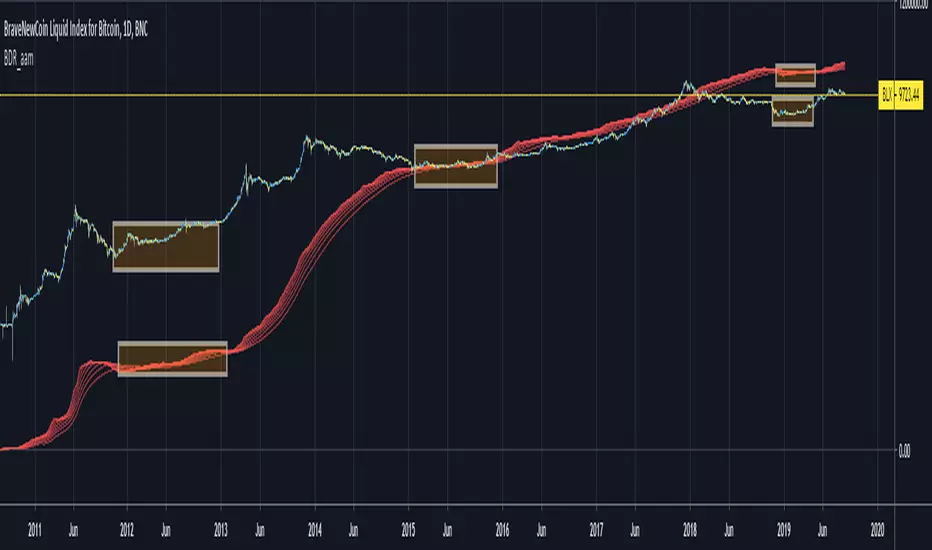
Power Law S/RThis is the power law model by Berger in script form for Tradingview. Enjoy!Pine Script®指標由mabonyi提供11126
Power Law S/RBerger's article on the Power Law Model for Bitcoin is a compelling read and gives the best evidence so far of the diminishing case for retracing below $3000, of a slowing market on a log-log plot, and reducing but continued volatility. After seeing it acts as support routinely in the last 10 years, I put together a quick little script that plots his midline curve for Bitcoin. You can change the intercept and slope but will need to do your own calculations for other curves. I hope you all like it.Pine Script®指標由mabonyi提供1150
Alert-QuarryLake Indicator Map - ATR Trend Following Strategy A lot of times I don't like my chart crowding with indicators, thus the reason for creating this script for my strategy QuarryLake. This script also comes with alert. Below is the explanation for QuarryLake I have also updated the script in version 4. This strategy consists of 3 indicators that I found works quite well together. Keltner Channel, Waddah Attah Explosion, and Volatility Stop. You can find WAE here KC Period = 200 KCATR = 5 Vstop Period = 3 Vstop Mult = 1.5 Long when close > KC, close > Vstop, WAE trendUp Short when close < KC, close < Vstop, WAE trendDown Works well on BTCUSD XBTUSD, as well as other major liquid Pair. Feel free to follow me on Twitter @Lancelot_Auger for more free Alpha. Please acknowledge my effort by like and follow. And lastly, Save Hong Kong, the revolution of our times.Pine Script®指標由Lancelot_Augur提供44218
Trend Confirmation Indicator - Triple OBVDear all, you might wonder is there a confirmation indicator that has a high hit rate, is dependable, and could rely on the information it gives you when making a decision? Here I present an indicator I developed specifically for cryptocurrency, in the minds of eliminating fakeouts and traps. Trend is always invalid then there is a lack of volume, so by tracking the momentum of price direction & volume, we can have a ballpark about where the market is moving to. On balance volume obvshort = ema3 obvmedium = ema9 obvlong = ema26 This is a lagging indicator, which means it's not good at predicting reversal. This is also the reason why long signal = obvshort > obvmedium and obvshort > obvlong shortsignal = obvshort < obvmedium and obvshort < obvlong both without obvmedium >< obvlong This indicator will not lie to you. At last Save Hong Kong, the revolution of our time.Pine Script®指標由Lancelot_Augur提供已更新 1010803
Bitcoin Difficulty Ribbon [aamonkey]This is another tool to find big cycle bottoms that is very unknown yet effective. The Difficulty Ribbon speaks to the impact of miner selling pressure on Bitcoin`s price action. When network difficulty reduces its rate of climb, miners are going out of business, leaving only the strong miners who proportionally need to sell less of their coins to remain operational, this leads to less sell pressure and more room for bullish price action. The best times to buy Bitcoin are zones where the ribbon compresses. The ribbon consists of simple moving averages of Bitcoin network difficulty so the rate of change of difficulty can be easily seen. Pine Script®指標由aamonkey提供22332
CloudRest ATR based cloudThis is an indicator I have been working on for the past 2 years, developed specifically for cryptocurrency. It is primarily a trend following indicator with great success and it performs the best in 4hrs to the weekly chart. There are two components of this indicator. The baseline from Ichimoku cloud and volatility stop . baseline period = 26 volatility stop = 1.5ATR, 3 You can view this as the main component of a trend following system but you will need other confirmation indicators to confirm your entry. Feel free to modify the script for your own system. Feel free to follow me on twitter @Lancelot_Auger I will be posting more content in the future, stay tuned. And lastly, Free hong kong, the revolution of our time! Pine Script®指標由Lancelot_Augur提供33203
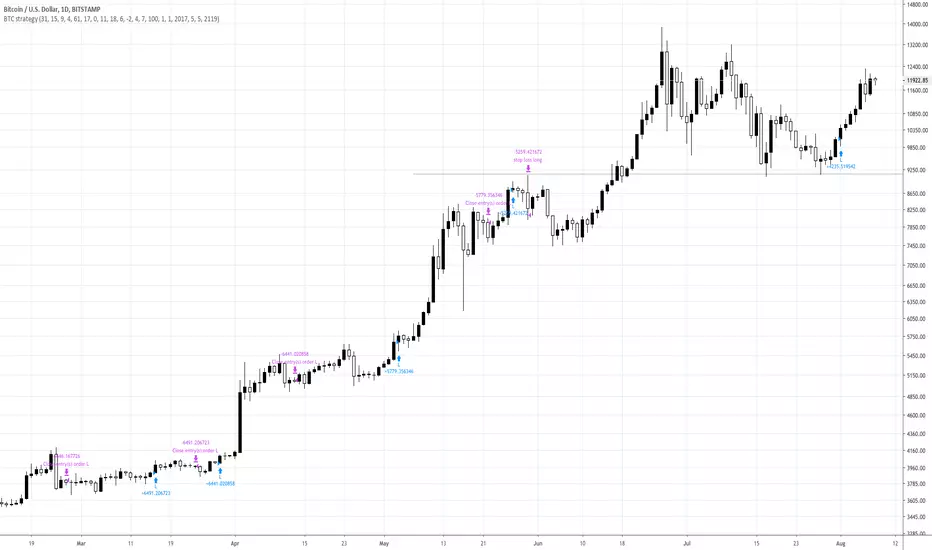
BTC strategy for margin tradingAlmost identical to the one I published before, but this one includes short orders as well. I didn't spend much time backtesting, so there may be a different set of parameters that gives better results. Please let me know if you find something!Pine Script®策略由CredibleHulk提供44228
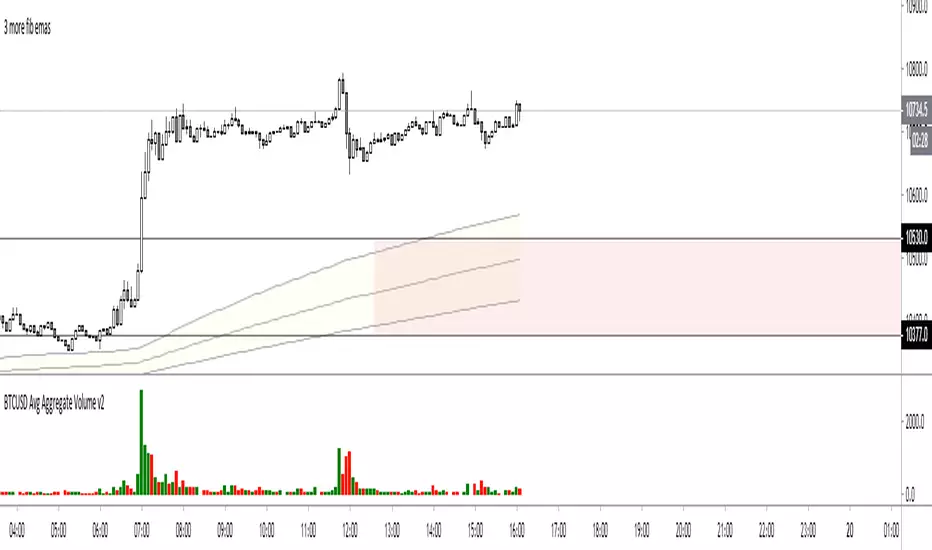
BTCUSD Avg Aggregate VolumeSimple script which gives an average volume for an aggregate of legit spot btcusd(t) exchange pairs based on user-selected period. Also including mex btc perp in there. Includes: Coinbase BTCUSD Bitstamp BTCUSD Bitfinex BTCUSD Bitflyer BTCJPY Binance BTCUSDT Huobi BTCUSD Bitmex XBTUSDPine Script®指標由king_mob提供已更新 16
Filtered Waves [NXT2017] #Linda Raschke #basics on Arthur MerrilHI BIG PLAYERS, this script I wrote for an enquiry of a tradingview-user. It should represent the Filtered Waves idea from Arthur Merril and used by Linda Raschke. It's similar like a visualization of Elliott Waves. On YouTube title "MTA UK Chapter Presentation with Linda Raschke" between 34-36 minutes Linda Raschke shows the rules for her Filterd Waves. Any questions? Ask me! King regards NXT2017 ======== TO MY PERSON I'm the second winner of the official German Forex Trading Competition in 2018. Look here to the ranks: deutsche-trading-meisterschaften.de I speak german, english and russian. My strength in trading are Wolfe Wave pattern.Pine Script®指標由NXT2017提供1212 1.7 K
Cruzamento de MM para BTC 5MSão 3 médias móveis simples. - 9 períodos - 21 períodos -105 períodos A intenção desse estudo é me dar sinais para compra quando ocorre um cruzamento da média de 9 períodos com a de 21, somente dando o sinal se o cruzamento ocorrer acima da média de 105 períodos. Para sinais de venda segue-se o mesmo raciocínio, quando a média de 9 períodos cruzar com a de 21 e estiver nesse caso abaixo da média de 105 períodos. O que eu tenho usado e tem dado bons resultados com o BTC 5M desde o início de julho, principalmente naquelas bart formations, é utilizar apenas o primeiro sinal de venda ou de compra após o cruzamento da média de 105 O sinal que se dá para compra seria o círculo verde O sinal que se dá para vendas seria o círculo vermelho Este indicador tem o propósito de eu testar a efetividade de um sistema desses. Pine Script®指標由FLeite28提供2263
Relative Vigor IndexHere we are looking at a trend strength indicator based on the Relative Vigor Index(RVI). The RVI measures trend strength by comparing the open-close and high-low ranges for the current and three most recent periods. As a zero-centered oscillator, the RVI oscillates above and below zero to signal the strength of the trend. As there are different ways to interpret the RVI, we have included 3 different modes for traders to choose from in the input option menu: 1. Zero-Crossing: The RVI Histogram will turn green when it crosses above zero and red when it crosses below. Therefore, a green RVI means the trend is bullish and red means bearish. This mode is better for longer-term swing trading in comparison to the other 2 modes. 2. Increasing / Decreasing: The RVI histogram will turn green when it is increasing(rvi >= rvi ) and red when it is decreasing. A green RVI is viewed as a bullish signal and red means bearish. This mode is a good middle-ground between the Zero-Crossing and Signal Comparison modes. 3. Signal Comparison: Here, the RVI is compared to its signal line. If the RVI is greater than its signal line, the histogram is green, indicating a bullish trend, while red means bearish. This mode is preferred for scalping. Hope everyone finds this one useful! You can check out our other invite only studies/strategies at our website: profitprogrammers.com Pine Script®指標由ProfitProgrammers提供33289
VWMA Trend FilterHere's a simple tool for determining long term trend direction using two Volume Weighted Moving Averages (VWMA). The VWMA's emphasis on volume often makes it a better measurement for trend direction than the more popular Exponential Moving Average (EMA). Trend direction is determined by comparing a fast and slow VWMA. The default length for the fast VWMA is 50 periods, while the slow uses a default length of 200. Both of these lengths can be modified in the input options menu. The default source for the VWMA's is HLC3((high + low + close) / 3). If the fast VWMA is greater than the slow VWMA, then the trend is bullish and the background color is green. If the fast VWMA is less than the slow VWMA, then it is bearish and the background color is red. We included an option to change the candle color based on whether the VWMA's indicate a bullish or bearish trend as well. Overall, this is one of those utility tools that we like to use as an overlay over the main price chart and in conjunction with other signal generating indicators. Its purpose isn't to generate buy and sell signals, but it works well as a visual confirmation tool to help traders gauge trend direction. Pine Script®指標由ProfitProgrammers提供22420
Sentiment Zone OscillatorHere's a (forgotten but still useful) Sentiment Zone Oscillator. The Sentiment Zone Oscillator takes a sum of positive price candles over a user-specified window length. Normally, a triple exponential moving average of the sum is used, but we opted to just go with a double EMA for the sake of more responsiveness. When the histogram is green it is bullish and red/pink means bears. Pine Script®指標由ProfitProgrammers提供44364
Double EMA + ATR Trend FollowerThis indicator consists of a fast and slow EMA (default lengths are 50 and 9 periods) and an upper and lower ATR band. When combined, this combination gives traders an accurate picture of both trend strength and direction. Users can modify the lengths of the fast and slow EMA , as well as the multipliers and length for the upper and lower ATR bands.Pine Script®指標由ProfitProgrammers提供300