ABC on Recursive Zigzag [Trendoscope]There are several implementations of ABC pattern in tradingview and pine script. However, we have made this indicator to provide users additional quantifiable information along with flexibility to experiment and develop their own strategy based on the patterns.
🎲 Highlights of this indicator over other ABC implementations are:
Implementation is based on recursive multi level zigzag allows bigger as well as smaller patterns to be identified
Allows users to set their trading rules with respect to entry, target and stop ratios, experiment and build their own strategy based on the ABC pattern.
Back test summary including win ratio and risk reward will help users understand the profitability based on different settings being used.
🎲 Concept of ABC Pattern
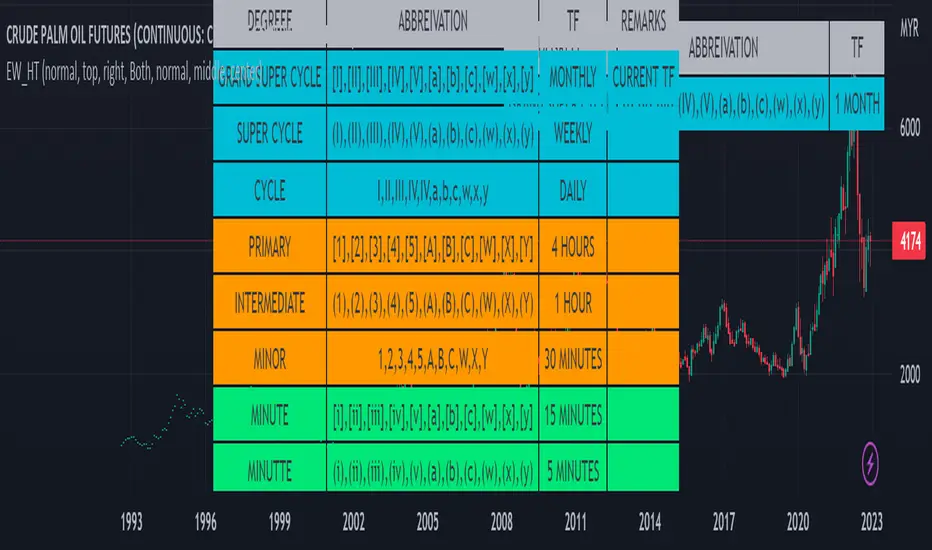
The ABC pattern, also known as the "Corrective Wave" or "Zigzag Pattern," is a fundamental concept in Elliott Wave Theory, which is widely used in technical analysis to identify and predict price movements in financial markets.
The ABC pattern is a three-wave corrective pattern that typically occurs within the context of a larger impulse or trending wave. It consists of two smaller waves in the opposite direction (A and C) separated by a corrective wave (B). These waves are labeled alphabetically and represent price movements.
Wave A (Impulse Wave): Wave A is the first leg of the ABC pattern and is characterized by a strong price move in the opposite direction of the prevailing trend. It is often driven by a fundamental or sentiment-driven event that temporarily disrupts the trend.
Wave B (Corrective Wave): Wave B is the corrective wave that follows Wave A. It represents a partial retracement of Wave A's price movement. Wave B can take various forms, such as a simple correction or a complex correction (e.g., a triangle or a flat correction). It typically doesn't retrace the entire length of Wave A.
Wave C (Impulse Wave): Wave C is the final leg of the ABC pattern and is characterized by a strong price move in the same direction as the prevailing trend. It often surpasses the starting point of Wave A and confirms the resumption of the larger trend.
🎲 Indicator Components
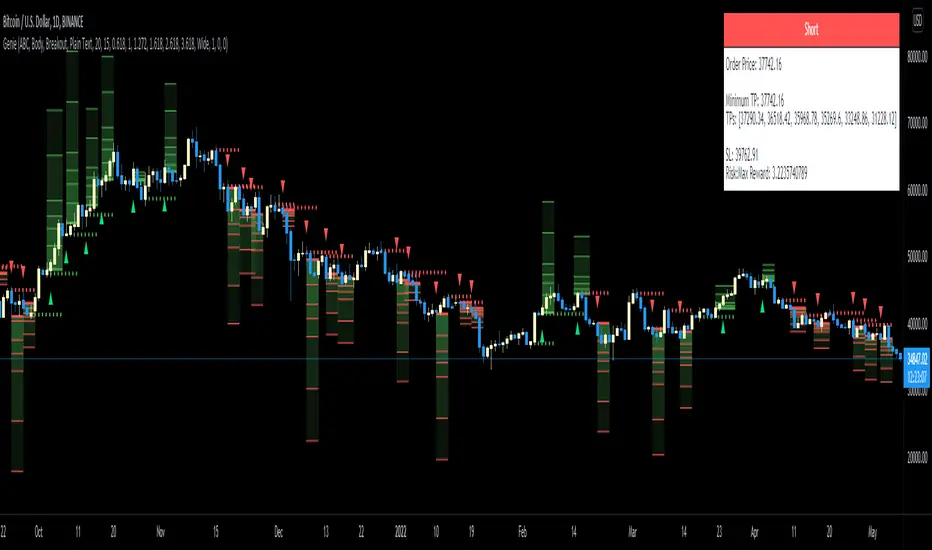
Upon loading the indicator on the chart, we can observe the following components on the chart.
Pattern Drawings is the graphical representation of present patterns. Please note that it is not necessary for patterns to be there on the chart all the time. Patterns will appear on the chart when price makes the patterns.
Trade Box is the box representing trade signals of the pattern. These trade levels are generated based on the user settings.
Summary Table is the back test summary containing details of historical pattern performance including Win Ratio and Risk Reward.
🎲 Indicator Settings
Details of each user settings are provided in the tooltips. Below is the snapshot of it.
🎲 Alerts
Basic level of alerts are built in the script using alert function to highlight the following conditions:
New ABC Pattern
Updates to existing Pattern
Both conditions will alert simple text messages. There is not much customization provided as part of this indicator. We will consider providing more options in future versions based on the interest and demand shown by users.
ABC
Conditional Chart Pattern Signals: ABC Top/BottomCCPS ABC is a set of top/bottom patterns based on three points.
Pattern Variants/Subvariants:
• UHV (Uphill Middle): The price retreats slightly and reverses to climb higher with V-shape. A downward signal of this variant points out the candle where the price might retreat again. Nonetheless, as it has been a strong uptrend with higher velocity and higher wave, the probability of a huge decrease is small. Thus, it is classified as a weak bearish signal and we should only use it as a warning, i.e., we will enter a sell position when there is another high with another bearish signal. Subvariant: UHV3.
• UHL (Uphill Top Left): When the price crawls near the top of a hill, it is higher and higher but the velocity and the wave decrease. Subvariants: UHL1 (only velocity decreases), UHL2 (only wave decreases), UHL3 (both velocity and wave decrease).
• DHC (Downhill Top Center): An increase followed by a decrease in price with higher velocity and higher wave represents the start of falling from the top of a hill. Subvariants: DHC1 (only velocity increases), DHC2 (only wave increases), DHC3 (both velocity and wave increase).
• DHR (Downhill Top Right): A small decrease followed by a larger decrease in price with higher velocity and higher wave represents the confirmation of falling from the top of a hill. Subvariants: DHR1 (only velocity increases), DHR2 (only wave increases), DHR3 (both velocity and wave increase).
• DHV (Downhill Middle): A large decrease followed by a small increase in price to form a V-shape with lower velocity yet higher wave represents the continuation of falling in the downside of a hill. Subvariant: DHV3.
• DVA (Downvalley Middle): The price gains slightly and reverses to plunge lower with A-shape. An upward signal of this variant points out the candle where the price might bounce again. Nonetheless, as it has been a strong downtrend with higher velocity and higher wave, the probability of a huge increase is small. Thus, it is classified as a weak bullish signal and we should only use it as a warning, i.e., we will enter a buy position when there is another low with another bullish signal. Subvariant: DVA3.
• DVL (Downvalley Bottom Left): When the price arrives near the bottom of a valley, it is lower and lower but the velocity and the wave decrease. Subvariants: DVL1 (only velocity decreases), DVL2 (only wave decreases), DVL3 (both velocity and wave decrease).
• UVC (Upvalley Bottom Center): A decrease followed by an increase in price with higher velocity and higher wave represents the start of rising from the bottom of a valley. Subvariants: UVC1 (only velocity increases), UVC2 (only wave increases), UVC3 (both velocity and wave increase).
• UVR (Upvalley Bottom Right): A small increase followed by a larger increase in price with higher velocity and higher wave represents the confirmation of rising from the bottom of a valley. Subvariants: UVR1 (only velocity increases), UVR2 (only wave increases), UVR3 (both velocity and wave increase).
• UVA (Upvalley Middle): A large increase followed by a small decrease in price to form an A-shape with lower velocity yet higher wave represents the continuation of rising in the upside of a valley. Subvariant: UVA3.
Wave Calculation:
• Full: Waves are calculated at middle and two edges. Forward: Waves are calculated at middle and right edge.
• Average: Waves are measured by average heights. Max: Waves are measured by max heights.
Bullish/Bearish Signal Candle Check: None/Standard/TL.
• None: Not check signal candle if it is bullish or bearish.
• Standard: Bullish candle if close is higher than open or close is higher than previous close.
• TL(c): Bullish/bearish candles follow the proprietary standard. It has more conditions than Standard.
Exit: Choose an exit mode to calculate historical performance.
• Next Occurrence: Exit of an occurrence stands at the next occurrence.
• Near Fixed Length: Exit of an occurrence stands at either a specified fixed length or the next occurrence depending on which one happens first.
Signal Label Text: Subvariant name/abbreviation.
Signal Label Tooltip:
• Total: Number of occurrences of the subvariant, including the current one.
• Entry Price ($): Close price of the signal.
• Max Profit ($): Max profit of an occurrence is calculated from after the signal until the next occurrence of the same subvariant.
• Min/Max/Average Max Profit ($): Min/max/average profit of a subvariant is calculated by getting min/max/average of max profit of all occurrences of that subvariant.
• Max Loss ($): Max loss of an occurrence is calculated from after the signal until the next occurrence of the same subvariant.
• Min/Max/Average Max Loss ($): Min/max/average loss of a subvariant is calculated by getting max/min/average of max loss of all occurrences of that subvariant.
• Win: Number of historical winning occurrences of the subvariant. An occurrence of a subvariant is defined as winning when the max profit is larger than the absolute value of the max loss.
• Min Length: Min time between occurrences of the subvariant in terms of candles.
• Max Length: Max time between occurrences of the subvariant in terms of candles.
• Average Length: Average time between occurrences of the subvariant in terms of candles.
Current Label Text: Shows information of the latest occurrence of each subvariant next to the current candle.
• Last Occurrence: Date/time in exchange timezone of the latest occurrence.
Specification & Performance:
tinyurl.com
Usage:
Enter right when the signal closes or at the open of the next candle after the signal.
Other Features:
• Non-repainting.
• Compact design.
Markets: Developed and tested on: US100. Timeframes: Developed and tested on: 30m.
ABC finderI made this script a long time again and never released it. It is a ABC Pattern finding tool. You can adjust the "Bars Back" setting to include more or less bars in the pattern. I usually have it set to 10 or 15 these settings seem to work well on most assets. The scripts allows you to set up a trade box automatically and has a call out table to make prices levels more clear and easy to read. The trade box levels can be set by fixed percentage or by pattern based fib.
Hope it helps!
Elliot Wave Helper Table█ OVERVIEW
This indicator is intend to be helper to help Elliot Wave user to properly Elliot Wave tools according to correct degree such as 12345 or ABCWXY. The abbreviation changes according to timeframe.
█ FEATURES
1. Abbreviation degree adaptive to timeframe. Eg : Subminutte for 1 minute chart, etc.
2. Works for custom timeframe. Eg : Subminutte for 1 to 4 minute chart, etc.
3. Show reference table if necessary.
█ REFERENCE
Adaptive Elliot Wave Degree Chart
█ EXAMPLES / USAGES
Genie (AB=CD Fibonacci Extensions and Peaks & Valleys)Our proprietary algorithm supports two types of Signals to choose from (and uses Matrices to keep track of the various waves): 'Fibonacci Extensions' where it spots extended waves (XABC) to predict AB=CD moves and puts the Take Profit levels accordingly to commonly used Fibonacci ratios; OR 'P&V' which stands for Peaks & Valleys (M and W) capturing full Peaks and Valleys formations to signal.
Signal Trigger for two types of positions: Breakout or Confirmation when price retraces back to them (so you wait for a candle to close away from price first to Trigger). The idea is whenever a proper Peak or Valley matching those conditions is printed, price usually reacts at those levels by doing a Reversal, so they represent potential entries .
For Confirmation signals, you want price to close away from the level first to then return to it, and that candle close is either a Close (only the close should be outside the level), Hard Close (OPEN and CLOSE outside the level) or Full Close (HIGH, OPEN, CLOSE, LOW all outside the level).
Note that the Signal is to be taken as soon as a Green or Red arrow appears (not before), based on your desired settings.
The Level of Entry is decided by the user; 'Extreme' means you want the algorithm to process based on the Wicks/Pins (Highs and Lows of candles) so while 'Body' means the Borders (Open and Close of candles). Based on this choice the Signal will change accordingly.
The indicator also provides recommended Take Profit levels as well as a Stop Loss levels. The Take Profits are measured based on the wave structure formation.
All features are configurable from the indicator's settings including setting Minimum Take Profit and Reward:Risk (RR) to filter Signals.
This indicator has Alerts for LONG and SHORT signals. You can create a new Alert, select the indicator from the "Condition" list and create it. You can create an Alert for each different timeframe if you want the indicator to monitor various timeframes and give you Alerts accordingly.
Volume Wave 7vFTJR20This is the new fully auto-adjusted wave volume, there is no other indicator like this, if you know richard wyckoff techniques, this indicator will facilitate each wave of your various assets.
1.0 -
A:
Most indicators use (fixed) candle count or pivo point to convert a buy or sell wave, this indicator uses the concept of candles, if candles and aggressive volume start to find regions on top or bottom, it is already close to enter a countertrend and reverse the wave.
1.1 -
-You have hundreds of options to change the wave, just changing 2 fields "Types" and "Adjustment".
Note: the indicator automatically updates the secondary wave!
For over a year I've come up with a default Types="1" and Adjustment="0.6"
Feel free to change this pattern, the range for types is huge, but particularly I use the default for 90% of assets I analyze for any timeframe.
if you find something better, leave it in the comments to share with other users.
1.2 - The option "Use weighted volume within the wave" changes the real volume within each wave to the average volume within each wave, it is a very good strategy to use in assets that do not have liquidity or in smaller timeframes.
++++++++++++++++
Usage strategy:
++++++++++++++++
*Note: it is necessary to use the financial volume indicator (standard) to identify the divergences within the waves.
2.0 - The concept of the indicator is to measure the financial volume in each wave of the asset, it adds the volume in each candle and accumulates within each wave of the indicator, in theory, the more volume within this wave, the more money involved in this region of price.
2.1 - The indicator has 2 fractal meters, a shorter wave and a longer wave, let's call the primary short wave and the secondary long wave.
*The longer wave is positioned at the bottom, it takes longer and there may be fall situations inside it, an example of this is when we are inside a B wave of an ABC within a larger time frame (ex: Diary).
2.2 - The primary wave (Short) is faster, it oscillates within the secondary wave.
2.3 - The Secondary (Long) wave takes longer, it tends to dictate the trend of the asset when the primary is in the same color as the secondary AT THE BEGINNING OF THE TREND, that is, after two secondary waves in red (sell) and a blue wave short between the two red ones, there is the "PROBABILITY" of the tendency to become an extremely buyer, this also happens in the opposite, two buyer waves have the "PROBABILITY" of becoming a seller.
Another example:
note: in the description above I mentioned a range or corrective movement, to have a healthy view, it is highly recommended to learn about what is a corrective or impulsive wave... for beginners, a quick explanation, understand that corrective is two movements( ABC) and impulsive are three in the countertrend (*3 in the trend direction and two correctives total 5 waves), so they can contain 3 waves within a blue wave within the indicator, you will need to understand this concept!
2.4 - After understanding the above concepts, take advantage of my indicators in the future I will include the aggressor volume within each buyer and seller wave.
*The secret of reversal is 3 moves with a candle with greater volume inside wave C or
end of seller flow without bars of volume greater than the average within a wave 5, these characteristics represent the end of the trend!
2.5 - I left a pre-fixed default configuration that I use, feel free to test other patterns, I tested it on various assets, mainly in futures markets for 1 year.
- I like your feedback and leave your settings and experiences in the comments.
Ultimate ABC Indicator by @DaviddTechThis is the indicator version of my Ultimate ABC strategy we are looking for HH & LL to create an ABC pattern.
Shorts are defined by an ABC pattern.
Short:
* Starting with a low to a Higher High
* Breaking that trend to a new low
* Creating a new Higher High (FOMO HH)
* If the price breaks below the previous HH we have our entry.
Longs:
* Starting with a Hight to a Lower Low
* Breaking that trend to a new high
* Creating a new Lower Low (FOMO LL)
* If the price breaks above the previous LL we have our entry.
Stop loss just above or below the FOMO LL/HH.
Take Profit using a Fib or Risk to Reward.
Additional features :
* Add divergences for confluence MACD/RSI
* Auto Fib levels for taking profit.
WARNING:
- For purpose educate only - My mission is to debunk fake strategies with code to find THE ONE.
- Plots EMAs and other values on chart.
- This script to change bars colors.
If you have any questions or feedback, please let me know in the comments.
Trading ABCHello Traders,
For a few months I have been getting requests from my followers about ABC pattern and finally I decided to make this indicator.
How it works?
- It creates Trend Cloud using Simple and Exponential moving averages with the lenghts 50, 100, 150, 200, 20, 40 by default and checks the trend. you can change the lengths as you wish
- It also creates ZigZag using the ZigZag Period in the options.
- Using last 2 zigzag waves it checks if there is suitable ABC pattern according the Trend, the Min/Max Fibonacci levels and Error Rate
- Then it check if the price bounces after this ABC pattern
- And if all these conditions met then it plot triangle
- If there are multiple bouncing then you can see multiple triangles
You can change/set;
- Zigzag Period
- Fibonacci Max level
- Fibonacci Min Level
- Error Rate
- The Lengths that are used for Moving Averages
- Keeping old ABC lines/labels
- Show Zigzag and min/max Fibonacci levels
- Show Trend Cloud
- and colors
if you don't want to see old ABC lines/labels you can disable it:
if you don't want to see Trend Cloud you can disable it:
Zigzag and Fibonacci levels:
P.S. if you have new ideas to improve this indicator then let me know please. We together can do this life easier!
Enjoy!