ABCD Harmonic Pattern Strategy (Bull + Bear) This script is a strategy implementation of the classic ABCD Harmonic Pattern, designed for market structure analysis, backtesting, and educational research.
The ABCD pattern is one of the foundational harmonic price patterns in technical analysis. Its Fibonacci ratio relationships were formalized and standardized within harmonic trading theory by Scott M. Carney, whose work helped define modern harmonic pattern rules.
This strategy is conceptually inspired by educational ABCD pattern logic shared by the TradingView author theEccentricTrader.
The code, structure, execution logic, filters, and risk management have been independently developed, reconstructed, and extended into a complete TradingView strategy.
What this strategy does
Detects bullish and bearish ABCD harmonic patterns based on price structure and Fibonacci ratios.
Reconstructs ABCD market structure logic for both directions instead of using a simple visual inversion.
Draws the ABCD legs, structure labels (A, B, C, D), and projection levels directly on the chart.
Generates long and short trade entries using confirmed ABCD structures.
Includes optional confluence filters, such as:
Higher-timeframe EMA trend filter
RSI strength filter
ATR volatility filter
Volume confirmation
Candle body confirmation
Minimum bounce distance from point D
Provides built-in risk management, including:
Configurable Stop Loss
Configurable Take Profit
Optional trailing stop
Designed for backtesting, parameter optimization, and analytical research.
Why this strategy is different
This script is not a simple indicator conversion nor a basic bullish/bearish mirror.
The ABCD pattern logic has been recreated at the structural level to better reflect how bullish and bearish market formations behave in real price action.
Key differences
Reconstructed bullish and bearish structures
Bullish and bearish ABCD patterns are independently defined using market structure logic, not just inverted visually.
Each direction has its own pivot relationships and validation rules to produce a more faithful representation of the ABCD pattern.
Structure-aware pattern validation
Pattern confirmation is based on price swings, structure continuity, and Fibonacci alignment, helping reduce distorted or forced patterns.
Strategy-based execution
Unlike indicator-only ABCD tools that only visualize patterns, this script uses strategy.entry and strategy.exit, enabling full backtesting and performance analysis.
Confluence-driven entries
Trade entries can require multiple confirmation layers beyond the pattern itself, helping reduce low-quality signals and overtrading.
Integrated risk management
Stop Loss, Take Profit, and optional trailing logic are applied consistently for both long and short positions.
Non-repainting design
Pattern detection and entries rely on confirmed bars (barstate.isconfirmed) and higher-timeframe data with lookahead_off, ensuring signals do not repaint historically.
Improved and controlled visualization
Pattern drawings, projections, and entry markers are managed with strict object limits to comply with TradingView performance and publishing requirements.
How to use
Add the strategy to a chart and select a symbol and timeframe.
Enable or disable filters under “Entry Filters (Confluence)”.
Configure Stop Loss, Take Profit, and trailing behavior under “TP/SL”.
Use pattern drawings and entry markers as visual and analytical confirmation, not as standalone trade signals.
Important notes
This script is provided for educational and research purposes only.
It does not provide financial or investment advice.
No profitability or performance is implied or guaranteed.
Past performance does not indicate future results.
Always test across multiple markets and timeframes and apply proper risk management.
Credits
ABCD Harmonic Pattern: Harmonic trading principles as formalized by Scott M. Carney.
Conceptual inspiration: Educational ABCD pattern logic shared by @theEccentricTrader on TradingView.
Pattern reconstruction, strategy logic, and risk management: Independent development.
Abcde

BEST ABCD Pattern ScreenerHello ladies and gentlemen traders
Continuing deeper and stronger with the screeners' educational series one more time.
This one is heavy crazy mega cool (pardon my french).
I - Concept
I present to you, ladies and gentlemen, the first screener for harmonic patterns.
Starting with an ACBD pattern screener this time!!
I used the calculations from Ricardo Santo's script
In short, he's using fractals (regular or Bill Williams ) for the pattern calculations. A masterpiece !!!
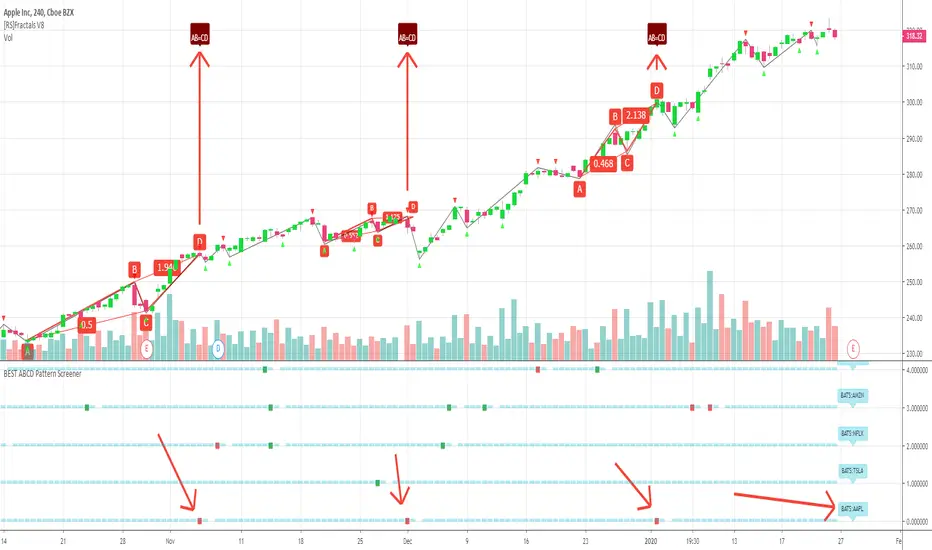
The screener will show in 1 consolidated chart the ABCD patterns for 5 selected assets. Could be stocks, forex, crypto, whatever you feel like making money with
II - Definitions
The ABCD pattern ( AB=CD ) is one of the classic chart patterns which is repeated over and over again.
The ABCD pattern shows perfect harmony between price and time.
More info here
The Williams Fractal is an indicator, developed by Bill Williams, that aims to detect reversal points (highs and lows) and marks them with arrows.
Up fractals and down fractals have specific shapes. The Williams Fractal indicator helps users determine in which direction price will develop
Source: www.tradingview.com
III - How did I set the screener
The visual signals are as follow:
- square: whenever there is an ABCD pattern detected
Then the colors are:
- green when a bullish pattern is detected
- red when a bearish pattern is detected
🔸 The script screenshot shows two red squares matching two ABCD bearish pattern from the above panel. As the chart is showing APPL, I highlighted where the screener mentioned the fruit stock ( APPLE, pun, bad joke, Dave out...)
🔸 I tried to make it as clear as I could with red arrows
Once again, we pushed together the limits of pine script beyond of what we thought was possible, beyond the realm of this world, reaching finally the dreamt pine script heaven (am I going too far? feel free to tell me)
Best regards,
Dave