Continuous Accumulation Strategy [DCA] v9🇬🇧 English: Continuous Accumulation Strategy v9.4
This script is a full-featured strategy designed to backtest the "Buy the Dip" or "Dollar Cost Averaging" (DCA) philosophy. Its core feature is the Dynamic Peak Detection logic, which solves the "lock-in" problem of previous versions. Instead of getting stuck on an old high, the strategy constantly adapts to the market by referencing the most recent peak.
Key Features
* Dynamic Peak Detection: You define the "Peak Lookback Period." For example, on a Daily chart, setting it to `5` references the peak of the last business week.
* Stable Order Management: The strategy consistently uses a fixed cash amount (e.g., $100) for each entry, which prevents any runtime errors related to negative equity.
* Publishing-Ready: To meet TradingView's requirement for a backtest report, this strategy executes a symbolic, one-time "dummy trade" (one buy and one sell) at the very beginning of the test period. This first trade should be ignored when analyzing performance , as its only purpose is to enable publication.
How It Works
The main logic follows an adaptive cycle: Find Dynamic Peak -> Wait for a Drop -> Buy on Crossover -> Repeat.
1. Finds the Dynamic Peak: On every bar, it identifies the highest price within your defined lookback period.
2. Calculates the Drop: It constantly calculates the percentage drop from this moving peak.
3. Executes an Entry: The moment the price crosses below a target drop percentage, it executes a buy order.
4. Continuously Adapts: As the price moves, the dynamic peak is constantly updated, meaning the strategy never gets locked and is always ready for the next opportunity.
How to Use This Strategy
* Focus on the Strategy Tester: After adding it to the chart, analyze the Equity Curve, Net Profit, and Max Drawdown to see how this accumulation philosophy would have performed on your favorite asset.
* Optimize Parameters: Adjust the "Peak Lookback Period" and "Drop Percentages" to fit the volatility of the asset you are testing.
This is a tool for testing and analyzing a "buy and accumulate" philosophy. Its main logic does not generate sell signals.
累積/派發線(ADL)

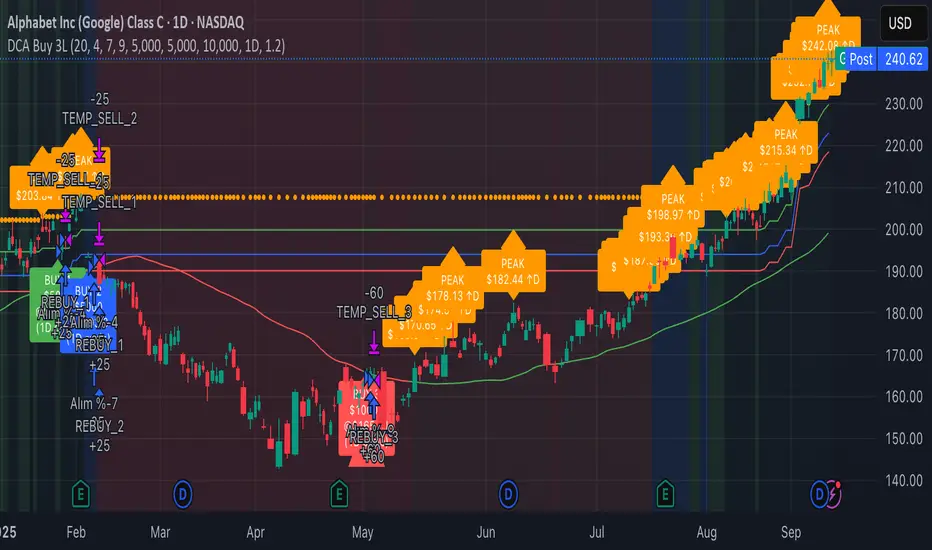
3-Level DCA Buy Strategy🎯 3-Level DCA Buy Strategy - Smart Dollar Cost Averaging
Professional DCA strategy that systematically accumulates positions during market dips. Enhanced with daily trend analysis for intelligent accumulation.
🚀 Key Features
- 3-Level Buying System: Automatic purchases at 5%, 10%, 15% drops from cycle highs
- Daily Trend Analysis: 1-day timeframe trend confirmation
- Smart Peak Detection: 100-period lookback for meaningful peaks
- Volume Filter: Optional volume confirmation system
- USD-Based Positions: Fixed dollar amounts per level
- Never Sells: Pure accumulation philosophy (buy-only)
📊 How It Works
1. Peak Identification: Detects highest price in last 100 periods
2. Daily Trend Check: Confirms price above 50 SMA on 1D timeframe
3. Drop Tracking: Calculates percentage drops from cycle high
4. Systematic Buying: Executes predetermined amounts at each level
5. Cycle Reset: Renews buy permissions when new peaks form
⚙️ Default Settings
- Buy Levels: 5%, 10%, 15% drops
- Position Sizes: $100, $150, $200
- Peak Period: 100 bars
- Higher Timeframe: 1 Day (1D)
- Pyramiding: 500 order capacity
🎨 Visual Elements
- Orange Circles: Mark cycle highs
- Colored Lines: Green/Blue/Red buy levels
- Triangle Signals: Buy point indicators
- Live Panel: Real-time statistics
- Background Colors: Trend and drop level indicators
🔔 Alert System
- Instant notifications for each buy level
- New peak detection alerts
- Major drop warnings (>20%)
- Daily trend change notifications
💡 Ideal Use Cases
- Crypto Accumulation: Bitcoin, Ethereum and major altcoins
- Stock DCA: Long-term portfolio building
- Volatile Markets: Capitalizing on price fluctuations
- Emotional Trading Prevention: Automated and disciplined buying
📈 Strategy Logic
This strategy follows the "buy the dip" philosophy. It waits during market rises and systematically builds positions during declines. Only buys when daily trend is bullish, providing protection during major bear markets.
⚠️ Important Notes
- Buy-only strategy - never sells positions
- Requires sufficient capital for multiple entries
- Most effective in trending and volatile markets
- Always backtest before live trading
- Risk management is your responsibility
🛠️ Customization Options
All parameters are fully customizable: drop percentages, position amounts, timeframes, visual elements and more. Suitable for both beginner and experienced investors.
🎯 Publishing Feature
Note: Strategy includes temporary 1-day sell cycle for TradingView publishing requirements. This feature can be disabled for normal DCA mode operation.
⭐ If you find this strategy helpful, please like and follow! Visit the profile for more trading tools.
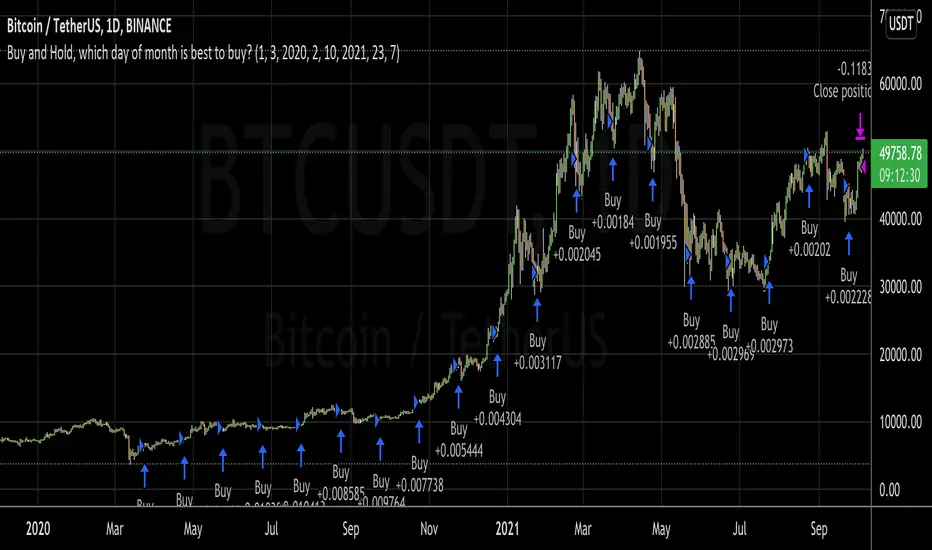
Buy and Hold, which day of month is best to buy?I wanted to invest a certain fiat amount each month and was wondering which day would be best to do this.
So, with this script, you can set your entry day. On the last day of the date range, it will close all positions. You can then see what amount of the asset you have accumulated to date. If you try all the days of the month and see when you can sell the most amount of the asset, you've found the best buy date of the month for that asset.
A second option is to set an exit day. This is good for a strategy where you would go long (buy) on the entry date and short (sell) on the exit day.
This was inspired by people running out of money by the end of the month and selling their asset, which could make the price fall. Then when they receive the wages by the 5th or so, they would rebuy, causing the price to go up.
OBV Accumulation / Distribution Strategy CryptoThis version its made for 8-12h and works amazingly on the ETH pairs. Can be adapted to others as well
For this example, I used an initial 1$ account, using always full capital on each trade(without using any leverage), together with a 0.1% commission/fees for each deal, on Coinbase broker.
This is a long only strategy
The components for the inside of the strategy are the next one :
1. OBV Accumulation/Distribution
3. EMA
The rules here are simple : we check for cross up or above on OBV and EMAmoving average and after that we check for the trend direction based on ascending/descending OBV. Based on this we enter long or exit long.
RISK WARNING
Trading on any financial market involves a risk of loss. Please consider carefully if such trading is appropriate for you. Past performance is not indicative of future results.
If you have any questions or you are interested in trying it, private message me and I will give you as soon as I see the message a trial for it.
