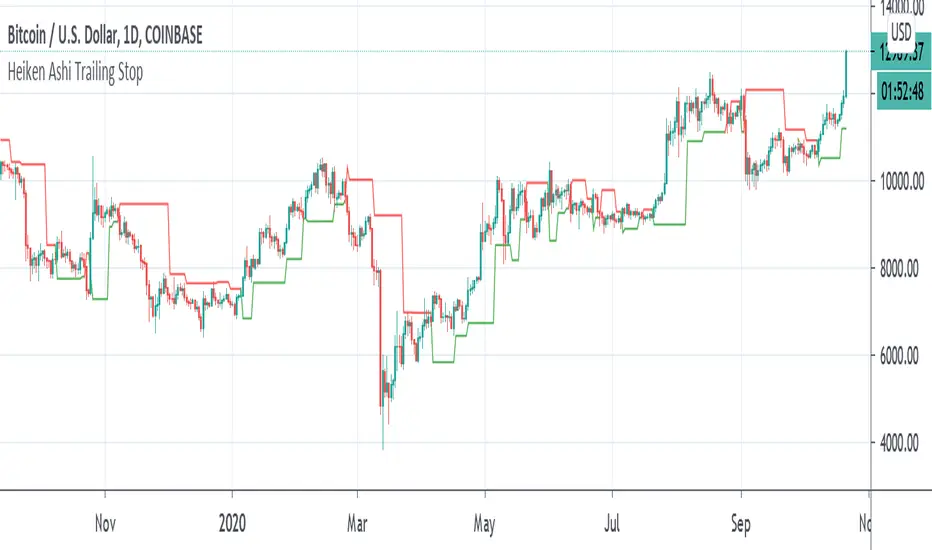
Heiken Ashi Pivot Breakout Trailing StopThis is a heiken ashi pivot based trailing stop for breakout entries and exits. It's possibly related to the Swing Index System by Welles Wilder or an alternative to it that I came up with, in case determining the swings on the Accumulative Swing Index is too much of a burden. It is believed that the ASI uses the calculation of heiken ashi in its formula. This does not use the ASI as a bottom indicator in the chart but instead uses the heiken ashi bars on the top of the chart to objectively find the swing pivots . These swings pivots act as support and resistance and can be used to confirm the start of a breakout or the end of one.
Suppose you find a chart pattern or setup, such as divergence or a pennant in the RSI , a pattern on the ASI, and/or on the chart, or the end of an elliot wave , etc and want to confirm a strong breakout and ride it to the end. Many trailing stops won't be able to confirm the beginning or would last too long or not long enough to exit out of one. On an uptrend, when the price breaks below the last swing low pivot , it can confirm the end of the breakout. On a downtrend, when the price breaks above the last swing high pivot , it can confirm the end of the breakout.
This trailing stop is not meant to replace trend following ones. The swing pivots can vary yet the price can still continue at an uptrend whereas this heiken ashi pivot based trailing stop exits as soon as it goes above or below the last resistance point. These swing points can end up being too close for trend following but can work well for breakout trading. The bigger the chart pattern or breakout, the more reliable the exit signal will be in my opinion. This is an experimental idea that I came up with from trying to interpret the ASI.
加速擺動指標(ASI)
Swing Index System - Heiken Ashi Pivot Breakout StrategyFor Educational Purposes. Results can differ on different markets and can fail at any time. Profit is not guaranteed.
This only works in a few markets and in certain situations. Changing the settings can give better or worse results for other markets. This is a breakout strategy that uses the heiken ashi bars to find the support and resistance levels or the swing pivots to try to objectively find a breakout. When the price breaks out of a swing pivot, breakout can be confirmed and a strategy can be made. The trade exits as soon as in profit when the heiken ashi bar changes color, when the price swings start to slow down, or when the price breaks below a swing pivot. There might be many strategies and possible ideas that can be made just from knowing where the swing pivots are alone. For this one, I decided to try to emulate Wilder's Adam Theory approach by entering only a specific criteria when it makes new highs or lows that I experimented with. The Swing Index System seems to be similar to what he describes in his book (or perhaps it is the same thing).
Some say that price is the ultimate indicator, but not many really know what that really means. This is yet another approach to try to interpret what that means. This strategy only contains a piece of the complete breakout and trend strategy approach of the Adam Theory and won't be profitable in every market under every situation. This does not include price patterns that the Swing Index System is said to be able to find such as chart patterns, wedges, tops/bottoms, etc. This only includes the small breakout portion requirement in the book. I included specific entry and exit criteria to make the strategy work well that involves nothing but the price action of the swing points only due to the lack of the other missing pieces. It does not contain the missing pieces. Despite this, it can still help find where breakouts might be in an objective matter using the Swing Index System as a standalone trading system and it doesn't involve lookbacks or anything but price alone.
