VWAP-Anchored MACD [BOSWaves]VWAP-Anchored MACD - Volume-Weighted Momentum Mapping With Zero-Line Filtering
Overview
The VWAP-Anchored MACD delivers a refined momentum model built on volume-weighted price rather than raw closes, giving you a more grounded view of trend strength during sessions, weeks, or months.
Instead of tracking two EMAs of price like a standard MACD, this tool reconstructs the MACD engine using anchored VWAP as the core input. The result is a momentum structure that reacts to real liquidity flow, filters out weak crossovers near the zero line, and visualizes acceleration shifts with clear, high-contrast gradients.
This indicator acts as a precise momentum map that adapts in real time. You see how weighted price is accelerating, where valid crossovers form, and when trend conviction is strong enough to justify execution.
It uses gradient line coloring to show bullish or bearish momentum, histogram shading to highlight energy shifts, cross dots to mark valid crossovers, optional buy/sell diamonds for execution cues, and candle coloring to display trend strength at a glance.
Theoretical Foundation
Traditional MACD compares the difference between two exponential moving averages of price.
This variant replaces price with anchored VWAP, making the calculation sensitive to actual traded volume across your chosen period (Session, Week, or Month).
Three principles drive the logic:
Anchored VWAP Momentum : Price is weighted by volume and aggregated across the selected anchor. The fast and slow VWAP-EMAs then expose how liquidity-corrected momentum is expanding or contracting.
Zero-Line Distance Filtering : Crossover signals that occur too close to the zero line are removed. This eliminates the common MACD problem of generating weak, directionless signals in choppy phases.
Directional Visualization : MACD line, signal line, histogram, candle colors, and optional diamond markers all react to shifts in VWAP-momentum, giving you a clean structural read on market pressure.
Anchoring VWAP to session, weekly, or monthly resets creates a systematic framework for tracking how capital flow is driving momentum throughout each trading cycle.
How It Works
The core engine processes momentum through several mapped layers:
VWAP Aggregation : Price × volume is accumulated until the anchor resets. This creates a continuous, liquidity-corrected VWAP curve.
MACD Construction : Fast and slow VWAP-EMAs define the MACD line, while a smoothed signal line identifies edges where momentum shifts.
Zero-Line Distance Filter : MACD and signal must both exceed a threshold distance from zero for a crossover to count as valid. This prevents fake crossovers during compression.
Visual Momentum Layers : It uses gradient line coloring to show bullish or bearish momentum, histogram shading to highlight energy shifts, cross dots to mark valid crossovers, optional buy/sell diamonds for execution cues, and candle coloring to display trend strength at a glance.
This layered structure ensures you always know whether momentum is strengthening, fading, or transitioning.
Interpretation
You get a clean, structural understanding of VWAP-based momentum:
Bullish Phases : MACD > Signal, histogram expands, candles turn bullish, and crossovers occur above the threshold.
Bearish Phases : MACD < Signal, histogram drives lower, candles shift bearish, and downward crossovers trigger below the threshold.
Neutral/Compression : Both lines remain near the zero boundary, histogram flattens, and signals are suppressed to avoid noise.
This creates a more disciplined version of MACD momentum reading - less noise, more conviction, and better alignment with liquidity.
Strategy Integration
Trend Continuation : Use VWAP-MACD crossovers that occur far from the zero line as higher-conviction entries.
Zero-Line Rejection : Watch for histogram contractions near zero to anticipate flattening momentum and potential reversal setups.
Session/Week/Month Anchors : Session anchor works best for intraday flows. Weekly or monthly anchor structures create cleaner macro momentum reads for swing trading.
Signal-Only Execution : Optional buy/sell diamonds give you direct points to trigger trades without overanalyzing the chart.
This indicator slots cleanly into any momentum-following system and offers higher signal quality than classic MACD variants due to the volume-weighted core.
Technical Implementation Details
VWAP Reset Logic : Session (D), Week (W), or Month (M)
Dynamic Fast/Slow VWAP EMAs : Fully configurable lengths, smoothing and anchor settings
MACD/Signal Line Framework : Traditional structure with volume-anchored input
Zero-Line Filtering : Adjustable threshold for structural confirmation
Dual Visualization Layers : MACD body + histogram + crosses + candle coloring
Optimized Performance : Lightweight, fast rendering across all timeframes
Optimal Application Parameters
Timeframes:
1- 15 min : Short-term momentum scalping and rapid trend shifts
30- 240 min : Balanced momentum mapping with clear structural filtering
Daily : Macro VWAP regime identification
Suggested Configuration:
Fast Length : 12
Slow Length : 26
Signal Length : 9
Zero Threshold : 200 - 500 depending on asset range
These suggested parameters should be used as a baseline; their effectiveness depends on the asset volatility, liquidity, and preferred entry frequency, so fine-tuning is expected for optimal performance.
Performance Characteristics
High Effectiveness:
Assets with strong intraday or session-based volume cycles
Markets where volume-weighted momentum leads price swings
Trend environments with strong acceleration
Reduced Effectiveness:
Ultra-choppy markets hugging the VWAP axis
Sessions with abnormally low volume
Ranges where MACD naturally compresses
Disclaimer
The VWAP-Anchored MACD is a structural momentum tool designed to enhance directional clarity - not a guaranteed predictor. Performance depends on market regime, volatility, and disciplined execution. Use it alongside broader trend, volume, and structural analysis for optimal results.
Adaptivemacd

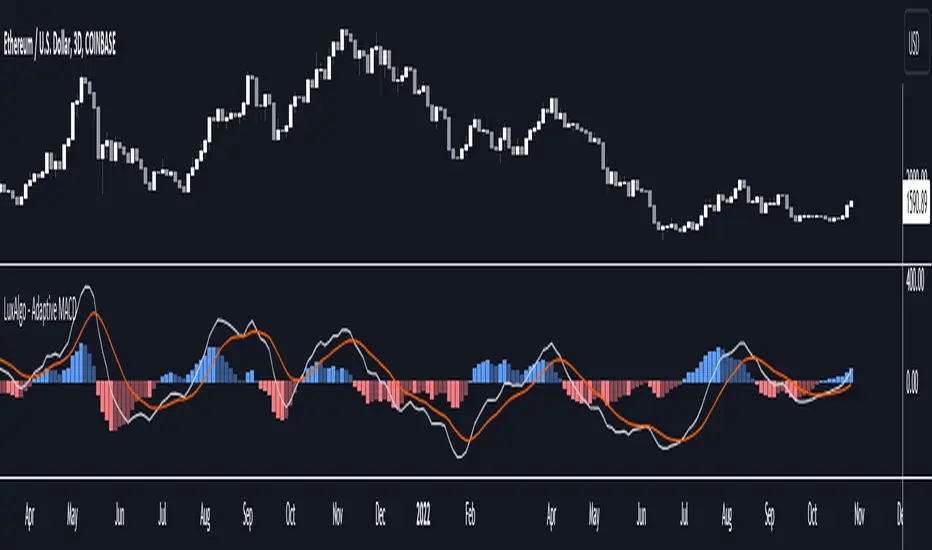
Adaptive MACD [LuxAlgo]The Adaptive MACD indicator is an adaptive version of the popular Moving Average Convergence Divergence (MACD) oscillator, returning longer-term variations during trending markets and cyclic variations during ranging markets while filtering out noisy variations.
🔶 USAGE
The proposed oscillator contains all the elements within a regular MACD, such as a signal line and histogram. A MACD value above 0 would indicate up-trending variations, while a value under 0 would be indicating down-trending variations.
Just like most oscillators, our proposed Adaptive MACD is able to return divergences with the price.
As we can see in the image above ranging markets will make the Adaptive MACD more conservative toward more cyclical conservations, filtering out both noise and longer-term variations. However, when longer-term variations (such as in a trending market) are prominent the oscillator will conserve longer-term variations.
The R2 Period setting determines when trending/ranging markets are detected, with higher values returning indications for longer intervals.
The fast and slow settings will act similarly to the regular MACD, however, closer values will return more cyclical outputs.
The image above compares our proposed MACD (top) with a regular MACD (bottom), both using fast = 19 and slow = 20 .
🔶 DETAILS
It is common to be solely interested in the trend component when the market is trending, however, during a ranging market it is more common to observe a more prominent cyclical/noise component. We want to be able to preserve one of the components at the appropriate market conditions, however, the regular MACD lack the ability to preserve cyclical component with high accuracy.
The MACD is an IIR bandpass filter. In order to obtain a lower passband bandwidth and a more symmetrical magnitude response (which would allow to conserve more precise cyclical variations) we can directly change the system calculation:
y = (price - price ) × g + ((1 - a1) + (1 - a2)) × y - (1 - a1) × (1 - a2) × y
where:
a1 = 2/(fast + 1)
a2 = 2/(slow + 1)
g = a1 - a2
Using division instead of multiplication on the second feedback weight allows further weighting the 2 samples lagged output, returning a more desirable magnitude response with a higher degree of filtering on both ends of the spectrum as shown in the image below:
We are interested in conserving cycles during ranging markets, and longer-term variations during trending markets, we can do this by interpolating between our two filter coefficients:
α × + (1 - α) ×
where 1 > α > 0 . α is measuring if the market is trending or ranging, with values closer to 1 indicating a trending market. We see that for higher values of α the original coefficient of the MACD is used. The image below shows various magnitude responses given multiple values of α :
We use a rolling R-Squared as α , this measurement has the benefit of indicating if the market is trending or ranging, as well as being constrained within range (0, 1), and having a U-shaped distribution.
If you are interested to learn more about the MACD see:
🔶 SETTINGS
R2 Period: Calculation window of the R-Squared.
Fast: Fast period for the calculation of the Adaptive MACD, lower values will return more noisy results.
Slow: Slow period for the calculation of the Adaptive MACD, higher values will return result with longer-term conserved variations.
Signal: Period of the EMA applied to the Adaptive MACD.
MACD Pro Suite (Zeiierman)█ Overview
MACD Pro Suite (Zeiierman) redefines the classical MACD by transforming it into an adaptive market-behavior engine, instead of relying on a static fast–slow EMA configuration, the suite channels price through an efficiency matrix, a momentum acceleration core, and a multi-regime normalization layer. The result is a MACD architecture capable of shifting seamlessly between a volatility-conditioned oscillator, a probabilistic compression model, or a smooth, distribution-aware trend profiler, all emerging from the same underlying structure.
The MACD Pro Suite extends far beyond traditional MACD behavior by interpreting market structure in real time and adapting its responses to shifting conditions. It can detect subtle momentum transitions, quantify trend stability, reveal hidden inefficiencies in price movement, and highlight early regime shifts that standard oscillators completely overlook. Its dynamic normalization engine ensures consistency across different market environments, allowing the signal to remain clear during high volatility, low volatility, compression phases, expansions, and trend accelerations.
The system is designed to identify high-quality momentum turns, confirm trend continuity, and expose weakening market pressure before it becomes visible in price. It also reveals imbalances, impulses, and structural breaks with a level of precision that makes it valuable for discretionary traders seeking refined context and for systematic traders building rule-based models.
A built-in dashboard consolidates these behavioral states into an intuitive visual panel, making it easy to read market conditions at a glance and convert complex internal analysis into actionable insight.
⚪ Why This One Is Unique
MACD Pro Suite runs on a Hybrid Efficiency–Momentum engine that reshapes how the MACD responds to trend quality, noise, and impulse strength. This engine can operate in three distinct modes, letting the indicator shift between efficiency-driven behavior, momentum-driven behavior, or a balanced hybrid.
A multi-regime normalization system transforms the MACD into a stable, adaptive signal. It can operate as a volatility-balanced measure, a probability-styled compression model, a distribution-aware signal, or an ultra-smooth structural trend reader, all from the same core data. A real-time acceleration mechanism continuously adjusts the internal smoothing weights based on momentum intensity, giving the engine dynamic responsiveness as market conditions evolve.
Additional layers enhance this behavioral core:
Divergence mapping
Price inefficiency detection
Impulse markers
Adaptive exit structures
Significant move gradient zones
A multi-timeframe dashboard for immediate state awareness
█ Main Features
⚪ Efficiency Sources
Each efficiency source delivers a different style of structural interpretation, letting the MACD engine emphasize trend, pressure, or cyclical rotation depending on the chosen configuration and market environment.
Hybrid Efficiency–Momentum Core
In this mode, the MACD engine blends an efficiency-weighted price stream with momentum-based acceleration. The indicator adapts simultaneously to trend cleanliness, directional strength, and impulse intensity, giving it a balanced and highly reactive behavior profile.
Enhanced Momentum Core
Here, the engine uses raw price as the base input but applies a dynamic acceleration mechanism that adjusts internal EMA responsiveness in real time. The MACD becomes more reactive during strong momentum phases and more controlled during choppy, low-quality movement.
Efficiency Core
This framework routes the input through an efficiency pipeline where price, directional strength, or cyclic momentum is transformed into a cumulative efficiency path before MACD is calculated. It emphasizes structural clarity by suppressing noise and amplifying meaningful movement within the market.
⚪ MACD Shaping & Normalization Framework
Volatility Balanced Modes
These modes transform the MACD into a volatility-adjusted signal that automatically adapts to changing market conditions. The result is a cleaner and more stable read that adjusts naturally to expanding and contracting volatility while still preserving clear directional intent.
Tight Compression Modes
These shaping options re-scale MACD into compact 0 to 1 style ranges that are re-centered into a clean negative one to positive one structure. They produce a tightly controlled oscillator that highlights relative movement rather than raw amplitude.
Position Centered Modes
Here, the MACD is normalized using distribution-based scaling, allowing it to understand where it sits within its own movement range. This makes shifts in pressure and momentum easier to read and highlights when the indicator is moving into unusually strong or weak conditions.
Distribution Aware
These modes apply distribution-based transforms and robust statistical scaling. They stabilize MACD during irregular or skewed market conditions while preserving high-quality turning points
Volatility Filtered and Ultra Smooth Modes
These variants use multi-component volatility estimates and smoothed normalization to produce an exceptionally smooth MACD line. They maintain structure and trend behavior while filtering out low-value noise.
Robust Volatility Filtered
Ultra-Smooth Volatility Filter
⚪ Significant MACD Move
The Significant MACD module identifies when the MACD line enters a meaningful high-importance zone by evaluating its recent amplitude and confirming that momentum has held inside a defined activity region. Once active, a thicker overlay highlights periods where MACD is operating within this significant regime, while neutral phases use a base color for clear visual separation.
These highlights show when MACD is pressing into one of its internal pressure zones, helping you distinguish between ordinary momentum rotation and moments when the underlying push becomes strong enough to deserve attention. It is especially useful for spotting expansion phases, confirming breakouts, or identifying trend legs with real follow-through potential.
⚪ Signals
The suite includes directional signals that track meaningful shifts in market pressure and help highlight emerging turns or continuation strength, offering clear guidance when the market begins to turn or strengthen.
⚪ Divergences
When enabled, the suite automatically scans for regular bullish and bearish divergence between MACD and price. It identifies and marks structural pivot points where momentum and price begin to disagree. Because the MACD engine is built on efficiency and momentum rather than raw price alone, it can surface uncommon or non-traditional divergence structures that do not appear on standard indicators, often with noticeably higher accuracy.
Regular Bullish Divergence
MACD forms a higher low while price sets a lower low, signaling potential upward rotation.
Regular Bearish Divergence
MACD forms a lower high while price sets a higher high, indicating possible weakening momentum.
⚪ Price Inefficiency
The Price Inefficiency engine evaluates how balanced or imbalanced market movement is by analyzing a composite stream built from price, normalized MACD, normalized Signal, and smoothed structure. It measures how efficiently the market is progressing and identifies when movement becomes unstable, irregular, or out of sync with its underlying trend profile.
Blue diamonds plotted along the MACD zero line highlight periods where inefficiency is detected. This layer exposes subtle structural imbalances that often precede volatility bursts, failed moves, or regime transitions, giving traders early insight into when the market is behaving cleanly and when it is slipping into disorder.
⚪ Impulse Markers
The Impulse module identifies statistically extreme expansions in a smoothed, price-derived momentum stream. It highlights moments when momentum surges beyond normal behavior, marking them as either positive or negative impulses.
⚪ Visual Multi-Timeframe Dashboard
Along the right edge of the pane, a compact dashboard summarizes the MACD environment across 5M, 15M, 1H, 2H, 4H, and 1D. Each column reflects a key behavioral element derived from the MACD Pro Suite:
MACD Value – raw MACD pressure showing strength, weakness, or extreme displacement
MACD Signals – directional bias such as Long, Short, or neutral transitions
Histogram Signals – bull/bear momentum pulses extracted from the histogram structure
Divergence – bullish or bearish conflicts between MACD behavior and price movement
Inefficiency – imbalance zones where price behaves unstably or inefficiently
Impulse Moves – active bullish or bearish momentum bursts detected in real time
Think of it as a “MACD climate map.” Instead of flipping through multiple charts, you get an instant visual read on whether lower timeframes support the higher-timeframe environment or move against it. This makes multi-timeframe alignment straightforward and helps you decide when conditions favor aggressiveness, patience, or stepping aside entirely.
█ How to Use
The MACD Pro Suite is built to be exceptionally flexible. Because its core engine adapts to trend quality, volatility conditions, structural efficiency, and momentum strength, it can be shaped into almost any style of MACD behavior you need. From smooth trend-profiling to tight compression signals, from volatility-balanced structure to aggressive momentum tracking, the suite can be tuned to match your strategy, timeframe, and market environment.
Rather than forcing you into one interpretation of MACD, the framework gives you a set of behavioral modes that respond intelligently to changing conditions. It can act as a trend tool, a reversal detector, a structure mapper, or a regime classifier depending on how you configure it. This agility is what makes the suite useful for discretionary traders and system builders alike.
⚪ Classic MACD Trading
In its traditional form, MACD is used to track shifts in momentum and trend direction. The MACD line crossing above the Signal line often signals upward pressure, while crossing below suggests momentum is weakening or rotating downward. The histogram shows the distance between the two, making acceleration or deceleration easy to see at a glance.
These same interpretations apply directly within the MACD Pro Suite. Even with its advanced engines and normalization layers, the MACD and Signal lines still behave intuitively: crossovers mark directional shifts, zero-line transitions indicate broader trend bias, and histogram contractions or expansions reveal early momentum changes. This means you can trade it just like a classic MACD while benefiting from a far more adaptive and stable internal engine.
⚪ Fading Momentum Trading
MACD helps you spot fading momentum by watching the MACD line lose its slope and drift back toward the signal line. When the line stops accelerating and starts flattening, it’s a clear sign the trend is running out of strength. You also see fading momentum when both lines start moving back toward the midline, showing the impulse behind the trend is weakening even if the price hasn’t reversed yet.
Fading Momentum + Signals
If you spot fading momentum together with one of our Signals, it becomes a much stronger confirmation that the move is losing strength. When MACD momentum fades at the same time a Signal fires, the probability of a pullback or reversal increases significantly.
Fading Momentum + Divergences
The same applies when fading momentum aligns with divergences. If price makes a new high or low but the MACD line or histogram makes a weaker high/low, the divergence confirms that momentum is not supporting the move. Combined with fading MACD momentum, this is one of the strongest early warnings of an upcoming reversal.
⚪ Volatility and Breakout Trading
Volatility and breakout trading focus on how the market expands and contracts rather than on direction alone, and MACD Pro reacts beautifully to these shifts. When volatility increases, the MACD line tends to widen, steepen, or oscillate more aggressively. This makes it easier to see when the market is entering a high-energy phase that can lead to sharp breakouts or fast directional moves. As volatility cools, the MACD Pro begins to tighten and compress, with both the line and histogram pulling back toward equilibrium. This compression signals a contraction phase, often the calm before the next expansion.
You can spot volatility expansion when the MACD line or histogram behaves noticeably differently from recent behavior, such as sudden widening, rapid swings, or strong impulse signatures. These changes often highlight a volatility burst building beneath the surface. When that burst fades and the MACD compresses again, the market is usually preparing for a decisive move.
Settings used for Volatility and Breakout Trading:
Example Setting 1
MACD Moving average type: WMA
MACD Shaping: Raw MACD Behaviour
Momentum Multiplier: 6
Example Settings 2
MACD Shaping: Robust Volatility Filter
Momentum Multiplier: Increase toward 5
Example Setting 3
MACD Shaping: Distribution Balanced
Increase Momentum Multiplier: to exaggerate volatility bursts
Increase Efficiency Length: to filter minor fluctuations
⚪ Overbought / Oversold Trading
Overbought and oversold trading focuses on identifying when the price has stretched too far and is likely to rotate back toward balance. With the right shaping, the MACD can behave more like a bounded oscillator, making it easier to spot exhaustion on both sides of the range. When using tighter shaping or position-weighted behavior, the MACD becomes more responsive to market extremes while suppressing noise.
You can interpret overbought conditions when the MACD begins pressing into the upper region of its shaping range, showing that bullish momentum is becoming stretched. When it leans into the lower region, it signals oversold conditions and weakening bearish pressure. These zones help highlight exhaustion points, mean-reversion opportunities, and areas where a reversal or rotation is becoming increasingly likely.
Example settings:
MACD Shaping: Volatility Balanced
MACD Shaping: Tight 0–1 Band
MACD Shaping: Position Weighted
█ How It Works
⚪ Hybrid Efficiency–Momentum Engine
The core engine blends efficiency analysis with momentum dynamics, creating an adaptive MACD input stream that shifts between efficiency-centric, momentum-driven, or hybrid behavior depending on the selected mode.
Calculation: Builds the MACD input from either an efficiency-weighted cumulative path or a momentum-driven price stream, chosen by the engine mode.
⚪ Adaptive Momentum Response
A real-time responsiveness layer adjusts how quickly MACD reacts based on changes inside its structure. It becomes more responsive during fast-moving phases and naturally smooths itself during slower or noisy conditions.
Calculation: Computes a normalized responsiveness factor from structural deviation and injects it into the smoothing weights of the MACD EMAs.
⚪ Normalization & Behavior Shaping
A multi-regime shaping system re-scales and re-centers MACD using volatility filters, distribution transforms, compression modes, and ultra-smooth normalization to create consistent behavior across assets and volatility regimes.
Calculation: Applies shaping formulas to both MACD and Signal, then re-centers outputs to zero for unified interpretation.
⚪ Directional Signals
A lightweight structural reversal system highlights meaningful directional shifts, assisting with entries, exits, and bias confirmation during momentum transitions.
Calculation: Uses volatility-adjusted logic to detect directional flips and plot Up or Down markers.
⚪ Divergence Layer
The divergence engine detects structural disagreement between MACD and price, often surfacing uncommon divergence patterns thanks to the efficiency–momentum architecture.
Calculation: Identifies MACD pivots, aligns them with price pivots, and validates divergence through comparative structural thresholds.
⚪ Price Inefficiency Engine
This module evaluates imbalance in market structure by merging price behavior with internal MACD signals, highlighting unstable or disordered movement phases.
Calculation: Computes an inefficiency score from a blended composite source and maps imbalance intensity through adaptive thresholds.
⚪ Impulse Module
A momentum-intensity detector reveals statistically significant bursts in directional pressure, marking early expansion phases or exhaustion points.
Calculation: Extracts local extremes from a smoothed momentum field and confirms persistent surges through a cluster-based filter.
⚪ Significant MACD
This layer isolates high-importance momentum zones, making strong structural moves stand out clearly against routine oscillation.
Calculation: Evaluates MACD’s recent amplitude range and confirms when it enters a significant activity region, then applies enhanced visual styling.
-----------------
Disclaimer
The content provided in my scripts, indicators, ideas, algorithms, and systems is for educational and informational purposes only. It does not constitute financial advice, investment recommendations, or a solicitation to buy or sell any financial instruments. I will not accept liability for any loss or damage, including without limitation any loss of profit, which may arise directly or indirectly from the use of or reliance on such information.
All investments involve risk, and the past performance of a security, industry, sector, market, financial product, trading strategy, backtest, or individual's trading does not guarantee future results or returns. Investors are fully responsible for any investment decisions they make. Such decisions should be based solely on an evaluation of their financial circumstances, investment objectives, risk tolerance, and liquidity needs.
