Multi-Data Chart-AnalyticsDynamic Sentiment & Contextual Trend Analysis
Function Description
The Multi-Data Chart-Analytics is a comprehensive market context indicator designed to convert complex technical data into a readable, real-time narrative. Unlike traditional visual-only indicators, this script acts as an on-chart "trading assistant" that evaluates price action, momentum, volatility, and institutional volume simultaneously.
Key Technical Features:
Adaptive Trend Engine: Automatically scales its lookback period based on available historical data (up to 200 periods). This ensures accurate analysis for "young" assets or high timeframes (like BTC on Monthly charts) where standard fixed-length EMAs fail.
Momentum & Feel Tracking: Integrates RSI and DMI (ADX) to determine if the market is overextended (expensive) or undervalued (cheap), and whether the trend has sufficient strength.
Volatility Squeeze Detection: Monitors Bollinger Band width to alert users to "coiling" phases, signaling imminent breakouts.
Institutional Volume Filter: Compares current volume against its 20-period moving average to identify "Smart Money" conviction.
Who is this for?
Discretionary Traders: Who want a quick "second opinion" or sanity check before entering a trade.
Beginners: Who find it difficult to read multiple indicators at once; the terminal translates lines into actionable insights.
Systematic Traders: Who need to maintain awareness of higher-timeframe context without cluttering their main chart window.
How to Use It
Look at the Environment: Start by checking the long-term trend status to ensure you aren't trading against the dominant market force.
Verify Momentum: Check "Market Feel" to avoid buying at exhaustion points (Overbought) or selling at bottoms (Oversold).
Prepare for Breakouts: Keep an eye on the "Volatility" section. If it indicates a "Squeeze," tighten your stops or prepare for a large move.
Confirm with Smart Money: Only trust significant moves if the terminal confirms "Institutional Activity" is present.
Customize: Use the settings menu to adjust the box width, colors, and font size to fit your personal chart layout.
Technical Breakdown (Short Form)
Trend: Adaptive EMA/SMA (max 200).
Momentum: RSI (14) + ADX (14).
Volatility: Bollinger Band Width (20).
Volume: SMA (20) based Volume multiplier.
You might want to use this script in combination with our "Range Indicator Golden Pocket" and "Multi Asset & Multi Timeframe Trend Dashoboard" and the "Risk & Reward Position Planner"
Adaptivetrend

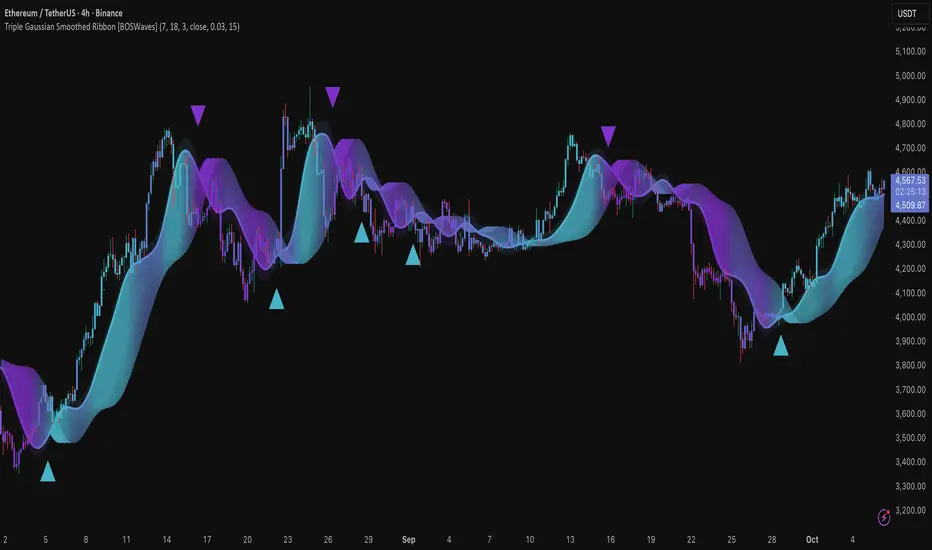
Triple Gaussian Smoothed Ribbon [BOSWaves]Triple Gaussian Smoothed Ribbon – Adaptive Gaussian Framework
Overview
The Triple Gaussian Smoothed Ribbon is a next-generation market visualization framework built on the principles of Gaussian filtering - a mathematical model from digital signal processing designed to remove noise while preserving the integrity of the underlying trend.
Unlike conventional moving averages that suffer from phase lag and overreaction to volatility spikes, Gaussian smoothing produces a symmetrical, low-lag curve that isolates meaningful directional shifts with exceptional clarity.
Developed under the Adaptive Gaussian Framework, this indicator extends the classical Gaussian model into a multi-stage smoothing and visualization system. By layering three progressive Gaussian filters and rendering their interactions as a gradient-based ribbon field, it translates market energy into a coherent, visually structured trend environment. Each ribbon layer represents a progressively smoothed component of price motion, producing a high-fidelity gradient field that evolves in sync with real-time trend strength and momentum.
The result is a uniquely fluid trend and reversal detection system - one that feels organic, adapts seamlessly across timeframes, and reveals hidden transitions in market structure long before traditional indicators confirm them.
Theoretical Foundation
The Gaussian filter, derived from the Gaussian function developed by Carl Friedrich Gauss in 1809, operates on the principle of weighted symmetry, assigning higher importance to central price data while tapering influence toward historical extremes following a bell-curve distribution. This symmetrical design minimizes phase distortion and smooths without introducing lag spikes — a stark contrast to exponential or linear filters that sacrifice temporal accuracy for responsiveness.
By cascading three Gaussian stages in sequence, the indicator creates a multi-frequency decomposition of price action:
The first stage captures immediate trend transitions.
The second absorbs mid-term volatility ripples.
The third stabilizes structural directionality.
The final composite ribbon reflects the market’s dominant frequency - a smoothed yet reactive trend spine - while an independent, heavier Gaussian smoothing serves as a reference layer to gauge whether the primary motion leads or lags relative to broader market structure.
This multi-layered Gaussian framework effectively replicates the behavior of a signal-processing filter bank: isolating meaningful cyclical movements, suppressing random noise, and revealing phase shifts with minimal delay.
How It Works
Triple Gaussian Core
Price data is passed through three successive Gaussian smoothing stages, each refining the trend further and removing higher-frequency distortions.
The result is a fluid, continuously adaptive baseline that responds naturally to directional changes without overshooting or flattening key inflection points.
Adaptive Ribbon Architecture
The indicator visualizes its internal dynamics through a five-layer gradient ribbon. Each layer represents a progressively delayed Gaussian curve, creating a color field that dynamically shifts between bullish and bearish tones.
Expanding ribbons indicate accelerating momentum and trend conviction.
Compressing ribbons reflect consolidation and volatility contraction.
The smooth color gradient provides a real-time depiction of energy buildup or dissipation within the trend, making it visually clear when the market is entering a state of expansion, transition, or exhaustion.
Momentum-Weighted Opacity
Ribbon transparency adjusts according to normalized momentum strength.
As trend force builds, colors intensify and layers become more opaque, signifying conviction.
When momentum wanes, ribbons fade - an early visual cue for potential reversals or pauses in trend continuation.
Candle Gradient Integration
Optional candle coloring ties the chart’s candles to the prevailing Gaussian gradient, allowing traders to view raw price action and smoothed wave dynamics as a unified system.
This integration produces a visually coherent chart environment that communicates directional intent instantly.
Signal Detection Logic
Directional cues emerge when the smoother, broader Gaussian curve crosses the faster-reacting Gaussian line, marking structural inflection points in the filtered trend.
Bullish shifts : short-term momentum transitions upward through the long-term baseline after a localized trough.
Bearish shifts : momentum declines through the baseline following a local peak.
To maintain integrity in choppy markets, the framework applies a trend-strength and separation filter, which blocks weak or overlapping conditions where movement lacks conviction.
Interpretation
The Triple Gaussian Smoothed Ribbon provides a layered, intuitive read on market structure:
Trend Continuation : Expanding ribbons with deep color intensity confirm directional strength.
Reversal Phases : Color gradients flip direction, indicating a phase shift or exhaustion point.
Compression Zones : Tight, pale ribbons reveal equilibrium phases often preceding breakouts.
Momentum Divergence : Fading color intensity despite continued price movement signals weakening conviction.
These transitions mirror the natural ebb and flow of market energy - captured through the Gaussian filter’s ability to represent smooth curvature without distortion.
Strategy Integration
Trend Following
Engage during strong directional expansions. When ribbons widen and color gradients intensify, the trend is accelerating with high confidence.
Reversal Identification
Monitor for full gradient inversion and fading momentum opacity. These conditions often precede transitional phases and early reversals.
Breakout Anticipation
Flat, compressed ribbons signal low volatility and energy buildup. A sudden gradient expansion with renewed opacity confirms breakout initiation.
Multi-Timeframe Alignment
Use higher timeframes to establish directional bias and lower timeframes for entry during compression-to-expansion transitions.
Technical Implementation Details
Triple Gaussian Stack : Sequential smoothing stages produce low-lag, high-purity signals.
Adaptive Ribbon Rendering : Five-layer Gaussian visualization for gradient-based trend depth.
Momentum Normalization : Opacity dynamically tied to trend strength and volatility context.
Consolidation Filter : Suppresses false signals in low-energy or range-bound conditions.
Integrated Candle Mode : Optional color synchronization with underlying gradient flow.
Alert System : Built-in notifications for bullish and bearish transitions.
This structure blends the precision of digital signal processing with the readability of visual market analysis, creating a clean but information-rich framework.
Optimal Application Parameters
Asset Recommendations
Cryptocurrency : Higher smoothing and sigma for stability under volatility.
Forex : Balanced parameters for cycle identification and reduced noise.
Equities : Moderate Gaussian length for responsive yet stable trend reads.
Indices & Futures : Longer smoothing periods for structural confirmation.
Timeframe Recommendations
Scalping (1 - 5m) : Use shorter smoothing for fast reactivity.
Intraday (15m - 1h) : Mid-length Gaussian chain for balance.
Swing (4h - 1D) : Prioritize clarity and opacity-driven trend phases.
Position (Daily - Weekly) : Longer smoothing to capture macro rhythm.
Performance Characteristics
Most Effective In :
Trending markets with recurring volatility cycles.
Transitional phases where early directional confirmation is crucial.
Less Effective In:
Ultra-low volume markets with erratic tick data.
Random, micro-chop conditions with no structural flow.
Integration Guidelines
Pair with volatility or volume expansion tools for enhanced breakout confirmation.
Use ribbon compression to anticipate volatility shifts.
Align entries with gradient expansion in the dominant color direction.
Scale position size relative to opacity strength and ribbon width.
Disclaimer
The Triple Gaussian Smoothed Ribbon – Adaptive Gaussian Framework is designed as a signal visualization and trend interpretation tool, not a standalone trading system. Its accuracy depends on appropriate parameter tuning, contextual confirmation, and disciplined risk management. It should be applied as part of a comprehensive technical or algorithmic trading strategy.
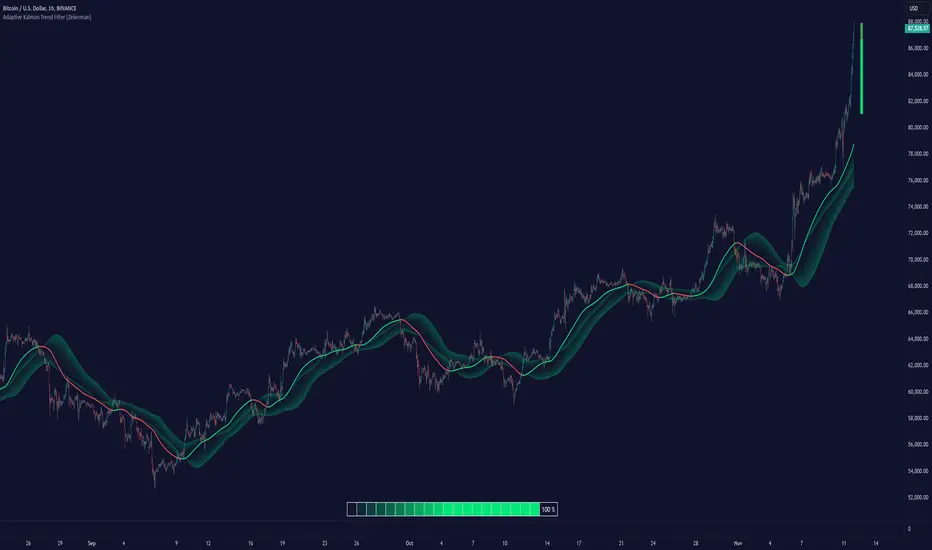
Adaptive Kalman Trend Filter (Zeiierman)█ Overview
The Adaptive Kalman Trend Filter indicator is an advanced trend-following tool designed to help traders accurately identify market trends. Utilizing the Kalman Filter—a statistical algorithm rooted in control theory and signal processing—this indicator adapts to changing market conditions, smoothing price data to filter out noise. By focusing on state vector-based calculations, it dynamically adjusts trend and range measurements, making it an excellent tool for both trend-following and range-based trading strategies. The indicator's adaptive nature is enhanced by options for volatility adjustment and three unique Kalman filter models, each tailored for different market conditions.
█ How It Works
The Kalman Filter works by maintaining a model of the market state through matrices that represent state variables, error covariances, and measurement uncertainties. Here’s how each component plays a role in calculating the indicator’s trend:
⚪ State Vector (X): The state vector is a two-dimensional array where each element represents a market property. The first element is an estimate of the true price, while the second element represents the rate of change or trend in that price. This vector is updated iteratively with each new price, maintaining an ongoing estimate of both price and trend direction.
⚪ Covariance Matrix (P): The covariance matrix represents the uncertainty in the state vector’s estimates. It continuously adapts to changing conditions, representing how much error we expect in our trend and price estimates. Lower covariance values suggest higher confidence in the estimates, while higher values indicate less certainty, often due to market volatility.
⚪ Process Noise (Q): The process noise matrix (Q) is used to account for uncertainties in price movements that aren’t explained by historical trends. By allowing some degree of randomness, it enables the Kalman Filter to remain responsive to new data without overreacting to minor fluctuations. This noise is particularly useful in smoothing out price movements in highly volatile markets.
⚪ Measurement Noise (R): Measurement noise is an external input representing the reliability of each new price observation. In this indicator, it is represented by the setting Measurement Noise and determines how much weight is given to each new price point. Higher measurement noise makes the indicator less reactive to recent prices, smoothing the trend further.
⚪ Update Equations:
Prediction: The state vector and covariance matrix are first projected forward using a state transition matrix (F), which includes market estimates based on past data. This gives a “predicted” state before the next actual price is known.
Kalman Gain Calculation: The Kalman gain is calculated by comparing the predicted state with the actual price, balancing between the covariance matrix and measurement noise. This gain determines how much of the observed price should influence the state vector.
Correction: The observed price is then compared to the predicted price, and the state vector is updated using this Kalman gain. The updated covariance matrix reflects any adjustment in uncertainty based on the latest data.
█ Three Kalman Filter Models
Standard Model: Assumes that market fluctuations follow a linear progression without external adjustments. It is best suited for stable markets.
Volume Adjusted Model: Adjusts the filter sensitivity based on trading volume. High-volume periods result in stronger trends, making this model suitable for volume-driven assets.
Parkinson Adjusted Model: Uses the Parkinson estimator, accounting for volatility through high-low price ranges, making it effective in markets with high intraday fluctuations.
These models enable traders to choose a filter that aligns with current market conditions, enhancing trend accuracy and responsiveness.
█ Trend Strength
The Trend Strength provides a visual representation of the current trend's strength as a percentage based on oscillator calculations from the Kalman filter. This table divides trend strength into color-coded segments, helping traders quickly assess whether the market is strongly trending or nearing a reversal point. A high trend strength percentage indicates a robust trend, while a low percentage suggests weakening momentum or consolidation.
█ Trend Range
The Trend Range section evaluates the market's directional movement over a specified lookback period, highlighting areas where price oscillations indicate a trend. This calculation assesses how prices vary within the range, offering an indication of trend stability or the likelihood of reversals. By adjusting the trend range setting, traders can fine-tune the indicator’s sensitivity to longer or shorter trends.
█ Sigma Bands
The Sigma Bands in the indicator are based on statistical standard deviations (sigma levels), which act as dynamic support and resistance zones. These bands are calculated using the Kalman Filter's trend estimates and adjusted for volatility (if enabled). The bands expand and contract according to market volatility, providing a unique visualization of price boundaries. In high-volatility periods, the bands widen, offering better protection against false breakouts. During low volatility, the bands narrow, closely tracking price movements. Traders can use these sigma bands to spot potential entry and exit points, aiming for reversion trades or trend continuation setups.
Trend Based
Volatility Based
█ How to Use
Trend Following:
When the Kalman Filter is green, it signals a bullish trend, and when it’s red, it indicates a bearish trend. The Sigma Cloud provides additional insights into trend strength. In a strong bullish trend, the cloud remains below the Kalman Filter line, while in a strong bearish trend, the cloud stays above it. Expansion and contraction of the Sigma Cloud indicate market momentum changes. Rapid expansion suggests an impulsive move, which could either signal the continuation of the trend or be an early sign of a possible trend reversal.
Mean Reversion: Watch for prices touching the upper or lower sigma bands, which often act as dynamic support and resistance.
Volatility Breakouts: Enable volatility-adjusted sigma bands. During high volatility, watch for price movements that extend beyond the bands as potential breakout signals.
Trend Continuation: When the Kalman Filter line aligns with a high trend strength, it signals a continuation in that direction.
█ Settings
Measurement Noise: Adjusts how sensitive the indicator is to price changes. Higher values smooth out fluctuations but delay reaction, while lower values increase sensitivity to short-term changes.
Kalman Filter Model: Choose between the standard, volume-adjusted, and Parkinson-adjusted models based on market conditions.
Band Sigma: Sets the standard deviation used for calculating the sigma bands, directly affecting the width of the dynamic support and resistance.
Volatility Adjusted Bands: Enables bands to dynamically adapt to volatility, increasing their effectiveness in fluctuating markets.
Trend Strength: Defines the lookback period for trend strength calculation. Shorter periods result in more responsive trend strength readings, while longer periods smooth out the calculation.
Trend Range: Specifies the lookback period for the trend range, affecting the assessment of trend stability over time.
-----------------
Disclaimer
The information contained in my Scripts/Indicators/Ideas/Algos/Systems does not constitute financial advice or a solicitation to buy or sell any securities of any type. I will not accept liability for any loss or damage, including without limitation any loss of profit, which may arise directly or indirectly from the use of or reliance on such information.
All investments involve risk, and the past performance of a security, industry, sector, market, financial product, trading strategy, backtest, or individual's trading does not guarantee future results or returns. Investors are fully responsible for any investment decisions they make. Such decisions should be based solely on an evaluation of their financial circumstances, investment objectives, risk tolerance, and liquidity needs.
My Scripts/Indicators/Ideas/Algos/Systems are only for educational purposes!
Adaptive Moving Average (AMA) Signals (Zeiierman)█ Overview
The Adaptive Moving Average (AMA) Signals indicator, enhances the classic concept of moving averages by making them adaptive to the market's volatility. This adaptability makes the AMA particularly useful in identifying market trends with varying degrees of volatility.
The core of the AMA's adaptability lies in its Efficiency Ratio (ER), which measures the directionality of the market over a given period. The ER is calculated by dividing the absolute change in price over a period by the sum of the absolute differences in daily prices over the same period.
⚪ Why It's Useful
The AMA Signals indicator is particularly useful because of its adaptability to changing market conditions. Unlike static moving averages, it dynamically adjusts, providing more relevant signals that can help traders capture trends earlier or identify reversals with greater accuracy. Its configurability makes it suitable for various trading strategies and timeframes, from day trading to swing trading.
█ How It Works
The AMA Signals indicator operates on the principle of adapting to market efficiency through the calculation of the Efficiency Ratio (ER), which measures the directionality of the market over a specified period. By comparing the net price change to total price movements, the AMA adjusts its sensitivity, becoming faster during trending markets and slower during sideways markets. This adaptability is enhanced by a gamma parameter that filters signals for either trend continuation or reversal, making it versatile across different market conditions.
change = math.abs(close - close )
volatility = math.sum(math.abs(close - close ), n)
ER = change / volatility
Efficiency Ratio (ER) Calculation: The AMA begins with the computation of the Efficiency Ratio (ER), which measures the market's directionality over a specified period. The ER is a ratio of the net price change to the total price movements, serving as a measure of the efficiency of price movements.
Adaptive Smoothing: Based on the ER, the indicator calculates the smoothing constants for the fastest and slowest Exponential Moving Averages (EMAs). These constants are then used to compute a Scaled Smoothing Coefficient (SC) that adapts the moving average to the market's efficiency, making it faster during trending periods and slower in sideways markets.
Signal Generation: The AMA applies a filter, adjusted by a "gamma" parameter, to identify trading signals. This gamma influences the sensitivity towards trend or reversal signals, with options to adjust for focusing on either trend-following or counter-trend signals.
█ How to Use
Trend Identification: Use the AMA to identify the direction of the trend. An upward moving AMA indicates a bullish trend, while a downward moving AMA suggests a bearish trend.
Trend Trading: Look for buy signals when the AMA is trending upwards and sell signals during a downward trend. Adjust the fast and slow EMA lengths to match the desired sensitivity and timeframe.
Reversal Trading: Set the gamma to a positive value to focus on reversal signals, identifying potential market turnarounds.
█ Settings
Period for ER calculation: Defines the lookback period for calculating the Efficiency Ratio, affecting how quickly the AMA responds to changes in market efficiency.
Fast EMA Length and Slow EMA Length: Determine the responsiveness of the AMA to recent price changes, allowing traders to fine-tune the indicator to their trading style.
Signal Gamma: Adjusts the sensitivity of the filter applied to the AMA, with the ability to focus on trend signals or reversal signals based on its value.
AMA Candles: An innovative feature that plots candles based on the AMA calculation, providing visual cues about the market trend and potential reversals.
█ Alerts
The AMA Signals indicator includes configurable alerts for buy and sell signals, as well as positive and negative trend changes.
-----------------
Disclaimer
The information contained in my Scripts/Indicators/Ideas/Algos/Systems does not constitute financial advice or a solicitation to buy or sell any securities of any type. I will not accept liability for any loss or damage, including without limitation any loss of profit, which may arise directly or indirectly from the use of or reliance on such information.
All investments involve risk, and the past performance of a security, industry, sector, market, financial product, trading strategy, backtest, or individual's trading does not guarantee future results or returns. Investors are fully responsible for any investment decisions they make. Such decisions should be based solely on an evaluation of their financial circumstances, investment objectives, risk tolerance, and liquidity needs.
My Scripts/Indicators/Ideas/Algos/Systems are only for educational purposes!
