BitMEX Volatility AlertsAlert conditions and bar colors for each of the three volatility indices from BitMEX.
Price: 0.002 BTC / 35 Ripples / 1 NEO
Alerts

Neo BitMEX Futures Hedge Grid Alerts Premium v1.0This indicator was made to streamline finding the optimal entry to cash and carry/hedge on a futures contract when margin trading.
Explanation of the indicator:
This indicator has built-in alert conditions that you can use to give you email alerts, in-browser sound alerts, or SMS alerts. These alerts are based upon futures prices being in contango or backwardation.
From top to bottom, the grid shows XBTU18, XBTZ18, OkEx's Quarterlies (OKCOIN:BTCUSD3M), and CME's futures.
Red: Futures are trading above your defined range (default 1%) of spot
Maroon: Futures are trading above twice your defined range of spot
Lime: Futures are trading below your defined range (default 1%) of spot
Green: Futures are trading below twice your defined range of spot
What's configurable:
% to trigger
Grid size
Bar color toggle
Label toggle
Spot/index source (Bitfinex's BTCUSD, BitMEX's XBTUSD, and BitMEX's XBT Index are available)
Pricing:
Currently this standalone indicator is 0.007 BTC for lifetime use.
Example of use:
On 4 May 2018, BitMEX's XBTU18 was trading >2% above perpetual swap. The grid alerts signaled that and if one were long on bitcoin spot on any exchange, then it would have been a good idea to hedge a short on XBTU18. Eventually from there the premium gap was closed while bitcoin fell.
Here is the indicator shown with bar coloring and labels.

[STUDY]HullMA OCC & SL/TP V3Another Open Close Cross. Now with Hull Moving Average: Alerts, SL TP, ...
Best results at 4h.
Enjoy!

Spectro™ M by HypesterThis is the commercial version of the Spectro™ M
The new BADASS Spectro™ M
Ok, I gotta say this is so cool that I've been dying to write this release note, we're really proud with the amazing features we are releasing and the fact we could deliver them without raising the prices.
Spectro™ Alerts New Settings
The classic and loved entry/exit point finder, and now you can set the Spectro™ Alerts to your own preferences from aggressive to the safest triggering style. So now it can adapt to any trading style easily, from minute-leveraged scalping to yearly positions.
Spectro™ Indicator (Pro 8X Indicator )
This is the Spectro™ brain, and before this update, it was an indicator that was worth extra $10, but now we decided to implement it on the M version for free! Knowing how Spectro™ is behaving will give you an edge when forecasting entry/exit points.
Spectro™ Direction Change Alerts
A life saver, subscriber's words not mine. Spectro™ plots warning signs when it detects possible trend changes before they happen!
Spectro™ Multi-Resolution
Another heavily requested feature, now you can check buy/sell alerts from other timeframes on your chart. Let's say you're trading on 5M but you only want the strongest signals, so you set your custom timeframe to 15M. Or if you are trading a 12H timeframe and you are sure of a reversal and you're trying to catch the bottom so you play around with the custom resolution around 30M~2H for a more reactive triggering.
Or you might just want to confirm if you have a buy on the Daily before proceeding, that's a smart way to check the mid-range trend.
Specter Clouds
This is dope. I wish I could be more polite but this is as badass as it gets. This awesome new feature will tell you when the price is growing or decreasing out of the "organic" area, therefore, it will warn that whatever you're seeing, you shouldn't. In plain English: It means a reversal is coming.
But it doesn't only warns you about reversals several bars before, it also forecasts the future price targets for the respective reversal!
Also, the coloring of the cloud helps you find the bottom/top, the very beginning of the following reversal.
X Algo Confirmations
This is practical as ****! We know you guys are always checking other indicators to improve your odds so we decided to do it for you, but faster, better and more precise. We called it X because it checks so many indicators that we just called it X.
This is a proprietary blend weighted average between several indicators, you can name all the common ones...STOCH, RSI, STOCH RSI, BB, DMI, ATR, MFI, OBV, CCI, MFI, DPO, MACD, EMO, TSI, Elliot Waves, Fractal Patterns, Fibonacci LEVELS...well you get it... plus 3 proprietary indicators on the conservative mode. Now speaking English: We check up to 20 indicators for you and deliver it in a way that all it takes is one second to check ALL of them.
It also has an aggressive, moderate and conservative mode. The difference is just the amount indicators we check for you, more confirmations you need, more conservative you are.
Trend Analyser 2.0
We offer 3 types of TA. A brand-new proprietary price-based trend analyzer that warns you about violent price change and corrections, an MA blend good for scalping and spotting trend reversals and a classic fully customizable MA crossing.
Spectro offers you 8 different types of the most popular moving averages for the custom mode, from Simple Moving Averages to Fractal Moving Averages - so that creates 64 basic trend analyzer options. You can change the lookback (length) period, time frame resolution, and more. Resulting in a very flexible, simple to use and powerful trend analyzer with endless customization options.

Miscbot 5m 2.2aAn automated strategy utilizing Autoview and Bitmex on the 5m.
Use at your own risk. I take no responsibility lost currency using this.
Link to strategy:

[ALERTS] lamBOTghiniIt is a script based on changes in trend of EMAs.
You can copy it, modify it to your liking and maybe even buy a lambo.
Try it and if you can think of how to improve it please comment.
Enjoy!!!

NGRN MACD-X & RSI v4MACD-X, RSI & Volume Indicator & Alerts Study - Version 4
Overview
This study and it's associated strategy were modeled after the famous Philakone described algorithms on his now defunct instructional video series.
This indicator allows for full customisation of parameters and interaction between three indicators that allow users to shape their trading methods to their desired goals.
This associated strategy also allows users to backtest the study alerts script and find the best settings towards that end.
MACD + RSI + VOLUME - are of the most powerful and widely usded indicators, MACD/Histogram crosses, coupled with RSI & Volume increases/decreases will detects areas of deeply oversold / overbought and buys/sells on the reversal
Features
Full customisation - All parameters are open for customising to allow the trader to build their own strategy and adapt from market to market.
Clean/Simple UI - Facilitating ease of use.
Enable Buying OR Selling, - or have them both active at the same time.
Toggle off and on ALTERNATING Buy and Sell feature (pyramiding) - to allow for consecutive DCA style buys or SCALING out of an entry (partial sell).
Customizable Stop-Loss plot - to enable users to create a STOP-LOSS alert option or other alert(s) based on the plot location. See settings screenshot.
Toggle Auto Stop-Loss sell option - to enable users choose whether or not to automatically issue a sell signal when close crosses stop loss plot, or choose to toggle off if not profitable.
Customizable Take-Profit plot - to enable users to create a TAKE-PROFIT alert option or other alert(s) based on the plot location.
Study and associated Strategy - to use the TradingView ‘Strategy Tester’ back-testing features to find the best alert settings for specific coins in bear, bull and sideways markets.
Changes Version 4
Improved STOP-LOSS plot draw (red line).
Added the option to automatically sell when stop-loss cross triggered or have the option disabled, in the event a better profit can be achieved.
Added new TAKE-PROFIT plot (aqua line) to visually guide users where to place the TAKE-PROFIT parameter as well as give users options to create alerts based on the TAKE-PROFIT plot.
Access
Full Access is 0.1 ETH , one time fee for LIFETIME access to the STUDY indicator, STRATEGY and future updates as well as support and SETTINGS for various markets on the Binance Exchange.
Settings
SCREENSHOT LINKS:
BUY SETTINGS: prntscr.com
SELL SETTINGS: prntscr.com

FIB Band Signals with RSI FilterOriginal Author: Rashad
Added by Rashad 6-26-16
These Bollinger bands feature Fibonacci retracements to very clearly show areas of support and resistance . The basis is calculate off of the Volume Weighted Moving Average . The Bands are 3 standard deviations away from the mean. 99.73% of observations should be in this range.
Updated by Dysrupt 7-12-18
-Buy signals added on lower bands, mean and upper 3 bands
-Sell signals added to upper 3 bands
-RSI filter applied to signals
-Alerts not yet added
-Long Biased
NOTE: This is NOT a set and forget signal indicator. It is extremely versatile for all environments by adjusting the RSI filter and checking the band signals needed for the current trend and trading style.
Donchian Mean Reversion AlertsDonchian Channels mean reversion signals/alerts with RSI filtering with signals applied to the mean, for strong trend situations.
Original Author: ChrisMoody
Modified Donchonian Channel with separate adjustments for upper and lower levels
Purpose is if you expect big move up, Use lower input example 3 or 4, and longer lower input, 40 - 100 and use lower input line as a stop out
Opposite if you expect big move down
Mid Line Rule in Long Example. If lower line is below entry take partial profits at Mid Line and move stop to Break even.
If Lower line moves above entry price before price retraces to midline use Lower line as Stop...Opposite if Shorting
Created by user ChrisMoody 1-30-2014
Updated 7-11-2018 by Dysrupt
Revamped for mean reversion strategy
Created midline alerts for strong trending upside buy signals/downside sell signals.
Added RSI Filtering
Added Alerts
Removed bar color change
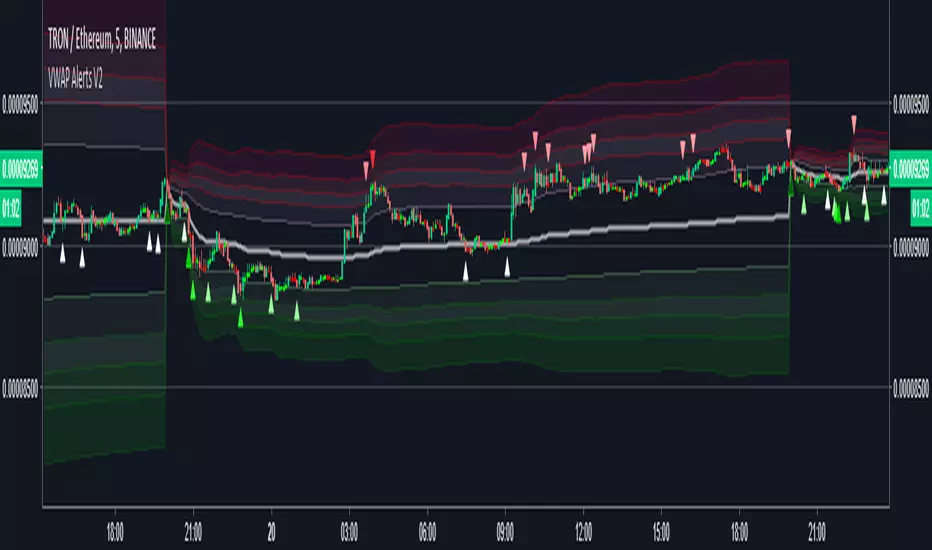
VWAP Alerts V2Alerts added to "VWAP Stdev Bands v2" by SandroTurriate
Changes
-Adjusted trigger conditions for higher signal sensitivity
-Color change on bands and signals for better readability and ease on the eyes
-Alerts added for up to 4 deviations up and down
-Re-enabled deviations 4 and 5
-Re-enabled previous close
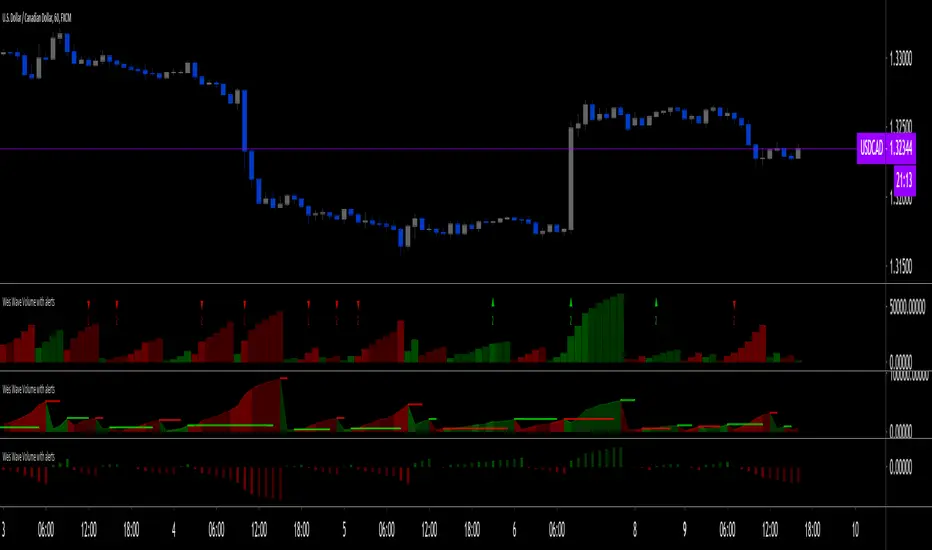
Weis Wave Volume with alert [LazyBear]LFI added alert conditions to LazyBear's indicator on the second bar of a turn to bullish or bearish.
To use alerts:
be sure you are on the interval you want to create your alert,
be sure the indicator inputs are the way you want them,
create an alert, choose this indicator and then choose one of the 2 conditions.
Changes to the inputs after an alert was created require alerts to be recreated.
The alerts trigger on the second bar to avoid noise.
I also changed the default aesthetics, but more importantly the default period (from 2 to 5, because that's what I use most often).
VWAP AlertsVWAP Alerts for intraday VWAP bounces and VWAP deviation mean reversions. I am currently finalizing the alert section make it more streamlined.
Thanks to @TheYangGuizi for an amazing script


[TPA]Nice MA (alert condition)
It is a moving average line that helps in the trading of altocons. In addition, close to the corresponding moving average line (+ -5% gap support function), each moving average line by alarm function. Both alarms and alarms on all moving average lines are possible.
알트코인 매매시에 도움이 되는 이동평균선이다. 또한 해당 이동평균선에 근접시(+-5%갭 지원기능 있음) 각각 이동평균선별로 알람기능을 넣었다. 각각알람과 모든이동평균선 접촉시 알람 모두 가능하다.
[STUDY]Kagi Emulator OCC & SL/TP V3This is the script with alerts for the previous backtest.
Modify "reversal" according to the pair
It has take profit and stop loss too.
Thanks and Enjoy...

Money Flow Index + AlertsThis study is based on the work of TV user Beasley Savage ( ) and all credit goes to them.
Changes I've made:
1. Added a visual symbol of an overbought/oversold threshold cross in the form of a red/green circle, respectively. Sometimes it can be hard to see when a cross actually occurs, and if your scaling isn't set up properly you can get misleading visuals. This way removes all doubt. Bear in mind they aren't meant as trading signals, so DO NOT use them as such. Research the MFI if you're unsure, but I use them as an early warning and that particular market/stock is added to my watchlist.
2. Added 60/40 lines as the MFI respects these incredibly well in trends. E.g. in a solid uptrend the MFI won't go below 40, and vice versa. Use the idea of support and resistance levels on the indicator and it'll be a great help. I've coloured the zones. Strong uptrends should stay above 60, strong downtrends should stay below 40. The zone in between 40-60 I've called the transition zone. MFI often stays here in consolidation periods, and in the last leg of a cycle/trend the MFI will often drop into this zone after being above 60 or below 40. This is a great sign that you should get out and start looking to reverse your position. Hopefully it helps to spot divergences as well.
3. Added alerts based on an overbought/oversold cross. Also added an alert for when either condition is triggered, so hopefully that's useful for those struggling with low alert limits. Feel free to change the overbought/oversold levels, the alerts + crossover visual are set to adapt.
Like any indicator, don't use this one alone. It works best paired with indicators/techniques that contradict it. You'll often see a OB/OS cross, and price will continue on it's way for many weeks more. But MFI is a great tool for identifying upcoming trend changes.
Any queries please comment or PM me.
Cheers,
RJR

Heikin Ashi Historical TF Candles, with AlertsRunning on 1-minute regular candle chart, this indicator plots the HA candles of any timeframe, recalculating the in-process values of that candle during each minute of its life.
Also contains our AV trading signals, and data gap detection/trade prohibition.
V72: New indicator.

[Autoview][Alerts]Blank R0.13BThis is a fork of JustUncleL's
Dual MA Ribbons R0.13
It is now a blank template for making new strategies / alerts for autoview
The changes are as follows:
Removed actual algo
Establish functions for long Signal, long Close Signal and short Signal, short Close Signal to minimize the places code must be edited to update / replace algos
Make allow Long and allow short and invert trade directions independent options
Added support for alternate candle types
Added autoset backtest period feature, and optional coloring
Moved strategy calls in to functions so they can all be commented out or activated / disabled in a single block at the top of the script

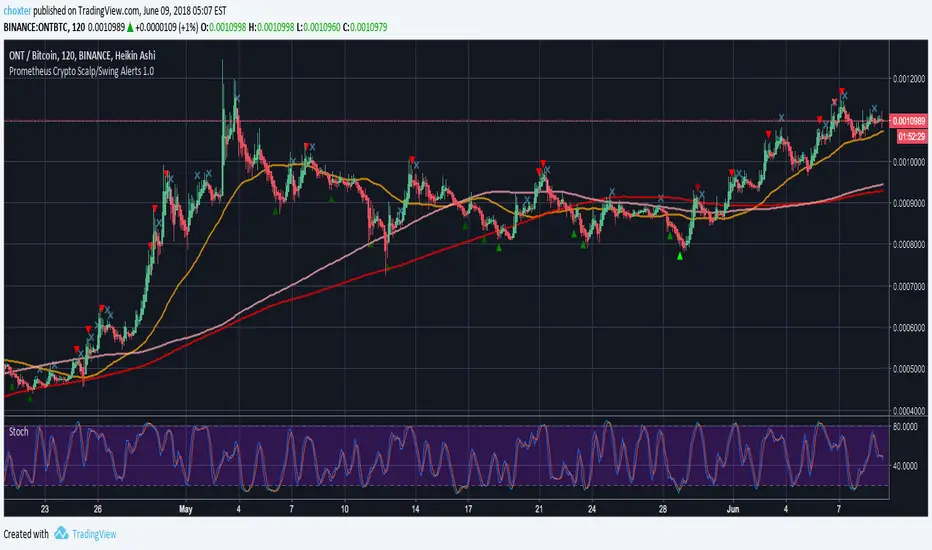
Prometheus Crypto Scalp/Swing Alerts 1.0Prometheus Crypto Scalp/Swing Alerts was built for scalp/swing crypto traders but you probably got that figured out by yourself. It offers high quality entries and exits which can be manually adjusted to suit your trading style. It performs great on any timeframe but scalp traders will love it for it’s ability to offer many entry points followed by quick exits, giving you opportunity to earn a few % within a few hours.
It has built in BUY/SELL alerts that can be connected to Autoview for automated trading.
How it works?
No drama, no complicated numbers - you only need to set the Alert strength indicator value (5-50) and according to that you will get the kind of alerts you like most. Choosing higher quality alerts will result in smaller quantity of those while picking out just the best entry and exit points and removing less interesting ones. You can always experiment and see what suits your trading style best.
Did we get your attention? If you wish to buy our script, shoot us a PM.
Volume_Master_420Volume is a key component to moniter for trading; this indicator has volume and many other key indicators built in
The Aqua and Fuchsia bg colors are multi fisher confluence signals. Aqua ==> long bias; Fuchsia ==> short bias
The blue and red bg colors are when certain 'bar shapes' of volume print with confidence scores (usually good bars to add on a trend)
The white circles are when volume is making highs or lows of 52 periods back
The blue dots below are the 'atlas' signal showing when BBands are shrinking in a statistically significant way ==> large moves incoming
The volume itself is based on trend volume accumulation by just uncle L;
I have added alerts for when the tva flips from - to + (long alert) and the opposite + to - (short alert)
GL HF
xoxo
Snoop

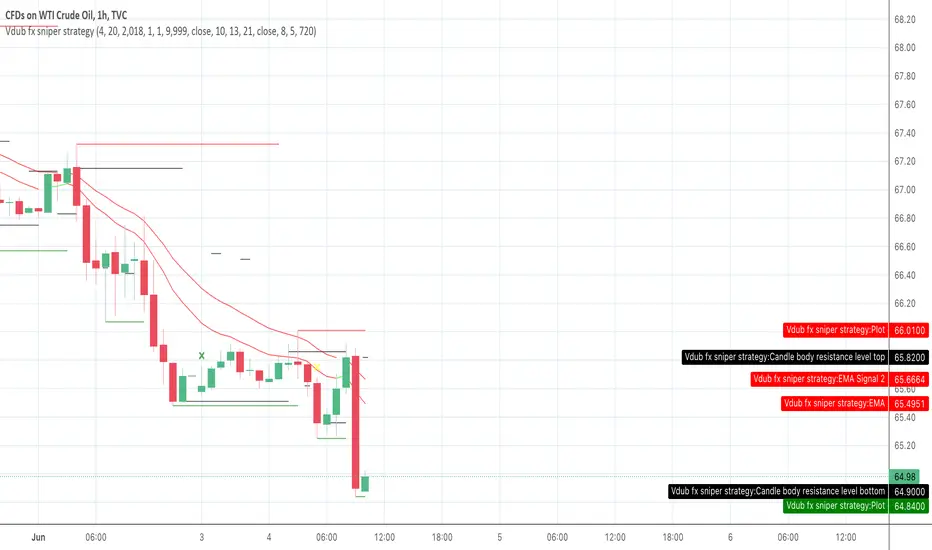
Vdub fx sniper strategy with alertsThis mimics the performance of the strategy created by Vdub FX Sniper, the user should buy when it marks green and sell when it marks yellow, however i can't get to the alert system trigger effectively, any ideas?
Modified Fisher Strategy Alerts BitcoinAlerts for strategy using Fisher transform with modification and implemented into Bitcoin trading perspective

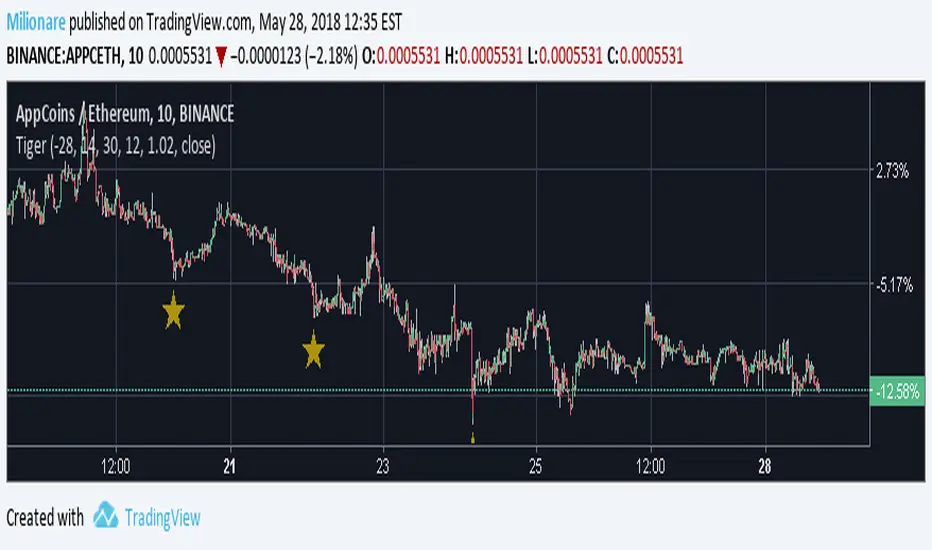
TIGER Pro - buy alert script - finders bottomScript with many trending oscillators and trend filter. It can be set to all tradable coins. Perfectly works for 5-30 min.Script has a Alert for purchase built in. Autoview is used for purchase and the sale is controlled via PT. It is important to use stop loss and sales strategy .Using these signals is at your own risk.
An invitation is up to 200 people. This is a test version.
example alert for Binance : e=binance s=APPCETH b=buy u=currency q=0.017 t=limit p=0.1%
e=binance s=APPCETH b=buy delay=150 c=order
Option alert:Buy
:Once Per Bar Close
For more info PM