[New series!] [Consistent Losing Strategies] 34 EMA Scalping//---------------------------INTRO------------------------------
Hi All!
Let me introduce myself as a semi-successful forex trader & lover of automation.
I've taken to algo trading and have been hunting down strategies (that usually use indicators) to automate, backtest, and hopefully implement in MT4.
Unfortunately, most strategies are complete bulls*** and the select cases that are shown to "prove" success are limited.
These strategy sources often do not provide useful analytics either.
I want to change that approach to trading! We can really benefit each other and the community by being methodical about backtesting
as well as evaluating our results with some kind of scoring heuristic.
As for what that standardized process looks like..well I'm still working on it.
I'm pretty much on Tv for multiple hours of the day, screening strategies via Pinescript and I'd like to start sharing my progress!
This is a new series I'd like to start on consistently losing strategies. I'll make all the code public, so if you think I've made a blunder
or approached a problem the wrong way, then drop me a DM or paste your fix into the comments.
//---------------------------STRAT------------------------------
34 EMA Scalping strategy (ref. forextradingstrategies4u )
How you're supposed to trade it:
BUY:
1. Market is in an down trend as shown by the 34 EMA
2. Price breaks above a downwards trend line
3. Price breaks above the 34 EMA
4. Look for a very bullish candlestick or chart pattern
SELL:
1. Look for the 34 EMA to show we are in an uptrend
2. Price breaks below an upwards sloping trend line
3. Price breaks below 34 EMA
4. Look for a bearish candlestick or a chart pattern
//---------------------------CONC------------------------------
Q: Why does it fail?
A: I believe this strategy relies too much on subjective input (aka, trendlines).
Q: Why does it fail as an algo?
A: The 34 EMA is no more predictive than any other EMA, although it does a good job at filtering out noise.
Q: Should I try it out?
A: No, it's trash. This is the proof that it is trash.
Algotrading

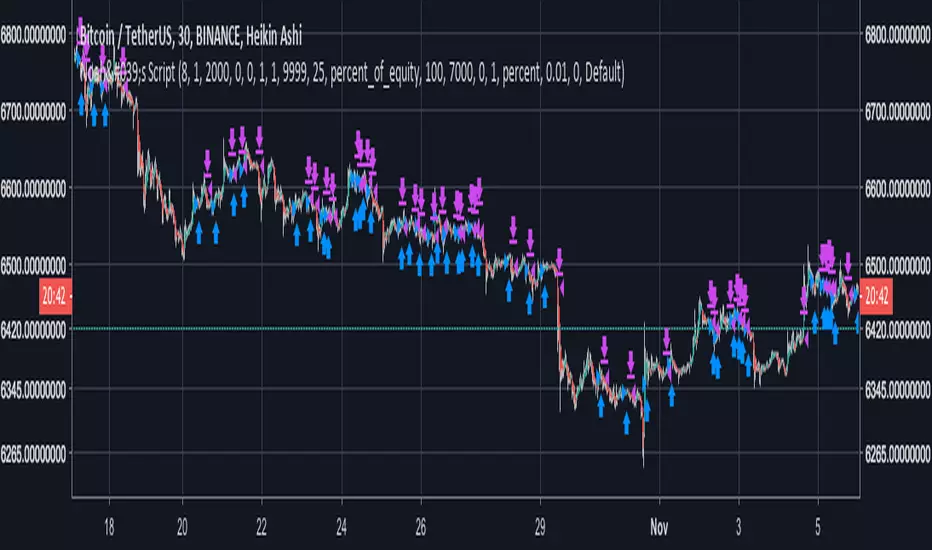
HATbot v1 Automation Script and Indicator [Backtest]This is the debut release of HATbot.
HATbot is a terrible name for a new trend following indicator and strategy script.
Backtest window: 2018-01-01 to 2019-01-01.
Initial capital: $1000
Shorting: enabled

Megalodon Pro Automated Trader BackTester
Why Megalodon?
We believe that enlightening others is an incredible way to make this world a better place. That's why we created the tools you need to stop worrying about your investments and focus on what really matters in your life.
What is Megalodon?
Megalodon uses Artificial Intelligence that combines 574 back-tested indicators and 2674 back-tested setups, simultaneously.
Megalodon works with any kind of asset , market state and time frame .
What is the win rate?
Megalodon is extremely accurate and offers insane profits as long as the fundamental analysis is done right .
Backtesting results can be found on our social media or down below .
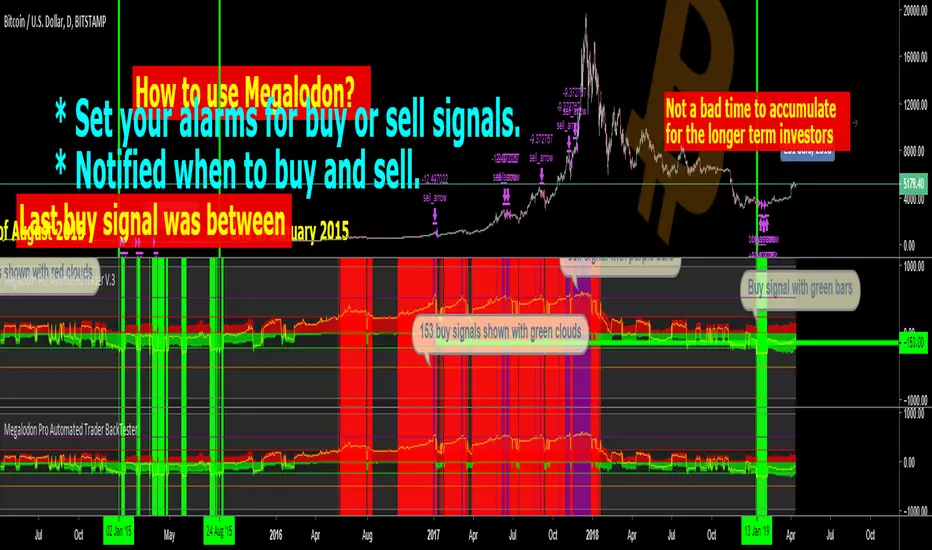
How to use Megalodon Pro Automated Trader?
Simply, orange rectangles are buy signals and purple rectangles are sell signals .
Green clouds show buy signals and red clouds show sell signals.
Yellow line shows the difference between buy and sell counts.
How to set alarms on Megalodon Pro Automated Trader?
Click on Alert, select Megalodon Pro Automated Trader and click on Buy-Signal or Sell-Signal. More details can be found on our social media.
You may also watch our Megalodon Investing Tutorials on Youtube for more information.
How to purchase?
Megalodon is totally FREE .
You may upgrade to Megalodon Pro for the most important features , including automizing your trading on any asset profitably, setting up alarms to get notified , joining to our VIP telegram channel to get daily updates and our VIP telegram group to interact with the community. Simply go to our website on our TradingView page for learning more and joining us for free.
Some of the backtesting results are:
BTC/USD for longer time frame trading in the bear market for the last year.
APPLE for longer time frame trading in the bull market for the last 10 years.
EURO/USD for day trading in the neutral market for the last month.
BTC/USD for day trading in the bull market for the last 15 days.
APPLE for day trading in the neutral market for the last 2 days and 6 hours.
Bitcoin Trading Algo, 30,500% profit long + short. Beats HODLingREAD DISCRIPTION FIRST
Trading view have taken off the Invite Only options for scripts from free accounts and since I usually only like people I know using my scripts I have programmed my own password and Keycode system within pine script, the Keycode changes every month and is determined by a random number algorithm so you will need to know both the password and the keycode for the script to wok for you.
The objective for this strategy was to reduce the standard divination of bitcoin returns through risk management, this is done with both long and short trades. It looks to get on board when a trend is detected and adds to the position to average out all entry points. When the momentum begins to decelerate all trades are closed. 50% of these trades will usually be in profit and 50% will usually be a loss, however profits are 3x larger than losses.
To demonstrate that the deviation of retuns of the strategy is lower than hodling, I leaveraged the strategy to a similar drawdown level to hodling so that you can compare the two.
When risk adjusted, my strategy beats buy and hold returns by about 600%, although I am personally trading the strategy unleaveraged.
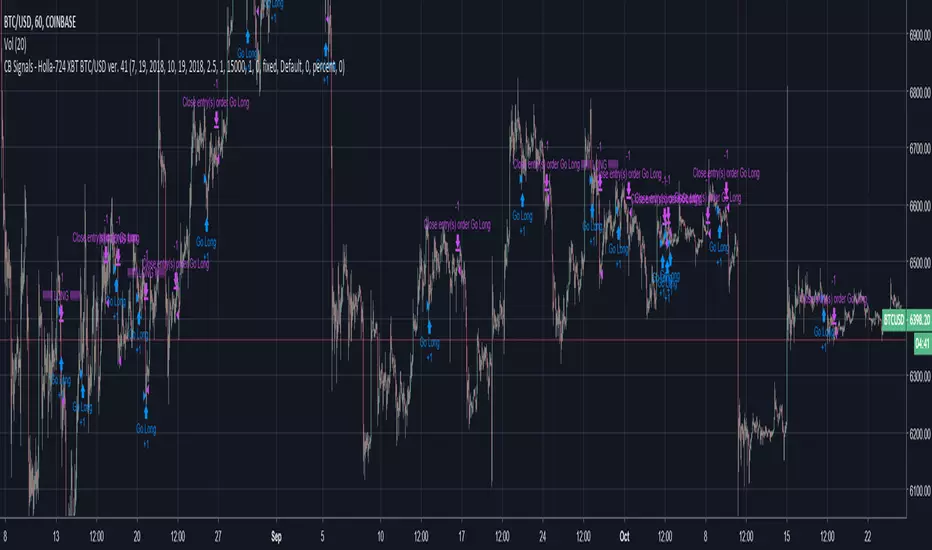
CB Signals - Holla-724 SPOT BTC/USD LONG ONLY (Paid Algo)This is the updated script with results for the last 3 months of the trading room July 19 - Oct 19th. This algo returned (1.86%) vs. Buy and Hold returns of (-12%)
See details on performance in this period below by clicking the "Performance Summary" Tab
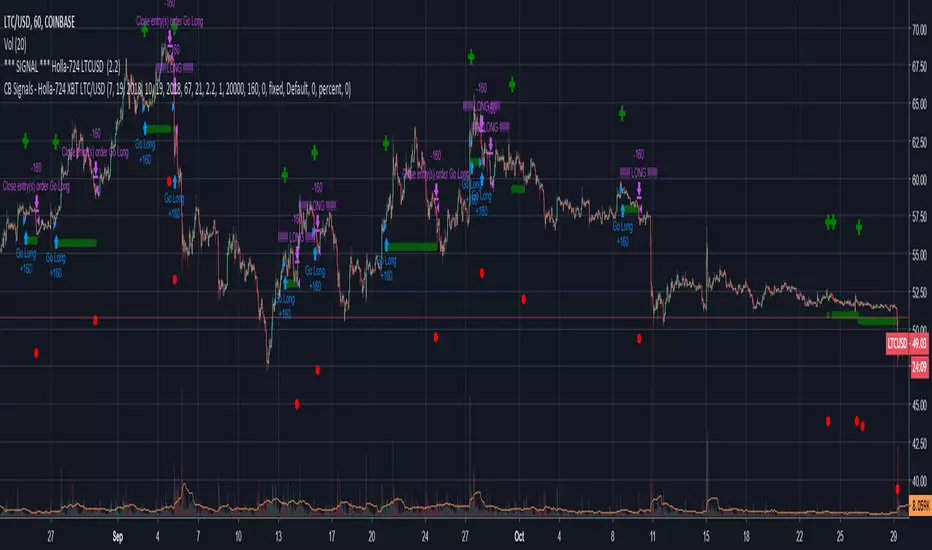
CB Signals - Holla-724 SPOT LTC/USD LONG ONLY (Paid Algo)This is the updated script with results for the last 3 months of the trading room July 19 - Oct 19th. This algo returned (-7.25%) vs. Buy and Hold returns of (-40.95%)
See details on performance in this period below by clicking the "Performance Summary" Tab
PGT: Pretty Good TraderLittle bit of background :
I am a broke college student on the East coast, and I have developed a hobby for creating trading algorithms. This is one of the better scripts that I have written. Unfortunately, as a broke college student, I don't have the disposable income to actually trade using real money. If you are interested in donating to my broke college student fund, please message me!
On to the script :
This script was written in pine version 3 and does not calculate_on_tick . This means that it does not repaint . The numbers you see are, to the best of my knowledge, accurate.
Because most scripts tend to overfit data to generate the "best looking data", I decided to create an algorithm that would be generalizable as possible to a diverse number of trading pairs. This script works on both crytpo markets(works best on smaller time frame) and stock markets(works best on larger time frames).
I am publishing this script to both gauge and generate interest in a Python trading bot which I have written which automatically buys and sells on different exchanges by using the predictive signals of this indicator.

My AlgoTraderFirst, please find it in your heart to donate to my broke college student fund. I am in the final stages of making an algorithmic trading bot in Python, which hooks up to this particular exchange, but I do not have the disposable income to really test it out, so any donation helps. Comment below to let me know you donated so others can see your support!
Please send BTC Donations to: 13ZJ3xTLgJ6hNrv7e5eyEqhabxivYnuu8p
Please send LTC Donations to: LYeFrR9faLaAxJdB1anqVu3mCNxADZDHND
Anyway, on the the program.
I made an algorithmic trader which uses a set of self made indicators. This algorithm was written in pine version 3 and does not calculate_on_tick , therefore it does not repaint . The numbers you see are, to the best of my understanding, accurate.
Because I was concerned about overfitting, I created this algorithm with the intention of being generalizable to many different trading pairs. This program is generalizable to most trading pairs -- both crypto and normal stocks. This algorithm works best on shorter time frames for crypto markets, and longer timeframes for the conventional stock market.
Please let me know what you think and what I could do better!
CB Signals - Holla-724 BITMEX BTC/USD Long/Short (Paid Algo)This algo uses a number of strategies developed from 7 yrs of trading this concept in the FX markets. I have modified it for Leverage trading on BITMEX exchange.
You may view detail summary of live performance of this Algo dating from Jan 1st 2018 - Nov 9th 2018 (In one of Bitcoin's worst bear markets) below by clicking the "Performance Summary" Tab :
To signup for this algo please visit the link below:
www.cryptoblood.io

Bullish Engulfing Backtest This is a bullish reversal pattern formed by two candlesticks. Following a downtrend,
the first candlestick is a down candlestick which is followed by an up candlestick
which has a long real body that engulfs or contains the real body of the prior bar.
The Engulfing pattern is the reverse of the Harami pattern.
WARNING:
- For purpose educate only
- This script to change bars colors.

Bearish Engulfing Backtest This is a bearish candlestick reversal pattern formed by two candlesticks.
Following an uptrend, the first candlestick is a up candlestick which is
followed by a down candlestick which has a long real body that engulfs or
contains the real body of the prior bar. The Engulfing pattern is the reverse
of the Harami pattern.
WARNING:
- For purpose educate only
- This script to change bars colors.

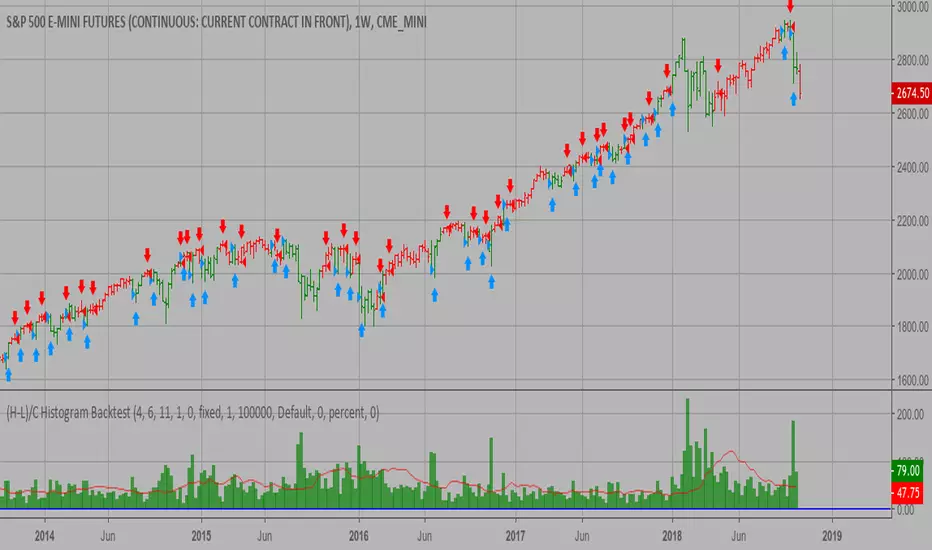
(H-L)/C Histogram Backtest This histogram displays (high-low)/close
Can be applied to any time frame.
WARNING:
- For purpose educate only
- This script to change bars colors.
CMO & WMA Backtest ver 2.0 This indicator plots Chandre Momentum Oscillator and its WMA on the
same chart. This indicator plots the absolute value of CMO.
The CMO is closely related to, yet unique from, other momentum oriented
indicators such as Relative Strength Index, Stochastic, Rate-of-Change,
etc. It is most closely related to Welles Wilder?s RSI, yet it differs
in several ways:
- It uses data for both up days and down days in the numerator, thereby
directly measuring momentum;
- The calculations are applied on unsmoothed data. Therefore, short-term
extreme movements in price are not hidden. Once calculated, smoothing
can be applied to the CMO, if desired;
- The scale is bounded between +100 and -100, thereby allowing you to clearly
see changes in net momentum using the 0 level. The bounded scale also allows
you to conveniently compare values across different securities.

Trend Trader Bands Backtest This is plots the indicator developed by Andrew Abraham
in the Trading the Trend article of TASC September 1998
It was modified, result values wass averages.
And draw two bands above and below TT line.

Trend Trader AVR Backtest This is plots the indicator developed by Andrew Abraham
in the Trading the Trend article of TASC September 1998
It was modified, result values wass averages.

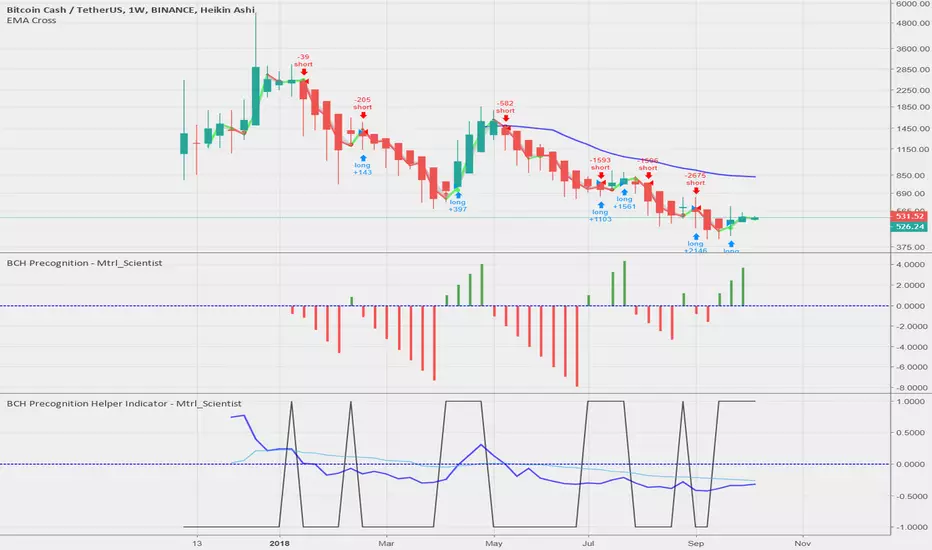
BCH Precognition - Mtrl_ScientistHello everyone,
Following up on my first bot, I've tuned my algorithm to work with Bitcoin Cash. In order to get rid of these nasty (and sometimes costly) indecision points, I've just enabled the 'Recalculated After Order Fill' option, which... well, recalculates the algorithm on the spot (instead of waiting for 1 additional bar) for situations where a signal is immediately followed by a conflicting signal, effectively cancelling it out. Obviously you have to rely on your own judgement if that happens in a real world scenario. However, in this simulated environment, this change resulted in a 0% risk, whereas the gain exceeded 800% with an initial capital of $100'000.
Again, in order for the results to be as accurate as possible, I've averaged the date from all major exchanges.
All of this is free to use for you, and you are welcome to share it.
If you like it, please give me a follow on Trading View & Twitter.
If you have any requests or suggestions/concerns, please let me know!
Note:
- This algorithm works best for Heikn Ashi candles, but I'm working on improving it for normal candles
- This is not financial advice (I'm in chemistry, not finance), so do your own research
Mtrl_Scientist
Ichimoku Backtest Ichimoku Strategy
You can change long to short in the Input Settings
WARNING:
- For purpose educate only
- This script to change bars colors.

Absolute Price Oscillator (APO) Backtest 2.0 The Absolute Price Oscillator displays the difference between two exponential
moving averages of a security's price and is expressed as an absolute value.
How this indicator works
APO crossing above zero is considered bullish, while crossing below zero is bearish.
A positive indicator value indicates an upward movement, while negative readings
signal a downward trend.
Divergences form when a new high or low in price is not confirmed by the Absolute Price
Oscillator (APO). A bullish divergence forms when price make a lower low, but the APO
forms a higher low. This indicates less downward momentum that could foreshadow a bullish
reversal. A bearish divergence forms when price makes a higher high, but the APO forms a
lower high. This shows less upward momentum that could foreshadow a bearish reversal.
You can change long to short in the Input Settings
WARNING:
- For purpose educate only
- This script to change bars colors.

Market Facilitation Index (MFI) Backtest The Market Facilitation Index is an indicator that relates price range to
volume and measures the efficency of price movement. Use the indicator to
determine if the market is trending. If the Market Facilitation Index increased,
then the market is facilitating trade and is more efficient, implying that the
market is trending. If the Market Facilitation Index decreased, then the market
is becoming less efficient, which may indicate a trading range is developing that
may be a trend reversal.
You can change long to short in the Input Settings
WARNING:
- For purpose educate only
- This script to change bars colors.

Keltner Channel Backtest The Keltner Channel, a classic indicator
of technical analysis developed by Chester Keltner in 1960.
The indicator is a bit like Bollinger Bands and Envelopes.
You can change long to short in the Input Settings
WARNING:
- For purpose educate only
- This script to change bars colors.

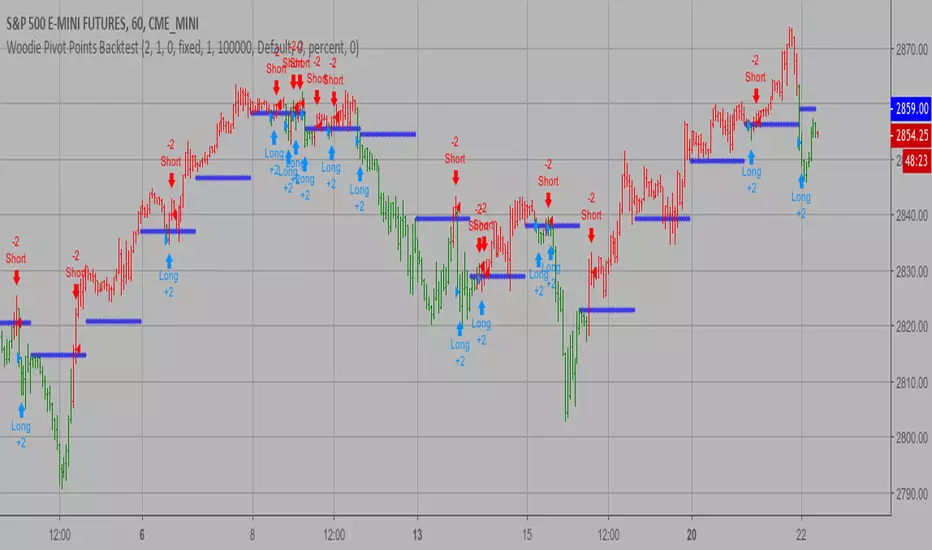
Woodie Pivot Points Backtest Simply input the vales of the high, low and closing price of the previous
period to calculate the Woodie pivot point and the associated resistance
and support levels for the present period.
You can change long to short in the Input Settings
WARNING:
- For purpose educate only
- This script to change bars colors.
Volatility Backtest The Volatility function measures the market volatility by plotting a
smoothed average of the True Range. It returns an average of the TrueRange
over a specific number of bars, giving higher weight to the TrueRange of
the most recent bar.
You can change long to short in the Input Settings
WARNING:
- For purpose educate only
- This script to change bars colors.

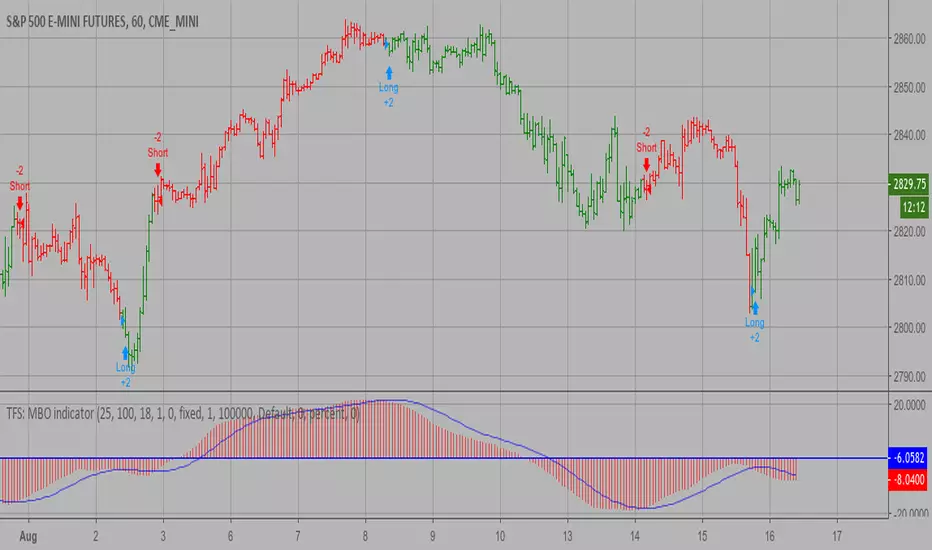
TFS: MBO Backtest MBO indicator is the third component of TFS trading system. This indicator
was developed by Bryan Strain and Mark Whitley.
The idea of MBO is similar to moving average convergence/divergence (MACD)
indicator. It is calculated by subtracting the 200-day moving average from
the 25-day moving average.
You can change long to short in the Input Settings
WARNING:
- For purpose educate only
- This script to change bars colors.