Crypto Futures Basis Tracker (Annualized)🧩 What is Basis Arbitrage
Basis arbitrage is a market-neutral trading strategy that exploits the price difference between a cryptocurrency’s spot and its futures markets.
When futures trade above spot (called contango), traders can buy spot and short futures, locking in a potential yield.
When futures trade below spot (backwardation), the reverse applies — short spot and go long futures.
The yield earned (or cost paid) by holding this position until expiry is called the basis. Expressing it as an annualized percentage allows comparison across different contract maturities.
⚙️ How the Indicator Works
This tool calculates the annualized basis for up to 10 cryptocurrency futures against a chosen spot price.
You select one spot symbol (e.g., BITSTAMP:BTCUSD) and up to 10 futures symbols (e.g., DERIBIT:BTCUSD07X2025, DERIBIT:BTCUSD14X2025, etc.).
The script automatically computes the days-to-expiry (DTE) and the annualized basis for each future.
A table displays for each contract: symbol, expiry date, DTE, last price, and annualized basis (%) — making it easy to compare the forward curve across maturities.
⚠️ Risks and Limitations
While basis arbitrage is often considered low-risk, it’s not risk-free:
Funding and financing costs can erode returns, especially when borrowing or using leverage.
Exchange or counterparty risk — if one leg of the trade fails (e.g., exchange default, margin liquidation), the hedge breaks.
Execution and timing risk — the basis can tighten or invert before both legs are opened.
Liquidity differences — thin futures may have large bid-ask spreads or slippage.
Use this indicator for analysis and monitoring, not as an automated trading signal.
Disclaimer: Please remember that past performance may not be indicative of future results. Due to various factors, including changing market conditions, the strategy may no longer perform as well as in historical backtesting. This post and the script don't provide any financial advice.
ARB

IDX Utility Set [zidaniee]Purpose
This indicator is not a technical analysis tool. It’s a companion overlay designed to guide your analysis of the uniquely structured Indonesia Stock Exchange (IDX).
Core Features
Centered Ticker Display – Clean, readable ticker shown at the center of the chart.
Company Name – Displays the listed company’s full name.
Active Timeframe – Shows the currently selected timeframe.
Additional Features
ATH & ATL Markers – Labels the All-Time High (ATH) and All-Time Low (ATL) and shows the percentage distance from the latest price to each level, so you can quickly gauge upside/downside room.
IDX Fraction (Tick) Levels – Visualizes Indonesia’s price-fraction (tick) brackets. This matters because tick size changes by price range—very useful for scalpers and fast traders.
ARA/ARB Levels (Realtime) – Plots Auto-Reject Upper (ARA) and Auto-Reject Lower (ARB) levels in real time. Levels refresh in line with IDX trading hours 09:00–16:00 WIB (UTC+7), so your view stays consistent both during and outside market hours. This feature already complies with the latest rules and adjustments set by the Indonesia Stock Exchange (IDX).
Suspension Status – Shows SUSPENDED if the stock is halted/suspended, helping you avoid unnecessary analysis. The suspension check compares today’s date with the last available candle date and accounts for weekends.
Note: WIB = Western Indonesia Time (UTC+7).

Currency Conversion for Dual Listed Stocks
This is a small tool for automatic currency conversion for dual listed stocks that trade in different currencies, i.e. Biontec: BNTX (USD) / 22UA (EUR).
- The label shows the converted price and the underlying's currency.
- Base currency is set to EUR.
- Automatically detects the underlying currency via syminfo.currency and converts it.

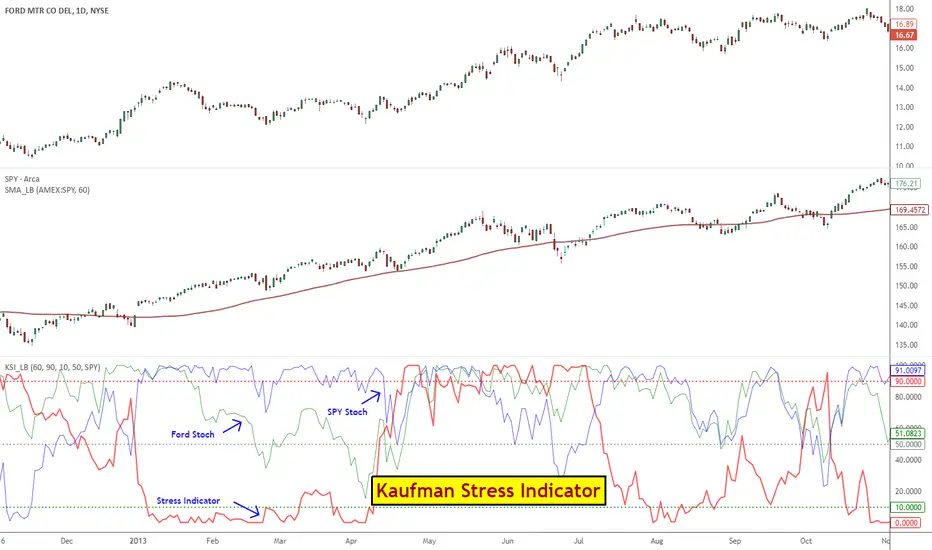
Kaufman Stress IndicatorStress Indicator, first proposed by Mr. Perry Kaufman, provides an easy way for trading pairs / arbs.
Kaufman's trading rules for Stress Indicator:
- Decide on a pair to trade: For ex., AAPL v QQQ
- Calculate the Stress Indicator (SI) for that pair
- Buy the stock when SI 50
- Calculate the 60-day moving average of QQQ
- If the trend of QQQ is down, hedge the stock position with QQQ equal to the risk of the stock using the 20-day ATR of each
- Exit the hedge when the stock position exits, or exit the hedge when the trend of QQQ turns up
- Do not trade stocks under $3
Explanation of all potential SI applications is beyond this post. For more info:
- ptasite.s3.amazonaws.com
- www.futuresmag.com
- kaufmansignals.com
- TASC 2014 March issue.
Though Kaufman's Stress stategy is built on top of this Stress Indicator, I suggest reading up his full strategy guidelines before applying this.
Kaufman suggests using 60SMA on the index to track the slope. I have included a custom SMA (find it in the middle pane) that can show SMA for any selected symbol. Use the guide below to import that in to your charts: drive.google.com