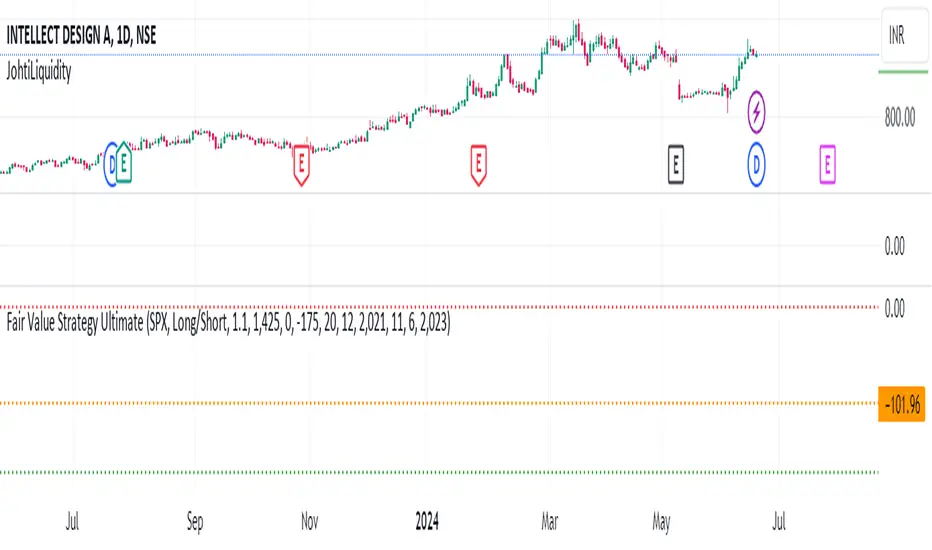
JohtiLiquidityThis libraray will be provide the liquity points that's will be help to find exact point people going to take trades and it will the most important area
Arrays
MathTransformLibrary "MathTransform"
Auxiliary functions for transforming data using mathematical and statistical methods
scaler_zscore(x, lookback_window)
Calculates Z-Score normalization of a series.
Parameters:
x (float) : : floating point series to normalize
lookback_window (int) : : lookback period for calculating mean and standard deviation
Returns: Z-Score normalized series
scaler_min_max(x, lookback_window, min_val, max_val, empiric_min, empiric_max, empiric_mid)
Performs Min-Max scaling of a series within a given window, user-defined bounds, and optional midpoint
Parameters:
x (float) : : floating point series to transform
lookback_window (int) : : int : optional lookback window size to consider for scaling.
min_val (float) : : float : minimum value of the scaled range. Default is 0.0.
max_val (float) : : float : maximum value of the scaled range. Default is 1.0.
empiric_min (float) : : float : user-defined minimum value of the input data. This means that the output could exceed the `min_val` bound if there is data in `x` lesser than `empiric_min`. If na, it's calculated from `x` and `lookback_window`.
empiric_max (float) : : float : user-defined maximum value of the input data. This means that the output could exceed the `max_val` bound if there is data in `x` greater than `empiric_max`. If na, it's calculated from `x` and `lookback_window`.
empiric_mid (float) : : float : user-defined midpoint value of the input data. If na, it's calculated from `empiric_min` and `empiric_max`.
Returns: rescaled series
log(x, base)
Applies logarithmic transformation to a value, base can be user-defined.
Parameters:
x (float) : : floating point value to transform
base (float) : : logarithmic base, must be greater than 0
Returns: logarithm of the value to the given base, if x <= 0, returns logarithm of 1 to the given base
exp(x, base)
Applies exponential transformation to a value, base can be user-defined.
Parameters:
x (float) : : floating point value to transform
base (float) : : base of the exponentiation, must be greater than 0
Returns: the result of raising the base to the power of the value
power(x, exponent)
Applies power transformation to a value, exponent can be user-defined.
Parameters:
x (float) : : floating point value to transform
exponent (float) : : exponent for the transformation
Returns: the value raised to the given exponent, preserving the sign of the original value
tanh(x, scale)
The hyperbolic tangent is the ratio of the hyperbolic sine and hyperbolic cosine. It limits an output to a range of −1 to 1.
Parameters:
x (float) : : floating point series
scale (float)
sigmoid(x, scale, offset)
Applies the sigmoid function to a series.
Parameters:
x (float) : : floating point series to transform
scale (float) : : scaling factor for the sigmoid function
offset (float) : : offset for the sigmoid function
Returns: transformed series using the sigmoid function
sigmoid_double(x, scale, offset)
Applies a double sigmoid function to a series, handling positive and negative values differently.
Parameters:
x (float) : : floating point series to transform
scale (float) : : scaling factor for the sigmoid function
offset (float) : : offset for the sigmoid function
Returns: transformed series using the double sigmoid function
logistic_decay(a, b, c, t)
Calculates logistic decay based on given parameters.
Parameters:
a (float) : : parameter affecting the steepness of the curve
b (float) : : parameter affecting the direction of the decay
c (float) : : the upper bound of the function's output
t (float) : : time variable
Returns: value of the logistic decay function at time t

EC_2025_Q4_ENLibrary "EC_2025_Q4_EN"
output2025()
Returns the list of events during the period.
Returns: array: (week1,week2, ... week_n)
week_n= ;;; ...
Where: is expressed as date + characteristics: YYYY,MM,DD,hh,mm,ss,x,y,z
x impact in numbers
y event name in numbers
z currency in numbers
name2025()
Returns the list of event names during the period.
Returns: array: (week1,week2, ... week_n)
week_n= ;; ...
Where: is expressed as: index, name
index: related to event name y
name event: event name related to y text
impact2025()
Returns the list of impact names during the period.
Returns: array: (week1,week2, ... week_n)
week_n= ;; ...
Where: is expressed as: index, impact
index: related to impact name x
impact: impact name related to x text
currency2025()
Returns the list of currencies during the period.
Returns: array: (week1,week2, ... week_n)
week_n= ;; ...
Where: is expressed as: index, currency
index: related to currency name z
currency: currency name related to z text

EC_2025_Q3_ENLibrary "EC_2025_Q3_EN"
output2025()
Returns the list of events during the period.
Returns: array: (week1,week2, ... week_n)
week_n= ;;; ...
Where: is expressed as date + characteristics: YYYY,MM,DD,hh,mm,ss,x,y,z
x impact in numbers
y event name in numbers
z currency in numbers
name2025()
Returns the list of event names during the period.
Returns: array: (week1,week2, ... week_n)
week_n= ;; ...
Where: is expressed as: index, name
index: related to event name y
name event: event name related to y text
impact2025()
Returns the list of impact names during the period.
Returns: array: (week1,week2, ... week_n)
week_n= ;; ...
Where: is expressed as: index, impact
index: related to impact name x
impact: impact name related to x text
currency2025()
Returns the list of currencies during the period.
Returns: array: (week1,week2, ... week_n)
week_n= ;; ...
Where: is expressed as: index, currency
index: related to currency name z
currency: currency name related to z text

EC_2025_Q2_ENLibrary "EC_2025_Q2_EN"
output2025()
Returns the list of events during the period.
Returns: array: (week1,week2, ... week_n)
week_n= ;;; ...
Where: is expressed as date + characteristics: YYYY,MM,DD,hh,mm,ss,x,y,z
x impact in numbers
y event name in numbers
z currency in numbers
name2025()
Returns the list of event names during the period.
Returns: array: (week1,week2, ... week_n)
week_n= ;; ...
Where: is expressed as: index, name
index: related to event name y
name event: event name related to y text
impact2025()
Returns the list of impact names during the period.
Returns: array: (week1,week2, ... week_n)
week_n= ;; ...
Where: is expressed as: index, impact
index: related to impact name x
impact: impact name related to x text
currency2025()
Returns the list of currencies during the period.
Returns: array: (week1,week2, ... week_n)
week_n= ;; ...
Where: is expressed as: index, currency
index: related to currency name z
currency: currency name related to z text

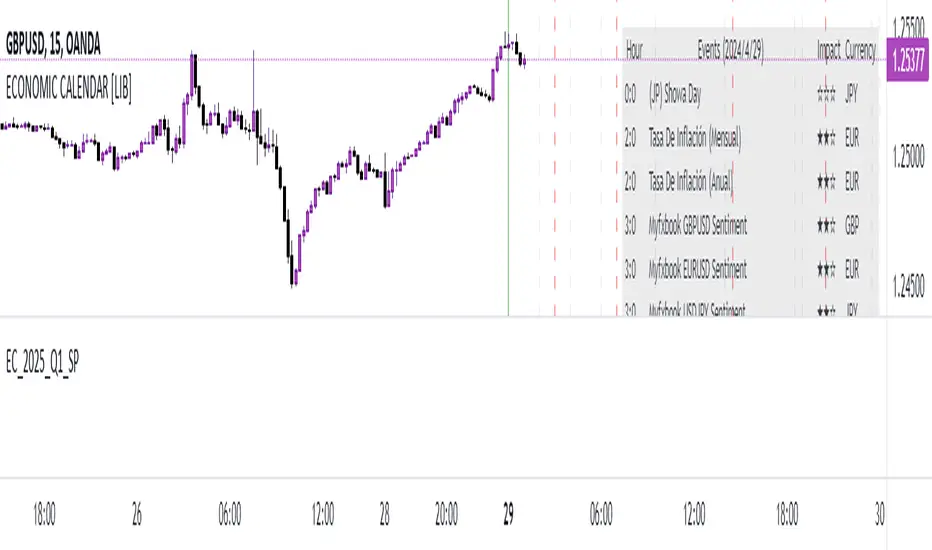
EC_2025_Q1_ENLibrary "EC_2025_Q1_EN"
output2025()
Returns the list of events during the period.
Returns: array: (week1,week2, ... week_n)
week_n= ;;; ...
Where: is expressed as date + characteristics: YYYY,MM,DD,hh,mm,ss,x,y,z
x impact in numbers
y event name in numbers
z currency in numbers
name2025()
Returns the list of event names during the period.
Returns: array: (week1,week2, ... week_n)
week_n= ;; ...
Where: is expressed as: index, name
index: related to event name y
name event: event name related to y text
impact2025()
Returns the list of impact names during the period.
Returns: array: (week1,week2, ... week_n)
week_n= ;; ...
Where: is expressed as: index, impact
index: related to impact name x
impact: impact name related to x text
currency2025()
Returns the list of currencies during the period.
Returns: array: (week1,week2, ... week_n)
week_n= ;; ...
Where: is expressed as: index, currency
index: related to currency name z
currency: currency name related to z text

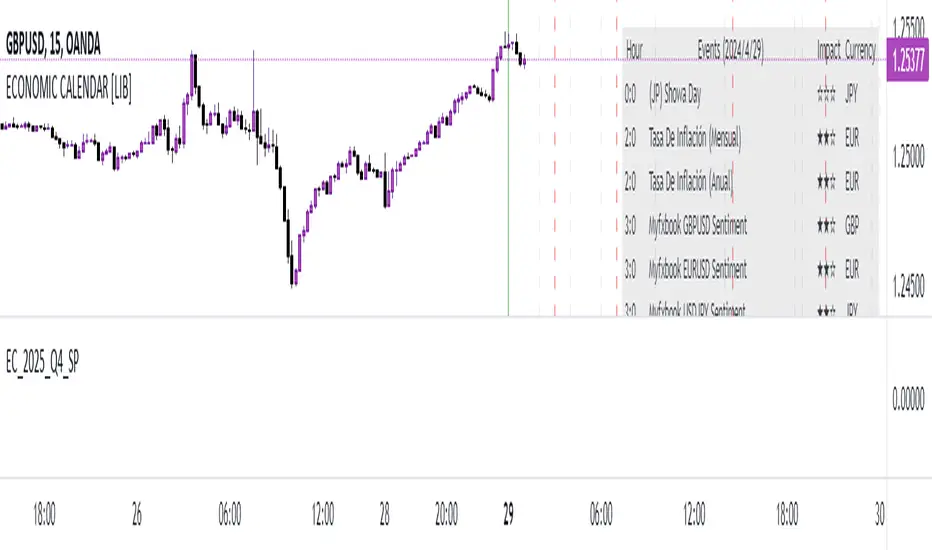
EC_2025_Q4_SPLibrary "EC_2025_Q4_SP"
output2025()
Returns the list of events during the period.
Returns: array: (week1,week2, ... week_n)
week_n= ;;; ...
Where: is expressed as date + characteristics: YYYY,MM,DD,hh,mm,ss,x,y,z
x impact in numbers
y event name in numbers
z currency in numbers
name2025()
Returns the list of event names during the period.
Returns: array: (week1,week2, ... week_n)
week_n= ;; ...
Where: is expressed as: index, name
index: related to event name y
name event: event name related to y text
impact2025()
Returns the list of impact names during the period.
Returns: array: (week1,week2, ... week_n)
week_n= ;; ...
Where: is expressed as: index, impact
index: related to impact name x
impact: impact name related to x text
currency2025()
Returns the list of currencies during the period.
Returns: array: (week1,week2, ... week_n)
week_n= ;; ...
Where: is expressed as: index, currency
index: related to currency name z
currency: currency name related to z text
EC_2025_Q3_SPLibrary "EC_2025_Q3_SP"
output2025()
Returns the list of events during the period.
Returns: array: (week1,week2, ... week_n)
week_n= ;;; ...
Where: is expressed as date + characteristics: YYYY,MM,DD,hh,mm,ss,x,y,z
x impact in numbers
y event name in numbers
z currency in numbers
name2025()
Returns the list of event names during the period.
Returns: array: (week1,week2, ... week_n)
week_n= ;; ...
Where: is expressed as: index, name
index: related to event name y
name event: event name related to y text
impact2025()
Returns the list of impact names during the period.
Returns: array: (week1,week2, ... week_n)
week_n= ;; ...
Where: is expressed as: index, impact
index: related to impact name x
impact: impact name related to x text
currency2025()
Returns the list of currencies during the period.
Returns: array: (week1,week2, ... week_n)
week_n= ;; ...
Where: is expressed as: index, currency
index: related to currency name z
currency: currency name related to z text

EC_2025_Q2_SPLibrary "EC_2025_Q2_SP"
output2025()
Returns the list of events during the period.
Returns: array: (week1,week2, ... week_n)
week_n= ;;; ...
Where: is expressed as date + characteristics: YYYY,MM,DD,hh,mm,ss,x,y,z
x impact in numbers
y event name in numbers
z currency in numbers
name2025()
Returns the list of event names during the period.
Returns: array: (week1,week2, ... week_n)
week_n= ;; ...
Where: is expressed as: index, name
index: related to event name y
name event: event name related to y text
impact2025()
Returns the list of impact names during the period.
Returns: array: (week1,week2, ... week_n)
week_n= ;; ...
Where: is expressed as: index, impact
index: related to impact name x
impact: impact name related to x text
currency2025()
Returns the list of currencies during the period.
Returns: array: (week1,week2, ... week_n)
week_n= ;; ...
Where: is expressed as: index, currency
index: related to currency name z
currency: currency name related to z text

EC_2025_Q1_SPLibrary "EC_2025_Q1_SP"
output2025()
Returns the list of events during the period.
Returns: array: (week1,week2, ... week_n)
week_n= ;;; ...
Where: is expressed as date + characteristics: YYYY,MM,DD,hh,mm,ss,x,y,z
x impact in numbers
y event name in numbers
z currency in numbers
name2025()
Returns the list of event names during the period.
Returns: array: (week1,week2, ... week_n)
week_n= ;; ...
Where: is expressed as: index, name
index: related to event name y
name event: event name related to y text
impact2025()
Returns the list of impact names during the period.
Returns: array: (week1,week2, ... week_n)
week_n= ;; ...
Where: is expressed as: index, impact
index: related to impact name x
impact: impact name related to x text
currency2025()
Returns the list of currencies during the period.
Returns: array: (week1,week2, ... week_n)
week_n= ;; ...
Where: is expressed as: index, currency
index: related to currency name z
currency: currency name related to z text
EC_2024_Q4_SPLibrary "EC_2024_Q4_SP"
output2024()
Returns the list of events during the period.
Returns: array: (week1,week2, ... week_n)
week_n= ;;; ...
Where: is expressed as date + characteristics: YYYY,MM,DD,hh,mm,ss,x,y,z
x impact in numbers
y event name in numbers
z currency in numbers
name2024()
Returns the list of event names during the period.
Returns: array: (week1,week2, ... week_n)
week_n= ;; ...
Where: is expressed as: index, name
index: related to event name y
name event: event name related to y text
impact2024()
Returns the list of impact names during the period.
Returns: array: (week1,week2, ... week_n)
week_n= ;; ...
Where: is expressed as: index, impact
index: related to impact name x
impact: impact name related to x text
currency2024()
Returns the list of currencies during the period.
Returns: array: (week1,week2, ... week_n)
week_n= ;; ...
Where: is expressed as: index, currency
index: related to currency name z
currency: currency name related to z text

EC_2024_Q3_SPLibrary "EC_2024_Q3_SP"
output2024()
Returns the list of events during the period.
Returns: array: (week1,week2, ... week_n)
week_n= ;;; ...
Where: is expressed as date + characteristics: YYYY,MM,DD,hh,mm,ss,x,y,z
x impact in numbers
y event name in numbers
z currency in numbers
name2024()
Returns the list of event names during the period.
Returns: array: (week1,week2, ... week_n)
week_n= ;; ...
Where: is expressed as: index, name
index: related to event name y
name event: event name related to y text
impact2024()
Returns the list of impact names during the period.
Returns: array: (week1,week2, ... week_n)
week_n= ;; ...
Where: is expressed as: index, impact
index: related to impact name x
impact: impact name related to x text
currency2024()
Returns the list of currencies during the period.
Returns: array: (week1,week2, ... week_n)
week_n= ;; ...
Where: is expressed as: index, currency
index: related to currency name z
currency: currency name related to z text

EC_2024_Q4_ENLibrary "EC_2024_Q4_EN"
output2024()
Returns the list of events during the period.
Returns: array: (week1,week2, ... week_n)
week_n= ;;; ...
Where: is expressed as date + characteristics: YYYY,MM,DD,hh,mm,ss,x,y,z
x impact in numbers
y event name in numbers
z currency in numbers
name2024()
Returns the list of event names during the period.
Returns: array: (week1,week2, ... week_n)
week_n= ;; ...
Where: is expressed as: index, name
index: related to event name y
name event: event name related to y text
impact2024()
Returns the list of impact names during the period.
Returns: array: (week1,week2, ... week_n)
week_n= ;; ...
Where: is expressed as: index, impact
index: related to impact name x
impact: impact name related to x text
currency2024()
Returns the list of currencies during the period.
Returns: array: (week1,week2, ... week_n)
week_n= ;; ...
Where: is expressed as: index, currency
index: related to currency name z
currency: currency name related to z text

EC_2024_Q3_ENLibrary "EC_2024_Q3_EN"
output2024()
Returns the list of events during the period.
Returns: array: (week1,week2, ... week_n)
week_n= ;;; ...
Where: is expressed as date + characteristics: YYYY,MM,DD,hh,mm,ss,x,y,z
x impact in numbers
y event name in numbers
z currency in numbers
name2024()
Returns the list of event names during the period.
Returns: array: (week1,week2, ... week_n)
week_n= ;; ...
Where: is expressed as: index, name
index: related to event name y
name event: event name related to y text
impact2024()
Returns the list of impact names during the period.
Returns: array: (week1,week2, ... week_n)
week_n= ;; ...
Where: is expressed as: index, impact
index: related to impact name x
impact: impact name related to x text
currency2024()
Returns the list of currencies during the period.
Returns: array: (week1,week2, ... week_n)
week_n= ;; ...
Where: is expressed as: index, currency
index: related to currency name z
currency: currency name related to z text
EC_2024_Q2_ENLibrary "EC_2024_Q2_EN"
output2024()
Returns the list of events during the period.
Returns: array: (week1,week2, ... week_n)
week_n= ;;; ...
Where: is expressed as date + characteristics: YYYY,MM,DD,hh,mm,ss,x,y,z
x impact in numbers
y event name in numbers
z currency in numbers
name2024()
Returns the list of event names during the period.
Returns: array: (week1,week2, ... week_n)
week_n= ;; ...
Where: is expressed as: index, name
index: related to event name y
name event: event name related to y text
impact2024()
Returns the list of impact names during the period.
Returns: array: (week1,week2, ... week_n)
week_n= ;; ...
Where: is expressed as: index, impact
index: related to impact name x
impact: impact name related to x text
currency2024()
Returns the list of currencies during the period.
Returns: array: (week1,week2, ... week_n)
week_n= ;; ...
Where: is expressed as: index, currency
index: related to currency name z
currency: currency name related to z text
EC_2024_Q2_SPLibrary "EC_2024_Q2_SP"
output2024()
Returns the list of events during the period.
Returns: array: (week1,week2, ... week_n)
week_n= ;;; ...
Where: is expressed as date + characteristics: YYYY,MM,DD,hh,mm,ss,x,y,z
x impact in numbers
y event name in numbers
z currency in numbers
name2024()
Returns the list of event names during the period.
Returns: array: (week1,week2, ... week_n)
week_n= ;; ...
Where: is expressed as: index, name
index: related to event name y
name event: event name related to y text
impact2024()
Returns the list of impact names during the period.
Returns: array: (week1,week2, ... week_n)
week_n= ;; ...
Where: is expressed as: index, impact
index: related to impact name x
impact: impact name related to x text
currency2024()
Returns the list of currencies during the period.
Returns: array: (week1,week2, ... week_n)
week_n= ;; ...
Where: is expressed as: index, currency
index: related to currency name z
currency: currency name related to z text

EC_2024_Q1_SPLibrary "EC_2024_Q1_SP"
output2024()
Returns the list of events during the period.
Returns: array: (week1,week2, ... week_n)
week_n= ;;; ...
Where: is expressed as date + characteristics: YYYY,MM,DD,hh,mm,ss,x,y,z
x impact in numbers
y event name in numbers
z currency in numbers
name2024()
Returns the list of event names during the period.
Returns: array: (week1,week2, ... week_n)
week_n= ;; ...
Where: is expressed as: index, name
index: related to event name y
name event: event name related to y text
impact2024()
Returns the list of impact names during the period.
Returns: array: (week1,week2, ... week_n)
week_n= ;; ...
Where: is expressed as: index, impact
index: related to impact name x
impact: impact name related to x text
currency2024()
Returns the list of currencies during the period.
Returns: array: (week1,week2, ... week_n)
week_n= ;; ...
Where: is expressed as: index, currency
index: related to currency name z
currency: currency name related to z text

EC_2024_Q1_ENLibrary "EC_2024_Q1_EN"
output2024()
Returns the list of events during the period.
Returns: array: (week1,week2, ... week_n)
week_n= ;;; ...
Where: is expressed as date + characteristics: YYYY,MM,DD,hh,mm,ss,x,y,z
x impact in numbers
y event name in numbers
z currency in numbers
name2024()
Returns the list of event names during the period.
Returns: array: (week1,week2, ... week_n)
week_n= ;; ...
Where: is expressed as: index, name
index: related to event name y
name event: event name related to y text
impact2024()
Returns the list of impact names during the period.
Returns: array: (week1,week2, ... week_n)
week_n= ;; ...
Where: is expressed as: index, impact
index: related to impact name x
impact: impact name related to x text
currency2024()
Returns the list of currencies during the period.
Returns: array: (week1,week2, ... week_n)
week_n= ;; ...
Where: is expressed as: index, currency
index: related to currency name z
currency: currency name related to z text

EC_2023_Q4_SPLibrary "EC_2023_Q4_SP"
output2023()
Returns the list of events during the period.
Returns: array: (week1,week2, ... week_n)
week_n= ;;; ...
Where: is expressed as date + characteristics: YYYY,MM,DD,hh,mm,ss,x,y,z
x impact in numbers
y event name in numbers
z currency in numbers
name2023()
Returns the list of event names during the period.
Returns: array: (week1,week2, ... week_n)
week_n= ;; ...
Where: is expressed as: index, name
index: related to event name y
name event: event name related to y text
impact2023()
Returns the list of impact names during the period.
Returns: array: (week1,week2, ... week_n)
week_n= ;; ...
Where: is expressed as: index, impact
index: related to impact name x
impact: impact name related to x text
currency2023()
Returns the list of currencies during the period.
Returns: array: (week1,week2, ... week_n)
week_n= ;; ...
Where: is expressed as: index, currency
index: related to currency name z
currency: currency name related to z text

EC_2023_Q3_SPLibrary "EC_2023_Q3_SP"
output2023()
Returns the list of events during the period.
Returns: array: (week1,week2, ... week_n)
week_n= ;;; ...
Where: is expressed as date + characteristics: YYYY,MM,DD,hh,mm,ss,x,y,z
x impact in numbers
y event name in numbers
z currency in numbers
name2023()
Returns the list of event names during the period.
Returns: array: (week1,week2, ... week_n)
week_n= ;; ...
Where: is expressed as: index, name
index: related to event name y
name event: event name related to y text
impact2023()
Returns the list of impact names during the period.
Returns: array: (week1,week2, ... week_n)
week_n= ;; ...
Where: is expressed as: index, impact
index: related to impact name x
impact: impact name related to x text
currency2023()
Returns the list of currencies during the period.
Returns: array: (week1,week2, ... week_n)
week_n= ;; ...
Where: is expressed as: index, currency
index: related to currency name z
currency: currency name related to z text

EC_2023_Q2_SPLibrary "EC_2023_Q2_SP"
output2023()
Returns the list of events during the period.
Returns: array: (week1,week2, ... week_n)
week_n= ;;; ...
Where: is expressed as date + characteristics: YYYY,MM,DD,hh,mm,ss,x,y,z
x impact in numbers
y event name in numbers
z currency in numbers
name2023()
Returns the list of event names during the period.
Returns: array: (week1,week2, ... week_n)
week_n= ;; ...
Where: is expressed as: index, name
index: related to event name y
name event: event name related to y text
impact2023()
Returns the list of impact names during the period.
Returns: array: (week1,week2, ... week_n)
week_n= ;; ...
Where: is expressed as: index, impact
index: related to impact name x
impact: impact name related to x text
currency2023()
Returns the list of currencies during the period.
Returns: array: (week1,week2, ... week_n)
week_n= ;; ...
Where: is expressed as: index, currency
index: related to currency name z
currency: currency name related to z text

EC_2023_Q1_SPLibrary "EC_2023_Q1_SP"
output2023()
Returns the list of events during the period.
Returns: array: (week1,week2, ... week_n)
week_n= ;;; ...
Where: is expressed as date + characteristics: YYYY,MM,DD,hh,mm,ss,x,y,z
x impact in numbers
y event name in numbers
z currency in numbers
name2023()
Returns the list of event names during the period.
Returns: array: (week1,week2, ... week_n)
week_n= ;; ...
Where: is expressed as: index, name
index: related to event name y
name event: event name related to y text
impact2023()
Returns the list of impact names during the period.
Returns: array: (week1,week2, ... week_n)
week_n= ;; ...
Where: is expressed as: index, impact
index: related to impact name x
impact: impact name related to x text
currency2023()
Returns the list of currencies during the period.
Returns: array: (week1,week2, ... week_n)
week_n= ;; ...
Where: is expressed as: index, currency
index: related to currency name z
currency: currency name related to z text

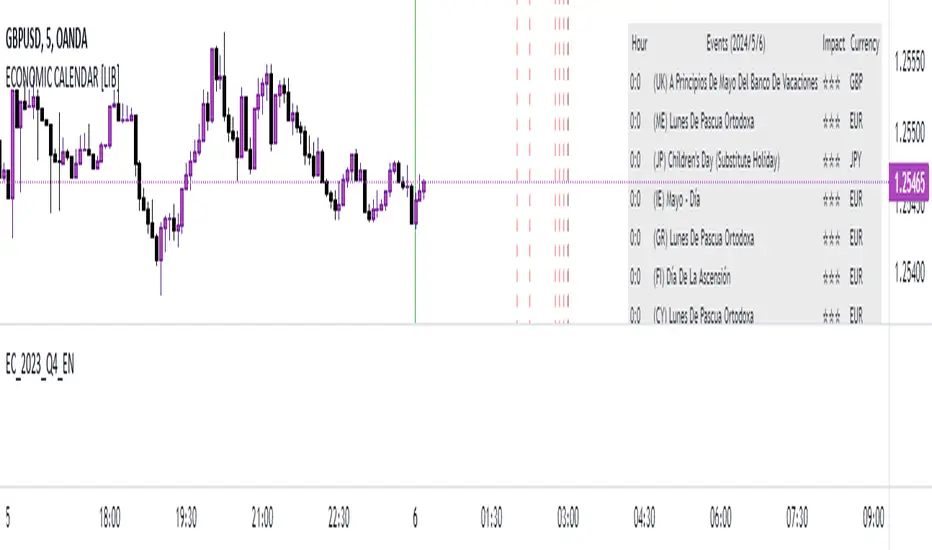
EC_2023_Q4_ENLibrary "EC_2023_Q4_EN"
output2023()
Returns the list of events during the period.
Returns: array: (week1,week2, ... week_n)
week_n= ;;; ...
Where: is expressed as date + characteristics: YYYY,MM,DD,hh,mm,ss,x,y,z
x impact in numbers
y event name in numbers
z currency in numbers
name2023()
Returns the list of event names during the period.
Returns: array: (week1,week2, ... week_n)
week_n= ;; ...
Where: is expressed as: index, name
index: related to event name y
name event: event name related to y text
impact2023()
Returns the list of impact names during the period.
Returns: array: (week1,week2, ... week_n)
week_n= ;; ...
Where: is expressed as: index, impact
index: related to impact name x
impact: impact name related to x text
currency2023()
Returns the list of currencies during the period.
Returns: array: (week1,week2, ... week_n)
week_n= ;; ...
Where: is expressed as: index, currency
index: related to currency name z
currency: currency name related to z text