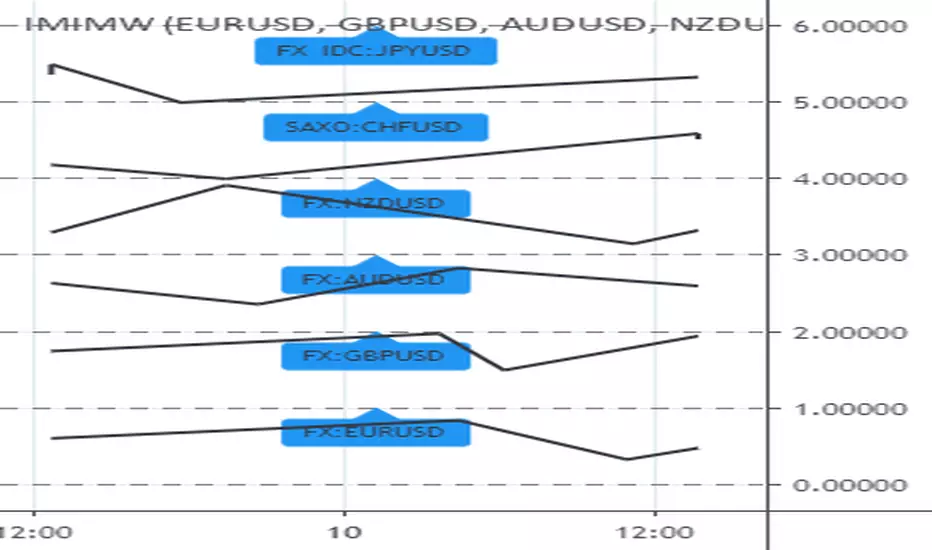
Ultimate Major Contextual Dashboard (Multi-Asset)Overview : The Ultimate Major Dashboard is a performance-optimized market overview tool designed to provide a consolidated snapshot of the 7 major Forex pairs and Gold. It aggregates correlation, trend, momentum, and volatility data into a single, clean table, allowing users to view broader market context without switching charts.
Technical Logic & Components : This indicator utilizes a modular function to analyze EURUSD, GBPUSD, USDJPY, USDCHF, AUDUSD, USDCAD, NZDUSD, and XAUUSD across four key dimensions:
Intermarket Correlation (Pearson Coefficient): Uses ta.correlation() to compare each asset against the symbol currently on your main chart.
Logic: Values above 0.7 (Dark Green) suggest a strong positive relationship, while values below -0.7 (Dark Red) suggest inverse behavior. This is calculated over a rolling 50-period window to balance stability with current market sensitivity.
Trend Bias (EMA-200): Evaluates the long-term trend by checking price position relative to the 200-period Exponential Moving Average.
Visuals: An upward arrow (⬆) indicates price is above the EMA; a downward arrow (⬇) indicates it is below.
Momentum (RSI-14): Calculates the Relative Strength Index. The dashboard automatically highlights readings above 70 (OB) or below 30 (OS) to help identify potential momentum extremes.
Volatility (ATR-14): Displays the Average True Range as a reference for the current active range of each market, helping users compare volatility levels across the majors.
How to Interpret the Dashboard
Asset Alignment: Correlation values help identify when pairs are moving in "unison" versus when a specific currency is diverging from the group.
Directional Context: Combining the Trend (EMA) and Momentum (RSI) columns provides a quick view of whether a market is trending strongly or reaching an exhaustion point.
Volatility Benchmarking: The ATR values offer perspective on which pairs are currently the most active, assisting in market comparison based on volatility preference.
Data Handling & Customization
Multi-Symbol Sync: Data is fetched using request.security(). The calculations are synchronized with the chart's current bar state for real-time accuracy.
Dynamic TF: Users can select the analysis timeframe (60, 240, D, W) via the settings menu.
Flexibility: The dashboard position can be toggled between all four corners of the chart to avoid overlapping with price action.
Disclaimer
This tool is provided for analytical and educational purposes only. It does not generate trading signals and should not be considered financial advice.
Asset

Index Construction Tool🙏🏻 The most natural mathematical way to construct an index || portfolio, based on contraharmonic mean || contraharmonic weighting. If you currently traded assets do not satisfy you, why not make your own ones?
Contraharmonic mean is literally a weighted mean where each value is weighted by itself.
...
Now let me explain to you why contraharmonic weighting is really so fundamental in two ways: observation how the industry (prolly unknowably) converged to this method, and the real mathematical explanation why things are this way.
How it works in the industry.
In indexes like TVC:SPX or TVC:DJI the individual components (stocks) are weighted by market capitalization. This market cap is made of two components: number of shares outstanding and the actual price of the stock. While the number of shares holds the same over really long periods of time and changes rarely by corporate actions , the prices change all the time, so market cap is in fact almost purely based on prices itself. So when they weight index legs by market cap, it really means they weight it by stock prices. That’s the observation: even tho I never dem saying they do contraharmonic weighting, that’s what happens in reality.
Natural explanation
Now the main part: how the universe works. If you build a logical sequence of how information ‘gradually’ combines, you have this:
Suppose you have the one last datapoint of each of 4 different assets;
The next logical step is to combine these datapoints somehow in pairs. Pairs are created only as ratios , this reveals relationships between components, this is the only step where these fundamental operations are meaningful, they lose meaning with 3+ components. This way we will have 16 pairs: 4 of them would be 1s, 6 real ratios, and 6 more inverted ratios of these;
Then the next logical step is to combine all the pairs (not the initial single assets) all together. Naturally this is done via matrices, by constructing a 4x4 design matrix where each cell will be one of these 16 pairs. That matrix will have ones in the main diagonal (because these would be smth like ES/ES, NQ/NQ etc). Other cells will be actual ratios, like ES/NQ, RTY/YM etc;
Then the native way to compress and summarize all this structure is to do eigendecomposition . The only eigenvector that would be meaningful in this case is the principal eigenvector, and its loadings would be what we were hunting for. We can multiply each asset datapoint by corresponding loading, sum them up and have one single index value, what we were aiming for;
Now the main catch: turns out using these principal eigenvector loadings mathematically is Exactly the same as simply calculating contraharmonic weights of those 4 initial assets. We’re done here.
For the sceptics, no other way of constructing the design matrix other than with ratios would result in another type of a defined mean. Filling that design matrix with ratios Is the only way to obtain a meaningful defined mean, that would also work with negative numbers. I’m skipping a couple of details there tbh, but they don’t really matter (we don’t need log-space, and anyways the idea holds even then). But the core idea is this: only contraharmonic mean emerges there, no other mean ever does.
Finally, how to use the thing:
Good news we don't use contraharmonic mean itself because we need an internals of it: actual weights of components that make this contraharmonic mean, (so we can follow it with our position sizes). This actually allows us to also use these weights but not for addition, but for subtraction. So, the script has 2 modes (examples would follow):
Addition: the main one, allows you to make indexes, portfolios, baskets, groups, whatever you call it. The script will simply sum the weighted legs;
Subtraction: allows you to make spreads, residual spreads etc. Important: the script will subtract all the symbols From the first one. So if the first we have 3 symbols: YM, ES, RTY, the script will do YM - ES - RTY, weights would be applied to each.
At the top tight corner of the script you will see a lil table with symbols and corresponding weights you wanna trade: these are ‘already’ adjusted for point value of each leg, you don’t need to do anything, only scale them all together to meet your risk profile.
Symbols have to be added the way the default ones are added, one line : one symbol.
Pls explore the script’s Style setting:
You can pick a visualization method you like ! including overlays on the main chart pane !
Script also outputs inferred volume delta, inferred volume and inferred tick count calculated with the same method. You can use them in further calculations.
...
Examples of how you can use it
^^ Purple dotted line: overlay from ICT script, turned on in Style settings, the contraharmonic mean itself calculated from the same assets that are on the chart: CME_MINI:RTY1! , CME_MINI:ES1! , CME_MINI:NQ1! , CBOT_MINI:YM1!
^^ precious metals residual spread ( COMEX:GC1! COMEX:SI1! NYMEX:PL1! )
^^ CBOT:ZC1! vs CBOT:ZW1! grain spread
^^ BDI (Bid Dope Index), constructed from: NYSE:MO , NYSE:TPB , NYSE:DGX , NASDAQ:JAZZ , NYSE:IIPR , NASDAQ:CRON , OTC:CURLF , OTC:TCNNF
^^ NYMEX:CL1! & ICEEUR:BRN1! basket
^^ resulting index price, inferred volume delta, inferred volume and inferred tick count of CME_MINI:NQ1! vs CME_MINI:ES1! spread
...
Synthetic assets is the whole new Universe you can jump into and never look back, if this is your way
...
∞

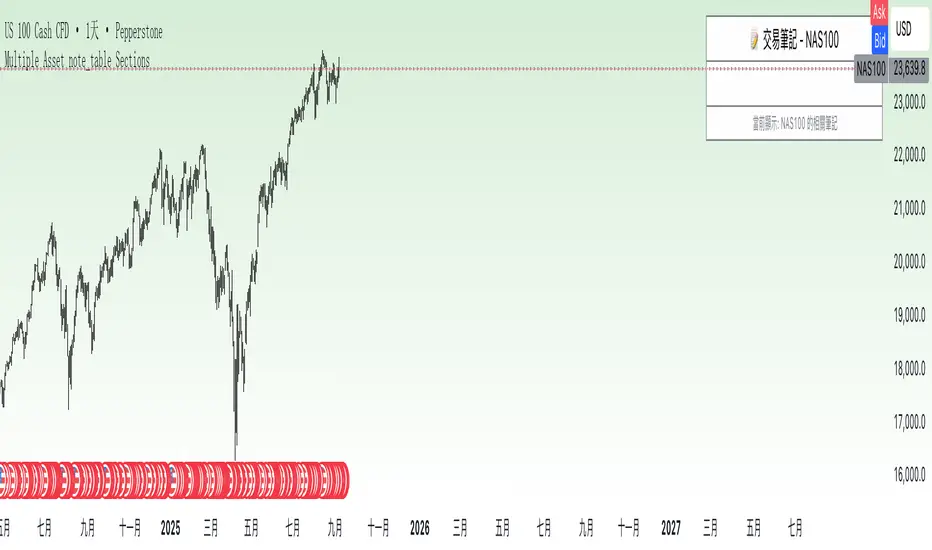
Multiple Asset note_table Sections### Features
- **Expanded to 10 independent Sections**: Each Section has a title, content, and associated asset
- **Asset-based filtering**: Section only displays when the Section's asset name is empty or matches the current chart asset
- **Empty asset setting retained**: If Section asset name is left blank, that Section will display across all assets
- **Automatic display of current asset**: Current asset name is automatically shown in the header and footer
### Usage Instructions
1. Each Section can be assigned a specific asset name, such as "BTCUSDT", "ETHUSDT", etc.
2. A Section will only display when the current chart asset matches the asset specified for that Section
3. If you want a Section to display across all assets, simply leave the asset name blank for that Section
4. Each Section has independent title and content that can be customized as needed
5. When switching to different trading instruments, the indicator automatically displays notes relevant to the current instrument
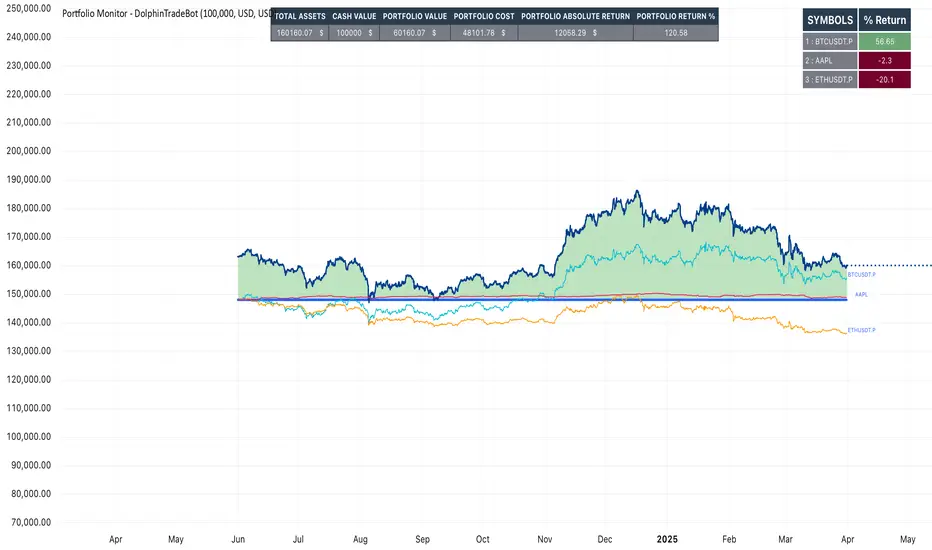
Portfolio Monitor - DolphinTradeBot1️⃣ Overview
▪️This indicator unifies the value of all your investments—whether stocks, currencies, or cryptocurrencies—in your chosen currency. This tool not only provides a clear snapshot of your overall portfolio performance but also highlights the individual growth of each asset with intuitive visualizations and an easy-to-understand performance report.
2️⃣ What sets this indicator apart
▪️is its ability to convert values from various currency pairs into any currency you choose. This means you can monitor your portfolio's performance against any currency pair you prefer, offering a flexible and comprehensive view of your investments.
3️⃣ How Is It Work ?
🔍The indicator can be analyzed under two main categories: visual representations and tables.
1- Visual representations ;
The indicator includes three different types of lines:
1. 1 - Reference Line → This represents the cost of all assets we hold, based on the selected date.
1. 2 - Total Assets Line → Displays the real-time value of all assets in our possession, including cash value, in the selected trading pair.
The area between the reference line is filled with green and red. The section above the reference line is represented in green, while the section below is shown in red.
1. 3 - Performance Lines → These visualize the performance of the assets, starting from the reference line and taking into account their weights in the portfolio. (Note: The lines are scaled for visualization purposes, so their absolute values should not be considered.)
"The names of the lines are shown in the image below."⤵️
2- Tables
The indicator includes three different types of tables:
2. 1 - Analysis Table : It provides a superficial overview of wallet statistics and values.
▪️TOTAL ASSETS → The current equivalent of all assets in the target currency
▪️CASH VALUE → The current value of the amount "Cash Value", in the target currency.
▪️PORTFOLIO VALUE → The total value of assets excluding Cash, in the target currency.
▪️POSTFOLIO COST → The cost of assets excluding Cash, in the target currency.
▪️PORTFOLIO ABSOLUTE RETURN → It shows the profit or loss relative to the cost of assets
▪️PORTFOLIO RETURN % →It shows the profit or loss relative to the cost of assets on a percentage basis
2. 2 - Performance Table : It displays the names of assets excluding Cash and their profit amounts, sorted from highest to lowest profit. If "Show as Percentage" is selected in the settings, it shows the percentage profit or loss relative to the cost. Profits are represented in green, while losses are represented in red.
"You can see the visual showing the tables below"⤵️
4️⃣How to Use ?
1- Choose the date on which the visualization will begin (📌The start date only affects the exchange rate used for calculating the reference line in the target currency.)
2- If you have cash holdings, enter the amount and specify the currency.
3- Select the currency in which your portfolio value will be displayed.(Default value is USD)
4- To set up your portfolio;
SYMBOLS - QUANTITY - PURCHASE PRICE
Enter the symbols of your assets - the number of units you hold - and their cost levels.
5- If you have cash, be sure to include your cash balance. If you also hold other currencies, enter them as separate assets with their corresponding quantities and purchase prices.
6- If you want to see the percentage returns of the assets in the performance table relative to their cost, select the "Show as Percent" option.
7- If you want to see the performance visuals of the assets, click on the "Show Asset Performance" option.
You can find an image of the settings section where the numbers above are used as references below.⤵️
📌 NOTE → By default, a few assets and their values have been pre-added in the initial settings. This is to ensure that you don’t see an empty screen when adding the indicator to the chart. Please remember to enter your own assets and values. The default settings are only provided as an example.
Asset Allocation CalculatorOverview
This script is a tool that automatically calculates asset allocation for your investment portfolio. Users can set the weight of multiple assets and monitor the portfolio value in real time based on price fluctuations.
Key Features
Supports input of asset allocation percentages
Dynamic allocation calculation based on real-time price data
Automatically calculates allocated amounts for each asset based on the total investment amount
User-friendly interface with intuitive visual feedback
Settings
Total Capital : Enter the total capital, including the value of assets.
Quantity rounding : Using the rounding function may cause the target allocation to exceed 100%.
Tickers, Weight, Holdings :
To retrieve accurate asset prices, specify both the exchange and the ticker.
If you want to include cash in your portfolio, use $.
Ensure that the total allocation sums to 100%.
Refer to the pre-filled example for the correct format.
Table Settings : You can adjust the table's position, height, font size, and background color.
How to Use
By buying or selling the quantity shown in the Buy column, you can continuously maintain your target allocation.
Hold - Current holdings
Buy - Quantity to buy or sell to reach the target allocation
Target - Quantity aimed for after buying or selling
Caution
It can only calculate for a single currency, so do not mix multiple currency markets.
자산 배분 계산기
소개
이 스크립트는 투자 포트폴리오의 자산 배분을 자동으로 계산해주는 도구입니다. 사용자는 여러 자산의 비중을 설정할 수 있으며, 가격 변동에 따라 포트폴리오 가치를 실시간으로 모니터링할 수 있습니다.
주요 기능
자산 배분 비율 입력 지원
실시간 가격 데이터를 기반으로 한 동적 배분 계산
총 투자 금액을 기준으로 각 자산에 할당된 금액 자동 계산
직관적인 시각적 피드백을 제공하는 사용자 친화적인 인터페이스
설정
Total Capital : 자산 가치를 포함한 총 자본금을 입력하세요.
Quantity rounding : 반올림 기능을 사용하면 목표 비중이 100%를 초과할 수 있습니다.
Tickers, Weight, Holdings :
정확한 자산 가격을 불러오기 위해 거래소와 티커를 함께 입력하세요.
포트폴리오에 현금을 포함하려면 '$'를 사용하세요.
비중 합계가 반드시 100%가 되도록 설정하세요.
예제 형식을 참고하여 올바르게 입력하세요.
한국(원화) 시장을 위한 입력 예시입니다.
KRX:360750, 17.5, 100
KRX:310960, 17.5, 120
KRX:148070, 25, 20
KRX:305080, 25, 10
KRX:139320, 10, 150
UPBIT:BTCKRW, 5, 0.002
$,0,5000000
Table Settings : 테이블의 위치, 높이, 글자 크기 및 배경색을 조정할 수 있습니다.
사용 방법
Buy 열에 표시된 수량만큼 매수 또는 매도하면 목표 비중을 지속적으로 유지할 수 있습니다.
Hold - 현재 보유 수량
Buy - 목표 비중을 맞추기 위해 매수 또는 매도해야 하는 수량
Target - 매수, 매도 후 목표로 하는 수량
주의
한 가지 통화로만 계산할 수 있으니 여러 통화 시장을 혼용하지 마세요.

Multi-Asset & TF RSI
Multi-Asset & TF RSI
This indicator allows you to compare the Relative Strength Index (RSI) values of two different assets across multiple timeframes in a single pane. It’s ideal for traders who wish to monitor momentum across different markets or instruments simultaneously.
Key Features:
Primary Asset RSI:
The indicator automatically calculates the RSI for the chart’s asset. You can adjust the timeframe for this asset using a dropdown that offers standard TradingView timeframes, a "Chart" option (which syncs with your current chart timeframe), or a "Custom" option where you can enter any timeframe.
Optional Second Asset RSI:
Enable the “Display Second Asset” option to compare another asset’s RSI. Simply select the symbol (default is “DXY”) and choose its timeframe from an identical dropdown. When enabled, the second asset’s RSI is computed and plotted for easy comparison.
RSI Settings:
Customize the RSI length and choose the data source (e.g., close price) to suit your trading strategy.
Visual Aids:
Overbought (70) and oversold (30) levels are clearly marked, along with a midline at 50. These visual cues help you quickly assess market conditions.
Asset Information Table:
A dynamic table at the top of the pane displays the symbols being analysed – the chart’s asset as the “1st” asset and, if enabled, the second asset as the “2nd.”
How to Use:
Apply the Indicator:
Add the indicator to your chart. By default, it will calculate the RSI for the chart’s current asset using your chart’s timeframe.
Adjust Primary Asset Settings:
Use the “Main Asset Timeframe” dropdown to choose the timeframe for the RSI calculation on the chart asset. Select “Chart” to automatically match your current chart’s timeframe or choose a preset/custom timeframe.
Enable and Configure the Second Asset:
Toggle the “Display Second Asset” option to enable the second asset’s RSI. Select the asset symbol and its desired timeframe using the provided dropdown. The RSI for the second asset will be plotted if enabled.
Monitor the RSI Values:
Observe the plotted RSI lines along with the overbought/oversold levels. Use the table at the top-centre of the pane to verify which asset symbols are being displayed.
This versatile tool is designed to support multi-asset analysis and can be a valuable addition to your technical analysis toolkit. Enjoy enhanced RSI comparison across markets and timeframes!
Happy Trading!

Multi Asset & TF Stochastic
Multi Asset & TF Stochastic
This indicator allows you to compare the stochastic oscillator values of two different assets across multiple timeframes in a single pane. It’s designed for traders who want to analyse the momentum of one asset (by default, the chart’s asset) alongside a second asset of your choice (e.g., comparing EURUSD to the USD Index).
How It Works:
Main Asset:
The indicator automatically uses the chart’s asset for the primary stochastic calculation. You have the option to adjust the timeframe for this asset using a dropdown that includes TradingView’s standard timeframes, a "Chart" option (which automatically uses your chart’s timeframe), or a "Custom" option where you can type in any timeframe.
Second Asset:
You can enable the display of a second asset by toggling the “Display Second Asset” option. Choose the asset symbol (default is “DXY”) and select its timeframe from an identical dropdown. When enabled, the script calculates the stochastic oscillator for the second asset, allowing you to compare its momentum (%K and %D lines) with that of the main asset.
Stochastic Oscillator Settings:
Customize the %K length, the smoothing period for %K, and the smoothing period for %D. Both assets’ stochastic values are calculated using these parameters.
Visual Display:
The indicator plots the %K and %D lines for the main asset in prominent colours. If the second asset is enabled, its %K and %D lines are also plotted in different colours. Additionally, overbought (80) and oversold (20) levels are marked, with a midline at 50, making it easier to gauge market conditions at a glance.
%D line can be toggled off for a cleaner view if required:
Asset Information Table:
A table at the top-centre of the pane displays the active asset symbols—ensuring you always know which assets are being analysed.
How to Use:
Apply the Indicator:
Add the script to your chart. By default, it will use the chart’s current asset and timeframe for the primary stochastic oscillator.
Adjust the Main Asset Settings:
Use the “Main Asset Timeframe” dropdown to select a specific timeframe for the main asset or stick with the “Chart” option for automatic syncing with your current chart.
Enable and Configure the Second Asset (Optional):
Toggle on “Display Second Asset” if you wish to compare another asset. Select the desired symbol and adjust its timeframe using the provided dropdown. Choose “Custom” if you need a timeframe not listed by default.
Review the Plots and Table:
Observe the stochastic %K and %D lines for each asset. The overbought/oversold levels help indicate potential market turning points. Check the table at the top-centre to confirm the asset symbols being displayed.
This versatile tool is ideal for traders who rely on momentum analysis and need to quickly compare the stochastic signals of different markets or instruments. Enjoy seamless multi-asset analysis with complete control over your timeframe settings!

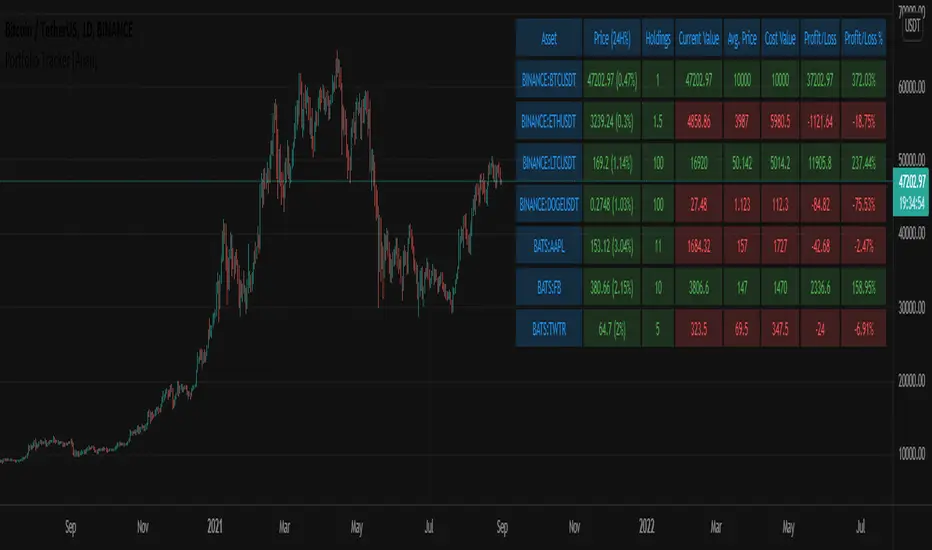
Portfolio Tracker [Anan]█ OVERVIEW
A simple Portfolio Tracker to track your Profit/Loss for any ticker in any market (stock, futures, index, forex, crypto, fund, dr.).
You just need to input (Asset / Quantity / Avg. Buy/Sell Price) and the script will calculate everything.
Also, you can use it for paper trading, or even what-if cases..
█ FEATURES
- Up to 10 positions
- Track your position real-time price and 24H change %
- Calculate your position current value
- Calculate your position cost value
- Calculate Profit/Loss
- Calculate Profit/Loss %
- Change every color in the table as you like.
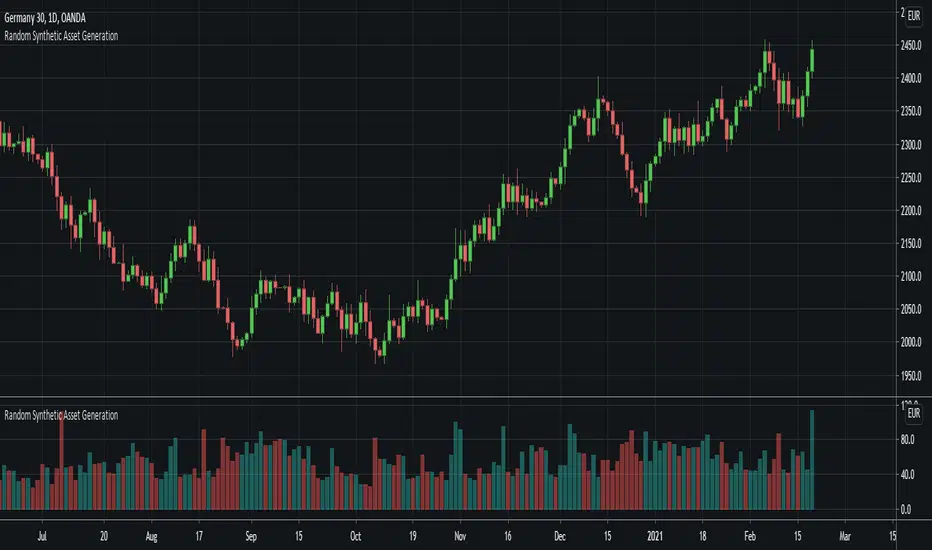
Random Synthetic Asset GenerationThis script generates pseudo-random asset data . Due to the nature of the random generator, it is impossible to use this indicator as input for other indicators because the instance of the script that the indicator is applied to will automatically be different from the instance that is plotted on the chart. Therefore, the idea is to use this script in other scripts (to make it possible to backtest on random data, for example).
The script has four main input parameters.
Random Number Generator Method: It supports two methods for generating the pseudo-random numbers (one by Ricardo Santos and one by Wichmann-Hill).
Seed: You can specify the seed to use. Each unique seed will generate a unique set of pseudo-random data.
Intrabar Volatility: This basically sets how volatile the generated wicks will be (0 = no wicks).
Price Multiplier: This is just a multiplier for the generated price data, so that you can scale up or down the generated price data.
You can also change the colors of the bars.
In addition to this, the indicator also generates random volume. In order to make it possible to show both volume and price, you need to have two identical instances of the indicator. One on the chart, and one in its own panel. Then, go into the Style tab in the indicator settings on the instance in the panel. Untick Up-Candles and Down-Candles boxes, and tick the Volume box.
In a similar manner, you can also plot the true range data and the candle change data as well, by ticking one of those boxes instead.