EDUVEST UTBOT ADJ - Adaptive ATR Trailing StopEDUVEST UTBOT ADJ - Adaptive ATR Trailing Stop with Session-Based Sensitivity
━━━━━━━━━━━━━━━━━━━━━━━━━━━━━━━━━━━━━━━━━━━━━━━━
█ ORIGINALITY
This indicator is an enhanced version of the classic UT Bot concept, featuring automatic session-based ATR sensitivity adjustment. Unlike the original UT Bot which uses a fixed sensitivity value, this version dynamically adapts to different trading sessions (Tokyo, London, New York) and automatically detects asset characteristics to optimize signal generation.
━━━━━━━━━━━━━━━━━━━━━━━━━━━━━━━━━━━━━━━━━━━━━━━━
█ WHAT IT DOES
- Generates BUY and SELL signals based on ATR trailing stop crossovers with a moving average
- Automatically adjusts sensitivity based on current trading session (Tokyo/London/NY)
- Auto-detects asset type and applies optimized parameters for each instrument
- Displays real-time session information and volatility status
- Provides alert functionality with customizable cooldown periods
━━━━━━━━━━━━━━━━━━━━━━━━━━━━━━━━━━━━━━━━━━━━━━━━
█ HOW IT WORKS
【Core Logic: ATR Trailing Stop】
The indicator calculates an ATR-based trailing stop using the formula:
Trailing Stop = Price ± (Sensitivity × ATR)
When price is above the trailing stop and rising, the stop trails below price.
When price is below the trailing stop and falling, the stop trails above price.
【Signal Generation】
- BUY Signal: Price crosses above the trailing stop AND Moving Average crosses above the trailing stop
- SELL Signal: Price crosses below the trailing stop AND Moving Average crosses below the trailing stop
【Session-Based Sensitivity Adjustment】
The indicator adjusts ATR sensitivity based on trading session (JST timezone):
- Tokyo (08:00-15:00): Lower sensitivity (reduced by adjustment value) - typically quieter markets
- London (15:00-23:00): Base sensitivity - moderate volatility
- New York (23:00-08:00): Higher sensitivity (increased by adjustment value) - higher volatility
【Dynamic ATR Adjustment】
When enabled, the indicator compares current ATR to its smoothed average:
- ATR Ratio = Current ATR / SMA(ATR, smoothing period)
- Volatility Multiplier = 1.0 + (Sensitivity × (2.0 - ATR Ratio))
This reduces sensitivity during high volatility (fewer false signals) and increases sensitivity during low volatility (faster response).
【Auto Asset Detection】
The indicator automatically detects the traded instrument and applies optimized parameters:
- Stable pairs (USDJPY, EURUSD, USDCHF): Base sensitivity 1.5-1.8
- Moderate pairs (AUDUSD, USDCAD, EURJPY): Base sensitivity 2.0-2.3
- Volatile pairs (GBPUSD): Base sensitivity 2.8
- Commodities (GOLD/XAUUSD): Base sensitivity 3.5
- Indices (NASDAQ/NAS100): Base sensitivity 4.0
━━━━━━━━━━━━━━━━━━━━━━━━━━━━━━━━━━━━━━━━━━━━━━━━
█ HOW TO USE
【Recommended Settings】
- Timeframe: 15 minutes or higher (15M, 1H, 4H recommended)
- Best performance on: Forex majors, Gold, NASDAQ
- Enable "Auto Asset Detection" for optimized parameters
【Entry Rules】
- BUY: Enter long when green BUY label appears
- SELL: Enter short when pink SELL label appears
【Session Panel】
The top-right panel displays:
- Current trading session (Tokyo/London/NY)
- Volatility status (High Chance/Medium Chance/Caution)
- Mode (AUTO/MANUAL)
【Alert Setup】
1. Enable "Viewer Alert Display" in settings
2. Set cooldown period (default: 15 minutes) to avoid signal spam
3. Create alert with "Any alert() function call" condition
【Important Notes】
- This indicator does not repaint - signals are confirmed at bar close
- Lower timeframes (1M, 5M) may generate excessive signals
- Always use proper risk management and confirm with other analysis
━━━━━━━━━━━━━━━━━━━━━━━━━━━━━━━━━━━━━━━━━━━━━━━━
█ SETTINGS OVERVIEW
🎯 Alert Settings
- Viewer Alert Display: Enable/disable alert labels
- Cooldown Function: Prevent rapid consecutive signals
- Cooldown Time: Minutes between alerts (5-60)
🔧 Dynamic ATR Settings
- Enable Dynamic ATR: Auto-adjust based on volatility
- ATR Period: Calculation period (default: 14)
- ATR Smoothing: Smoothing period for ratio calculation
- Volatility Sensitivity: How much to adjust (0.1-1.0)
🕐 Session ATR Adjustment
- Enable Time Adjustment: Session-based sensitivity
- Show Session Info: Display session panel
📊 Asset Settings
- Auto Asset Detection: Automatically optimize for instrument
- Manual settings available when auto-detection is disabled
━━━━━━━━━━━━━━━━━━━━━━━━━━━━━━━━━━━━━━━━━━━━━━━━
█ CREDITS
Based on the original UT Bot concept by QuantNomad.
Enhanced with session-based adaptation and auto-asset detection by EduVest.
License: Mozilla Public License 2.0
Atr-trailing-stop

MDZ Strategy v4.2 - Multi-factor trend strategyWhat This Strategy Does
MDZ (Momentum Divergence Zones) v4.2 is a trend-following strategy that enters long positions when multiple momentum and trend indicators align. It's designed for swing trading on higher timeframes (2H-4H) and uses ATR-based position management.
The strategy waits for strong trend confirmation before entry, requiring agreement across five different filters. This reduces trade frequency but aims to improve signal quality.
Entry Logic
A long entry triggers when ALL of the following conditions are true:
1. EMA Stack (Trend Structure)
Price > EMA 20 > EMA 50 > EMA 200
This "stacked" alignment indicates a strong established uptrend
2. RSI Filter (Momentum Window)
RSI between 45-75 (default)
Confirms momentum without entering overbought territory
3. ADX Filter (Trend Strength)
ADX > 20 (default)
Ensures the trend has sufficient strength, not a ranging market
4. MACD Confirmation
MACD line above signal line
Histogram increasing (momentum accelerating)
5. Directional Movement
+DI > -DI
Confirms bullish directional pressure
Exit Logic
Positions are managed with ATR-based levels:
ParameterDefaultDescriptionStop Loss2.5 × ATRBelow entry priceTake Profit6.0 × ATRAbove entry priceTrailing Stop2.0 × ATROptional, activates after entry
The default configuration produces a 1:2.4 risk-reward ratio.
Presets
The strategy includes optimized presets based on historical testing:
PresetTimeframeNotes1H Standard1 HourMore frequent signals2H Low DD2 HourConservative settings3H Optimized3 HourBalanced approach4H Swing4 HourWider stops for swing tradesCustomAnyFull manual control
Select "Custom" to adjust all parameters manually.
Inputs Explained
EMAs
Fast EMA (20): Short-term trend
Slow EMA (50): Medium-term trend
Trend EMA (200): Long-term trend filter
RSI
Length: Lookback period (default 14)
Min/Max: Entry window to avoid extremes
ADX
Min ADX: Minimum trend strength threshold
Risk
Stop Loss ATR: Multiplier for stop distance
Take Profit ATR: Multiplier for target distance
Trail ATR: Trailing stop distance (if enabled)
Session (Optional)
Filter entries by time of day
Recommended OFF for 3H+ timeframes
What's Displayed
Info Panel (Top Right)
Current preset
Trend status (Strong/Wait)
ADX, RSI, MACD readings
Position status
Risk-reward ratio
Stats Panel (Top Left)
Net P&L %
Total trades
Win rate
Profit factor
Maximum drawdown
Chart
EMA lines (20 blue, 50 orange, 200 purple)
Green background during strong uptrend
Triangle markers on entry signals
Important Notes
⚠️ This is a long-only strategy. It does not take short positions.
⚠️ Historical results do not guarantee future performance. Backtests show what would have happened in the past under specific conditions. Markets change, and any strategy can experience drawdowns or extended losing periods.
⚠️ Risk management is your responsibility. The default settings risk 100% of equity per trade for backtesting purposes. In live trading, appropriate position sizing based on your risk tolerance is essential.
⚠️ Slippage and commissions matter. The backtest includes 0.02% commission and 1 tick slippage, but actual execution costs vary by broker and market conditions.
Best Practices
Test on your specific market — Results vary significantly across different instruments
Use appropriate position sizing — Never risk more than you can afford to lose
Combine with your own analysis — No indicator replaces understanding market context
Paper trade first — Validate the strategy matches your trading style before risking capital
Alerts
Two alerts are available:
MDZ Long Entry: Fires when all entry conditions are met
Uptrend Started: Fires when EMA stack first aligns bullish
Methodology
This strategy is based on the principle that trend continuation has better odds than reversal when multiple timeframe momentum indicators agree. By requiring five independent confirmations, it filters out weak setups at the cost of fewer total signals.
The ATR-based exits adapt to current volatility rather than using fixed pip/point targets, which helps the strategy adjust to different market conditions.
Questions? Leave a comment below.

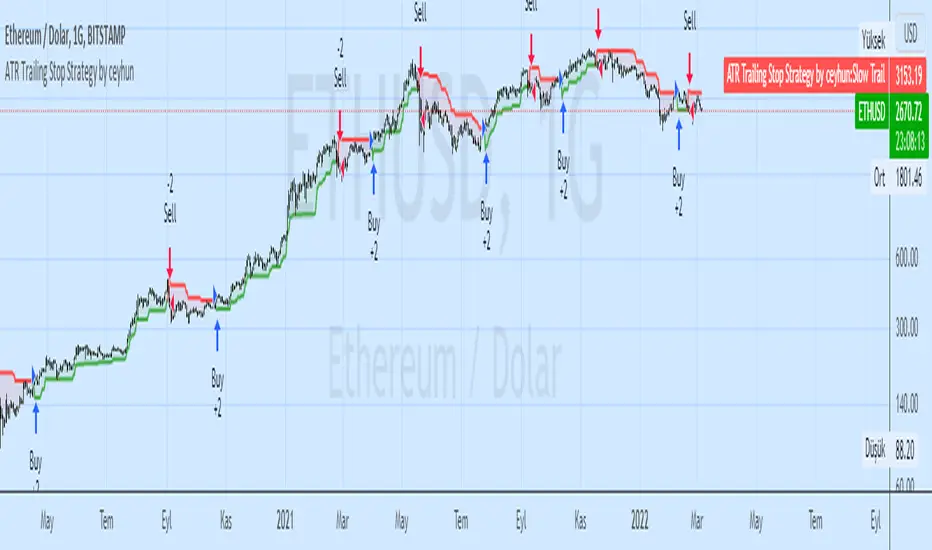
ATR Trailing Stop Strategy by ceyhunSame coding only coloring and strategy version added
//Barcolor
Green = Trail1 > Trail2 and close > Trail2 and low > Trail2
Blue = Trail1 > Trail2 and close > Trail2 and low < Trail2
Red = Trail2 > Trail1 and close < Trail2 and high < Trail2
Yellow = Trail2 > Trail1 and close < Trail2 and high > Trail2
//It gives White color where there is deterioration.
Let's not use InfoPanel in strategy, it would be wrong as it signals the next day.
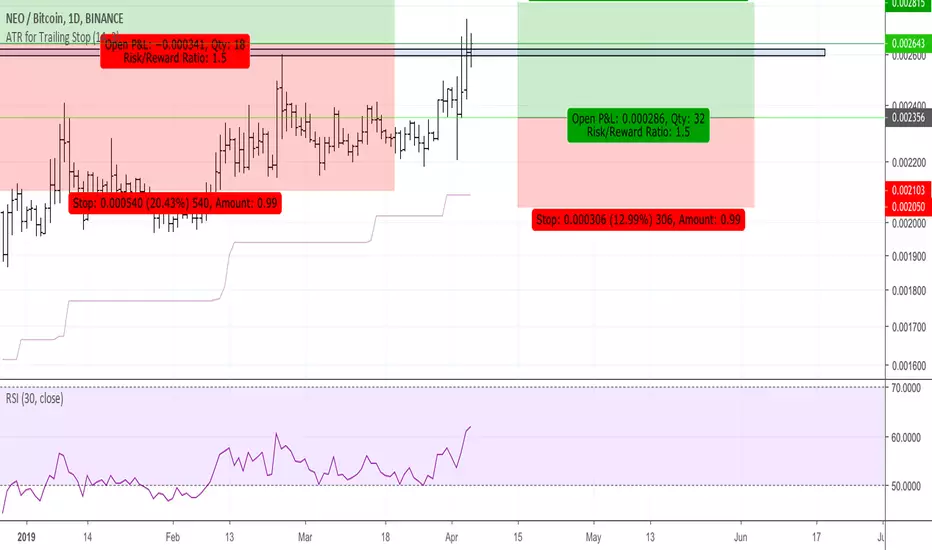
ATR for Trailing StopAn ATR (Average True Range) can be used to position a trailing stop
In this script, the true range of today is calculated based on the low of yesterday in order to be more stable.
It only goes up, as a trailing stop should do.
It only goes down when the trailing stop is reached by the price.

ATR for Trailing StopThe calculation of this ATR is based on the low of yesterday in order to not change continuously during the day.
You can use this indicator to create a trailing stop taking into account volatility on the nATRPeriod previous days.
It also always go up as a trailing stop should. It only goes down the price reaches the trailing stop.