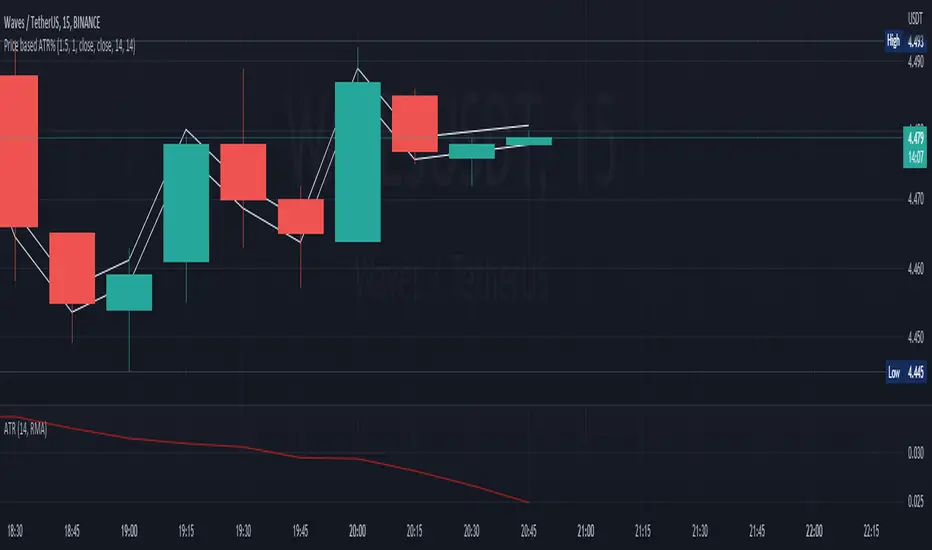
Price based ATR%This script shows upto two lines that represent a deviation from the price based on a multiple of the ATR%
close + ( (close / 100) * ( atr * upperMultiplier) )
and
close - ( (close / 100) * ( atr * lowerMultiplier) )
ATR
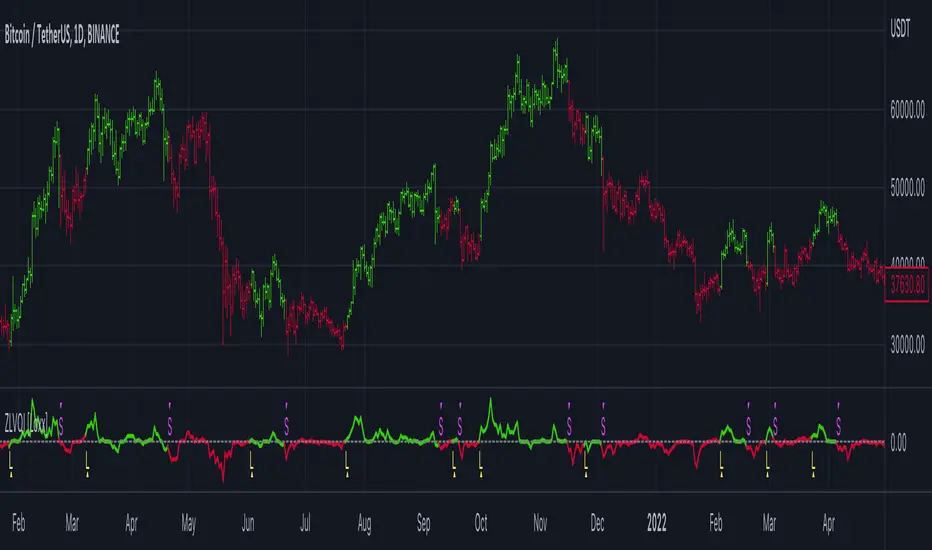
Zero-line Volatility Quality Index (VQI) [Loxx]Originally volatility quality was invented by Thomas Stridsman, and he uses it in combination of two averages.
This version:
This doesn't use averages for trend estimation, but instead uses the slope of the Volatility quality. In order to lessen the number of signals (which can be enormous if the VQ is not filtered), some versions similar to this are using pips filters. This version is using % ATR (Average True Range) instead. The reason for that is that :
Using fixed pips value as a filter will work on one symbol and will not work on another
Changing time frames will render the filter worthless since the ranges of higher time frames are much greater than those at lower time frames, and, when you set your filter on one time frame and then try it on another, it is almost certain that it will have to be adjusted again
Additionally, this version is made to oscillate around zero line (which makes the potential levels, which are even in the original Stridsman's version doubtful, unnecessary)
Usage:
You can use the color change as signals when using this indicator
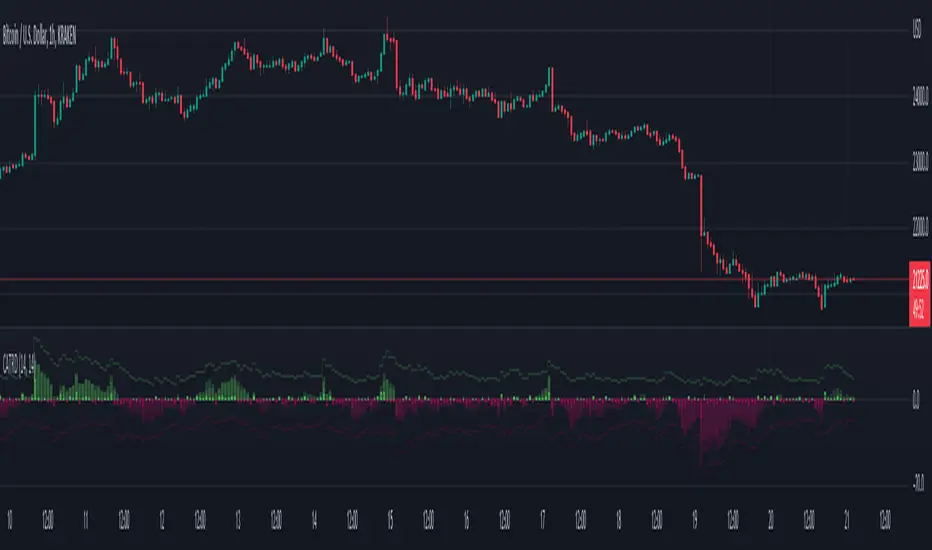
Cumulative ATR Distance Oscillator// A Price/ATR oscillator with cumulative waves.
// Based on Cumulative Volume Delta, but using price movement alone.
// Public Domain
// By Jolly Wizard
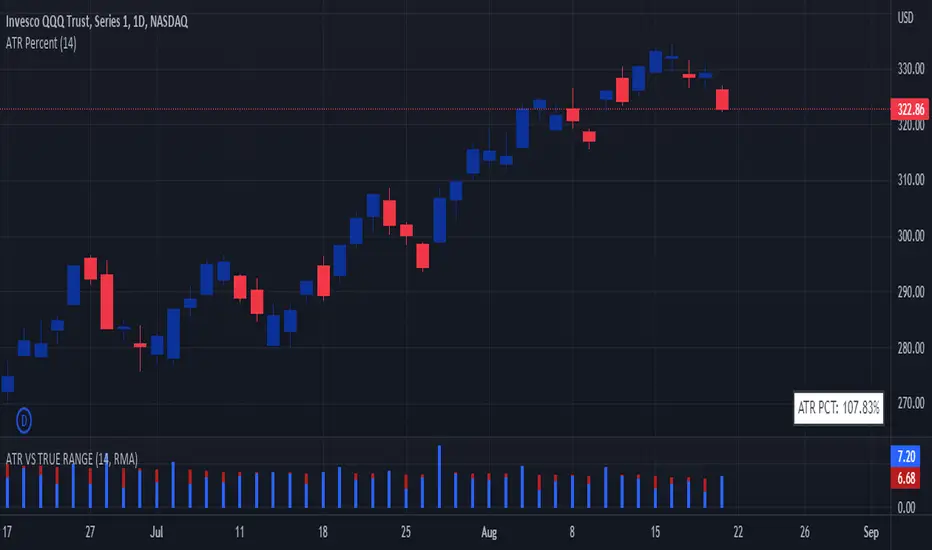
ATR VS TRUE RANGEDisplays ATR and True Range on the same panel.
Adjust the input and style settings to your liking.

ATR PercentDisplays daily percentage on the bottom right corner of chart.
Formula:
True Range / ATR * 100
Ichimoku ATR Oscillator// An oscillator that visualizes Ichimoku trend line distances in terms of ATR.
// Public Domain
// By JollyWizard

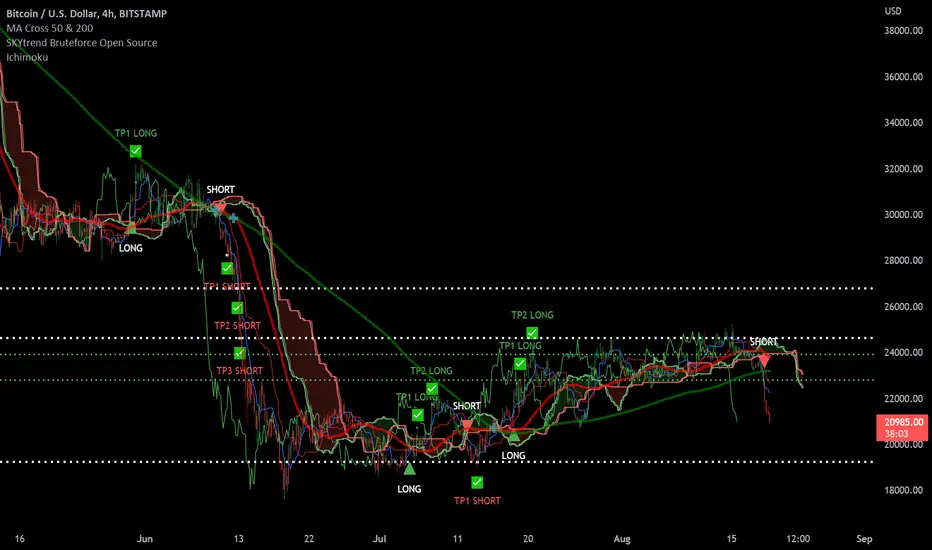
SKYtrend Bruteforce Open Source✨SKYtrend Bruteforce Now Open Source✨
📌This indicator analyzes the trend and calls Long/Short which is fully custom to fit your style of trading.
📌Custom Take Profit Levels currently have 3 TP levels for Long and Short you can decide which % each TP will be in settings.
📌2 Custom Stoploss levels. For Long or Short. Can Enable or Disable either.
📌Can set alert For Long, Short , TP Long 1-3, TP Short 1-3, SL 1-2
📌Has built in ichimoku cloud
If you like it, like it. :)
KTP ATR , TR and DATR by Mitraj ThakkarThis indicator provides values of ATR, TR and DATR values side by side which makes it easy for user to compare it for current
candle and takes decision. It is not a complete system for trading but it aids in taking decision for entry and exit. for eg. ema crossover is formed for entry, we can take entry 5% of datr above pattern and keep stop loss 10% datr below pattern.
ATR stands for Average true range of last 14 candles.
TR stands for true range of each candle.
DATR stands for Daily Average True Range.

Daily/Weekly ExtremesBACKGROUND
This indicator calculates the daily and weekly +-1 standard deviation of the S&P 500 based on 2 methodologies:
1. VIX - Using the market's expectation of forward volatility, one can calculate the daily expectation by dividing the VIX by the square root of 252 (the number of trading days in a year) - also know as the "rule of 16." Similarly, dividing by the square root of 50 will give you the weekly expected range based on the VIX.
2. ATR - We also provide expected weekly and daily ranges based on 5 day/week ATR.
HOW TO USE
- This indicator only has 1 option in the settings: choosing the ATR (default) or the VIX to plot the +-1 standard deviation range.
- This indicator WILL ONLY display these ranges if you are looking at the SPX or ES futures. The ranges will not be displayed if you are looking at any other symbols
- The boundaries displayed on the chart should not be used on their own as bounce/reject levels. They are simply to provide a frame of reference as to where price is trading with respect to the market's implied expectations. It can be used as an indicator to look for signs of reversals on the tape.
- Daily and Weekly extremes are plotted on all time frames (even on lower time frames).

ATR-FXV2Indicator Name : ATR-FXV2
Features :
This indicator will allow the user to read current and previous day ATR values with Multiple time frame. Using yesterday 1 hour high ATR value this system will auto plot the support and resistance and same will be maintained in all the time frames. Option has been provide to create 2 EMA lines and it is optional.
This indicator will work in all the currencies, commodity and crypto.
supports both continues and time based market.
user has option to update ATR and EMA values which will help the user to do back test this strategy.
Technical:
current day standard time frame ATR values has been displayed in the right corner table.
Box size has been displayed in the right coroner table.
open time has been plotted with different color.
All the support lines has been plotter with same color.
All the resistance lines has been plotted with same color.
suggested EMA has been displayed in right corner table.
Note: before using this system kindly do the back testing.

ER-Adaptive ATR [Loxx]Average True Range (ATR) is widely used indicator in many occasions for technical analysis. It is calculated as the RMA of true range. This version adds a "twist": it uses Perry Kaufman's Efficiency Ratio to calculate adaptive true range
You can use this indicator the same way you'd use the standard ATR.

ATR-Adaptive JMA [Loxx]Not many know that the JMA (Jurik Moving Average) is already an adaptive indicator (it is adapting using the usual market volatility monitoring mode). Hence, making it adaptive "once more" makes it double adaptive. Fro the adaptivity in this case, we are use ATR (Average True Range) to make the JMA double adaptive. The ATR period is the same as the JMA period (there is no separate setting for that) so the usage of the indicator is as simple as it gets.
What is Jurik Volty used in the Juirk Filter?
One of the lesser known qualities of Juirk smoothing is that the Jurik smoothing process is adaptive. "Jurik Volty" (a sort of market volatility ) is what makes Jurik smoothing adaptive. The Jurik Volty calculation can be used as both a standalone indicator and to smooth other indicators that you wish to make adaptive.
What is the Jurik Moving Average?
Have you noticed how moving averages add some lag (delay) to your signals? ... especially when price gaps up or down in a big move, and you are waiting for your moving average to catch up? Wait no more! JMA eliminates this problem forever and gives you the best of both worlds: low lag and smooth lines.
Included:
Bar coloring
[MAD] almost Nadaraya-Watson EnvelopeThis is a cloud where I tried to recreate the Nadaraya-Watson Envelope using a different mathematical approach
Clustered standard Ma's with weighting.
Objectives:
No repaints
Alerts
Almost the same output on live play.... (no need to replay history when configuring settings).
the presetup is for LuxAlgo's default settings (thanks for this great indicator).
Features:
Alarms with different modes --- Band 3 is the band that triggers the alarms.
more gradual setting for the curve
visual alerts for band 1 and 2
how to use:
in trend direction act the yellow "in direction" arrows tape 1
against the trend direction: the band 3 signal, DCA or with SL, prefer SL as it is safer
for both trading variants you can adjust the curve and the bands to your risk management
have fun

ATR MultiplierOVERVIEW
The Average True Range Multiplier (ATRX) is a simple technical indicator that takes the value of the ATR indicator and multiplies it by a user-specified amount.
CONCEPTS
This indicator is primarily used to set key levels based on historical volatility. The ATR indicator alone measures the historical volatility of the selected instrument, this indicator just multiplies that value to save the hassle of doing that yourself.

Volatility Pivot Support and Resistance [Loxx]Volatility Pivot Support and Resistance calculates "pivots" (support/resistance lines) based on current symbol/timeframe Average True Range calculated volatility.
What is Average True Range?
The average true range (ATR) is a technical analysis indicator, introduced by market technician J. Welles Wilder Jr. in his book New Concepts in Technical Trading Systems, that measures market volatility by decomposing the entire range of an asset price for that period.
The true range indicator is taken as the greatest of the following: current high less the current low; the absolute value of the current high less the previous close; and the absolute value of the current low less the previous close. The ATR is then a moving average, generally using 14 days, of the true ranges.
Included:
-Bar coloring

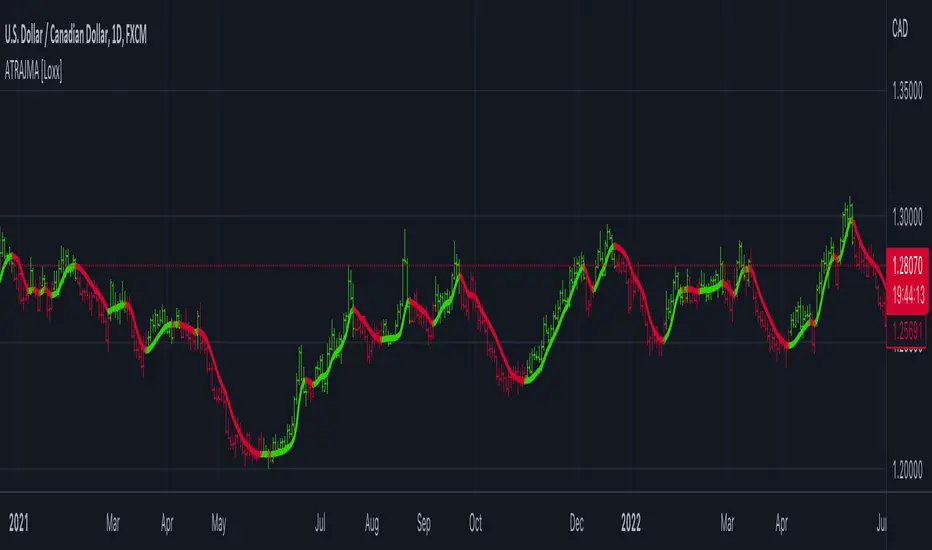
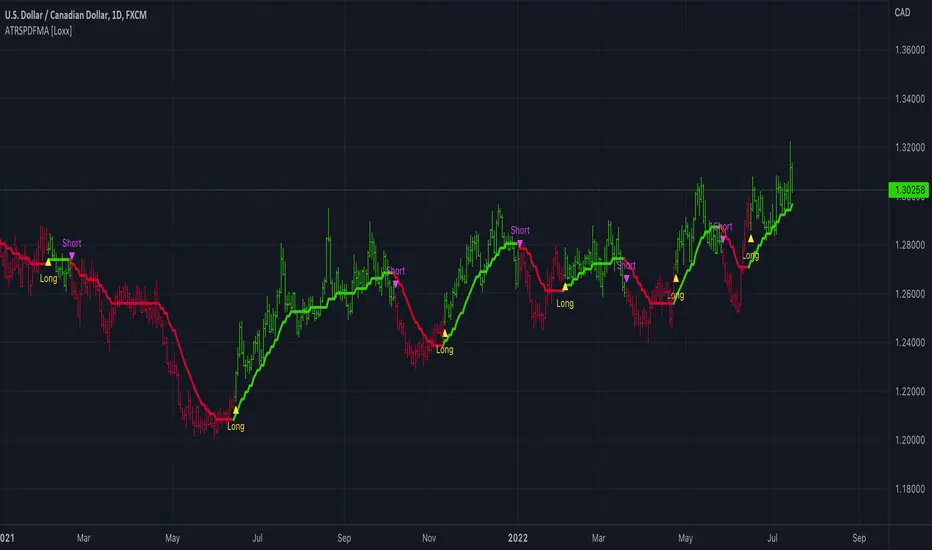
ATR-Stepped PDF MA [Loxx]ATR-Stepped PDF MA is and ATR-stepped moving average that uses a probability density function moving average.
What is Probability Density Function?
Probability density function based MA is a sort of weighted moving average that uses probability density function to calculate the weights.
Included:
-Toggle on/off bar coloring
-Toggle on/off signals
-Alerts long/short
RVOL/ATR LabelRelative Volume and Average True Range are critical for quick decision-making and managing risk. Even if the setup is there for a day trade, having a high relative volume on the name helps with confirmation to put on the risk. Additionally, using ATR to define your risk is a very helpful way to quickly size your trade in the moment. This indicator provides the ability immediately assess whether a trade is worth taking, as well as defining risk for the trade.
HOW TO USE
Our relative volume calculation looks at the cumulative volume up until the current minute of the day, and compares that with the same calculation of the previous 5 trading days. We have provided an "RVOL Threshold" input, which paints the RVOL square green if it is greater than or equal to this number (otherwise, it is red). We prefer an RVOL value of at least 2; however, feel free to change this value to your preference.
OUTPUTS
This indicator prints the RVOL and ATR values in the top right of your chart for quick and easy decision-making (as described above). If the RVOL value is greater than or equal to your RVOL Threshold, the square will be green. Use the color-coding to your advantage when making quick decisions.
Happy Trading!

Market First Signals - Relative Strength/WeaknessThis market-first trading strategy gives BUY, SHORT, and CLOSE signals based on volume, trend, and relative strength or weakness to the market (SPY by default, can be customized). This indicator is useful for signaling day-trade entries and exits for tickers that are strong (or weak) against the market.
Stocks that are showing relative strength (or weakness) to the market, are trending, and have decent movement generate a buy (or short) signal. When the trend runs out, a CLOSE signal is fired.
Potential profit (based on ATR) and actual profit is calculated, predicting the type of move expected
Unique 'stay in trade' logic helps prevent unnecessary CLOSE signals if a trend is likely to continue
A colored plot indicates the strength of the current trend and turns orange/red when the strength is weakened.
Crypto traders can uncheck 'Trade during market hours' for 24-hour trading, and should change the comparison ticker from SPY to BTCUSD or something similar for their market.
Enjoy!
KEY CONCEPTS
The three- and five-minute timeframes are used to establish and verify trend (ADX/DI with custom logic)
Entries and exits are based on Parabolic SAR and confirmed on multiple timeframes, trend, and relative volume
Relative strength /weakness to the market compares ticker to SPY
Chop is avoided at all costs. I've experimented with choppiness indicator below 38, but found that the ADX DI+/- readings work even better.
Trend is established using ADX DI+/- readings over 20, confirmed by EMA 5/13 crossover and EMA5 slope
Signals will fire only if the average volume for the current 5-min bar is above normal
Only tickers with a five-bar / 13 period ATR of 1% the ticker's price generate signal.
Only longs above daily-anchored VWAP, shorts below daily-anchored VWAP
Signals fire on bar close to prevent repainting / look-ahead bias
Indicator labels and alerts generated
SIGNALS
BUY: up-trending tickers showing relative strength are bought on the three-minute PSAR
SELL: when the close price falls below the 1, 3, and 5-minute PSAR, or the ADX DI- falls below 20
SHORT: down-trending tickers with relative weakness are shorted on the three-minute PSAR
COVER: when the close price moves above the 1, 3, and 5-minute PSAR, or the ADX DI- falls below 20
ALERTS
Alerts are generated on BUY, SELL, SHORT, and COVER signals, as well as optional LOST RELATIVE STRENGTH and LOST RELATIVE WEAKNESS
INPUTS
Use relative strength/weakness comparison with the market : trigger trades based on the ticker's strength or weakness to the selected comparison ticker (usually SPY for equities or BTCUSD for crypto)
Comparison Ticker for relative strength/weakness : Ticker to compare against for relative strength/weakness
Trade during market hours only : Take buy/sells during specified hours. Disable this for crypto trading.
Market hours (market time) : Customize market hours - defaults to 9:30 to 16:00 EST
"Only trade very strong trends" : take trades only if an established trend is very strong (ADX over 40) (DEFAULT = OFF)
"Limit trade direction to VWAP" : Long trades only above VWAP, shorts below (DEFAULT = ON)
"Limit trade direction to Market direction" : Long trades only if SPY (or selected comparison ticker) is up, shorts if the market is down. (DEFAULT= OFF)
"Limit trades based on a ticker's green/red status for the day" : Long trades if the ticker is green for the day, shorts if red. (DEFAULT = OFF)

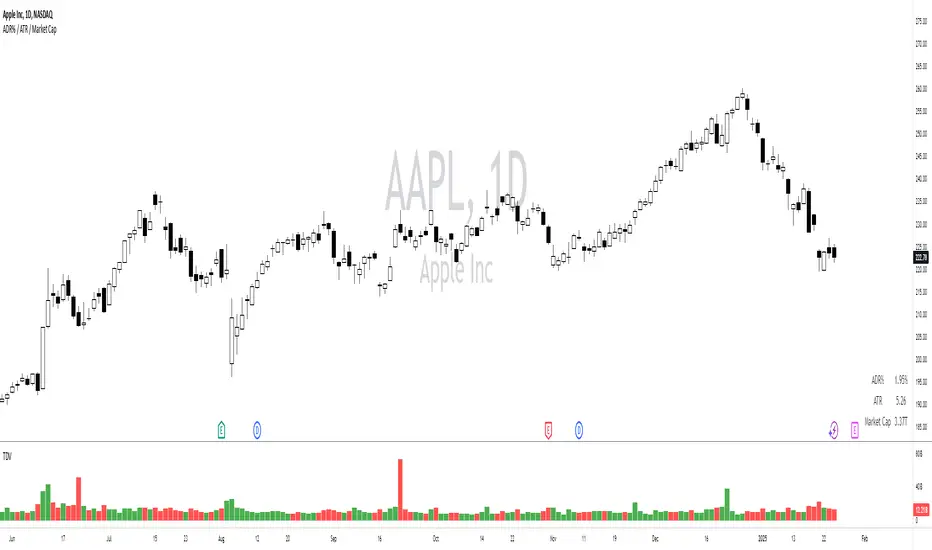
ADR% / ATR / Market CapDisplays the following values in a table in the upper right corner of the chart:
ADR%: Average daily range (in percent).
ATR: Average true range (hidden by default).
Market Cap: Total value of all a company's shares of stock.
All values are calculated based on daily bars, no matter what time frame you are currently viewing. Doesn't work for time frames >1D, which is why the table is not shown on weekly/monthly charts.
Credit to MikeC / TheScrutiniser and GlinckEastwoot for ADR% formula, and ArmerSchlucker for the original script which includes LoD Dist . instead of Market Cap.
ATR alerts & backtestingThe Basics
Alert will trigger if the current (real time) price surpasses the high of the ATR of the previous bar. (can also be set for the Low of the ATR). Each time the follow up candle surpasses the high of the previous ATR, the background will be coloured orange. This makes back testing easier on the eye. This can be turned off.
- Colours can be changed.
- Can also set a color and alert when the current price surpasses the Low of the ATR of the previous bar.
- ATR distance can be changed.
- Can be used on different chart types.
- Can be used as entry or exits in combination with bots.
- Can display only ATR top or bottom or both.
Example
An alert will trigger if the price of the current bar surpasses the red dot (ATR) of the previous bar.
Alerts can be created on all timeframes, if this is within your Tradingview plan.
Final Words
Disclaimer: Please use it with care and at own risk. The owner of this indicator is not liable for any financial losses.
Past performance is no guarantee of future returns.

ATR-Adaptive, Smoothed Laguerre RSI [Loxx]ATR-Adaptive, Smoothed Laguerre RSI is an adaptive Laguerre RSI indicator with smoothing to reduce noise
What is Laguerre RSI?
The Laguerre RSI indicator created by John F. Ehlers is described in his book "Cybernetic Analysis for Stocks and Futures".
This version:
Instead of using fixed periods for Laguerre RSI calculation, this indicator uses an ATR (average True Range) adapting method to adjust the calculation period. This makes the RSI more responsive in some periods (periods of high volatility), and smoother in order periods (periods of low volatility). Also this indicator adds an option to have smoothed source input including Loxx's Expanded Source Types.
Included
-Loxx's Expanded Source Types
-Bar coloring

[DT] ATR Trigger Bar OverlayATR Trigger candle is an idea that I originally heard about studying alexander elder's work at spike trade. This code is my interpretation of his work.
The idea behind an ATR trigger bar is to find areas where price is likely trapping market participants. In some cases a trigger will not form in one bar so a two bar analysis is also included in study.
Bull trap condition:
- price moves above previous bar high and in the same candle will close below previous bar close
Bear trap condition:
- price moves below previous bar low and in the same candle will close above previous bar close
TODO:
- categorize trigger bar as 1 bar or 2 bar price action
- allow user to filter 1 bar or 2 bar price action
- multiple timeframes
- volume filter
- horizontal line for average price on a trigger bar

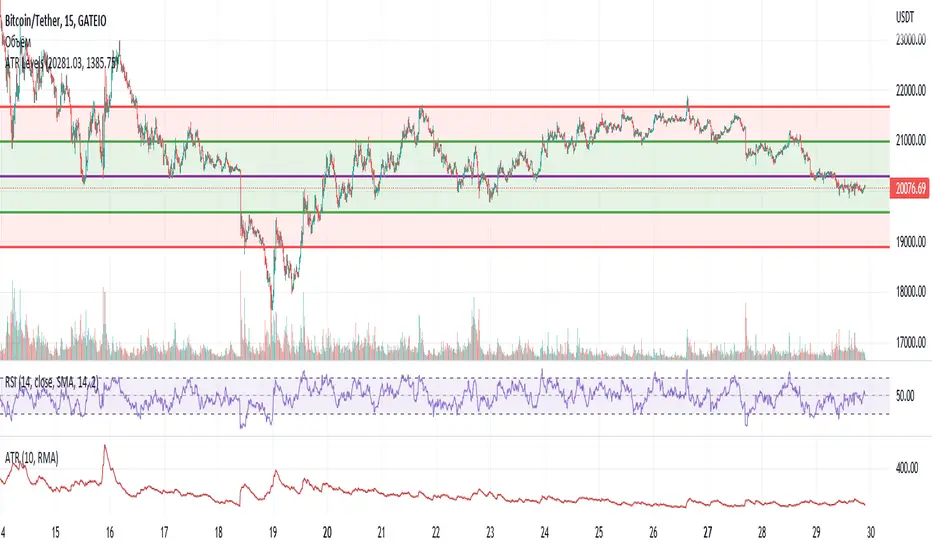
ATR LevelsATR Levels
The indicator plots levels based on the ATR indicator
Initial data required for the indicator:
- Open price
- ATR
Levels are calculated as follows:
1. Open price +100% ATR
2. Open price +50% ATR
3. Open price
4. Open price -50% ATR
5. Open price -100% ATR
For visual convenience:
The area between levels 1-2 and 4-5 is filled with red
Zone between levels 2-4 - filled with green
Уровни среднего истинного диапазона
Индикатор строит уровни, основанные на индикаторе ATR (Средний истинный диапазон)
Исходные данные, необходимы для индикатора:
- Цена открытия
- ATR (Средний истинный диапазон)
Уровни рассчитываются следующим образом:
1. Цена открытия +100% ATR
2. Цена открытия +50% ATR
3. Цена открытия
4. Цена открытия -50% ATR
5. Цена открытия -100% ATR
Для удобства визуального восприятия:
Зона между уровнями 1-2 и 4-5 заполнена красным цветом
Зона между уровнями 2-4 - заполнена зеленым цветом