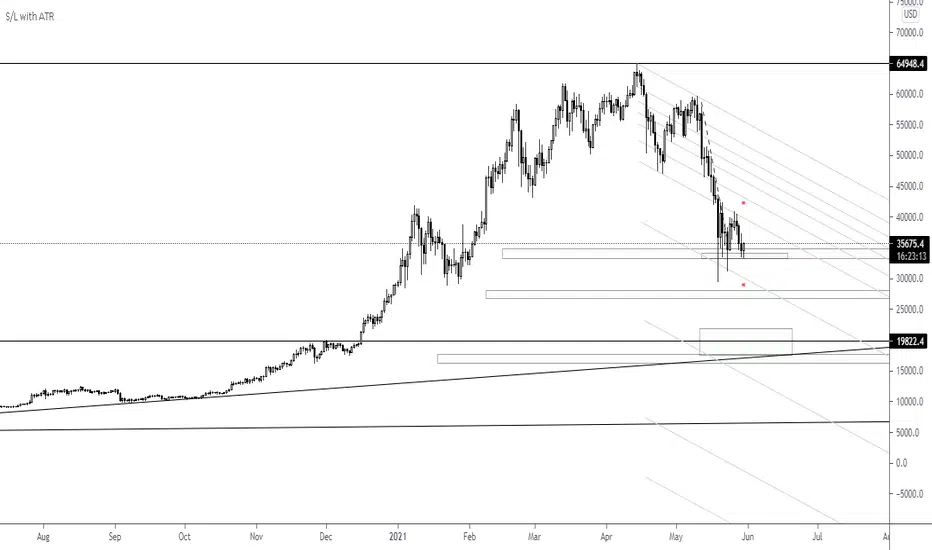
Average True Range (ATR %) Stop Loss CalculatorThis indicator takes the average of a series of ATR to calculate what I would consider an optimum stop loss placement represented in percentage (read below for full overview).
While the data is plotted what is most helpful are the actual numbers presented and for my charts I remove most of the plotting.
This indicator is most helpful on the daily timeframe but can be used for all timeframes such as the 4HR, 1HR or even 15M.
This indicator should not be used alone. It should be used in conjunction with proper price action analysis. It’s also a great indicator if you chart using Value Channels. Ideally you want your stop placement to be below at least one core Value Channel boundary range. In addition to standard support and resistance and some key moving averages the market respects. This also works best when trading with the prevailing BIAS of the instrument (bull or bear).
Cryptos: Generally, that means you’re buying on retracements that fit the end of a structured move. The other option is using this in a clear up trending market where the pull backs are clearly being supported with buying.
FOREX: I built another indicator for FOREX search: ATRPIPS with SL
WTI: Helpful but I have different rules for when I trade WTI. I rely upon VCs and diagnal VCs much more when trading this.
Equities: Helpful but with the increase of volatility as well as uncertainty of Bias of the market-- this should be used as more of a guide than
What is most important is the actual percentage numbers but I've found graphing 1-3 of the actual ATRs is helpful. The rest just uncheck the checkbox in the options.
Indicator Overview:
Value 1 - 3 Period ATR (maroon)
Value 2 - 7 Period ATR (green)
Value 3 - 30 Period ATR (blue)
Value 4 - 90 Period ATR (blue, bold)
Value 5 - 1 Period ATR (green)
Value 6 - 1 Period ATR (red)
Value 6 – Prime Stop Loss Placement (maroon). This is the average of all above ATRs multiplied by 1.5
Value 7 - Move Left (red). Experimental value. This is the difference between (prime stop loss) and 1 day period move. Two ways to use this value. Use as a tighter stop loss placement. The other option is to use as a retrace target for purchase and using the Prime Stop Placement value as you’re stop loss.
All ATRs use the LOW price of the period. After testing both the low and close I’ve settled on the low to capture the most volatility you will typically experience.
Once again, this indicator should be used in conjunction with your proven trade system.
Also, by knowing what the values are within the indicator you could just eye ball what would be the best stop placement depending on the ATR or 1 or 2 ATRs you find most represent the volatility of what you are trading.
I will be expanding on this indicator by bringing in average measured moves as well as volume analysis and most likely with color changes and modifications.
Background:
While using and refining my trade system I've noticed that most moves happen in 3 periods. So we start there. The 7 period is good for a 24 hour market such as crypto (although weekend trading can be a hit or miss) and to some extent FOREX. The longer periods of 30 & 90 are to smooth out the data set. The final value of the 1 period is to bring a little more recency to the calculation.
Why multiply the average by 1.5? I've found in my own trading and system I built to be the best placement (in conjunction with VCs) to ensure you're stop isn't to close and is within the instrument you are trading volatility .
I'm looking at making this more intelligent as well as take into account volume and structured moves.
ATR

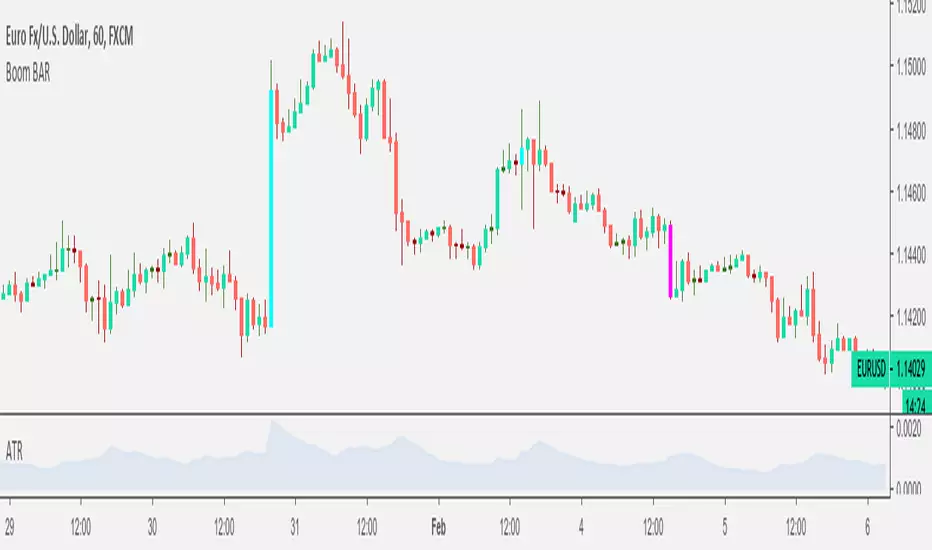
Boom BARThis script highlights the candles that have an explosion in movement by coloring them yellow. You can choose the percentage of amplitude over the ATR.
ATR Pips with Stop LossThis indicator shares ATR pips and a calculated 1.5 x stop loss calculation.
1st number is ATR.
2nd number is ATR x 1.5 (a typical SL when trading daily time frame).
The plot lines are really not that important- it's the actual numbers.
What I do is uncheck the plot line checkboxes (ATR & SL) so it doesn't show up, that way I can reduce the indicator window.
This script is a modified script by ATR Pips . Kept the BB section for now as it might be useful, but doubt it.
Future updates:
- editable the multiple for SL
- static daily numbers (right now this shows the timeframe you are viewing, I'd keep that but add a static daily ATR so you have both)

ATR+VWAP Alert//These signals mostly consist of crossovers between a 13 VWMA and a 62 VWMA. I've found these two moving averages to be quite special in their ability to
//recognize a quick trend using volume data. The VWAP is used in the alert system as well, to give some perspective on which direction we are looking to take. We
//are also using ATR. We only take trades when the ATR is on the move, meaning we have a chance to catch a volatile move! Finally, we use RSI to help weed out bad
//trades. We only take 'longs' with bullish readings from RSI, and we only take 'shorts' with bearish readings from RSI. These alerts are fantastic for catching quick intraday
//trades in either direction. I recommend using a small 'take profit' target rather than using an exit indicator. These trades can move 20-30 pips and reverse just as quickly. Good luck!
//How To Use:
//When the alert system is added to the chart, you will notice up/down symbols appear at various locations. For bullish alerts, right click an 'Up' symbol and choose 'Add Alert on VWap & ATR..'
//There are two condition options. 'Long/short', and right below that 'Buy-Signal/Sell-Signal'. Choose 'long' and 'Buy-Signal'. At options, choose 'Once Per Bar Close'. Design your alert, and you're good to go.
//For bearish signals, find a 'down' signal on the chart. Right click and follow the same process, except choosing 'short/Sell-Signal' conditions.
Tips:
Use VWAP as a stop-loss. If a candle closes below/above the VWAP in the direction against you.. get out of the trade. The losses will be minimal and few compared to the wins. Use discretion and trade carefully. This works great with crypto. Invent your own exit. If you come up with a clever exit, please share!
You can contact me at my Discord!
discord.gg

DD ATR stop trailsATR based stop trails.
The top trail is basically lowest ATR since the last candle hit (with given length and multiplication) added to candle high.
The bottom trail is analogic.

RSI ATR ChannelDraws a channel based on ATR (Average True Range) and RSI. Detects band touches and colors the background appropriately.

AM HellachoppyThis script shows choppy zones and attempts to estimate the proceeding direction using a variety of methods. The methods used to calculate the estimate are user configurable.

AM Trend Exhaustion/ChopThis indicator lets you see when a trend may be exhausted and require consolidation, as well as choppy trading zones.
When the oscillator is in the bottom bar, the price is in a chop zone. When it reaches the top bar, it is due for consolidation.

XBT Fader [NeoButane]Proof of concept indicator. Intended usage: to create confidence in buying a dump, or selling a pump. This is not a trending tool.
It works by monitoring spikes in volume as well as abnormally ATR. Generally speaking, bitcoin reverses every time there's a one candle spike with no following volume. There is a limit in which a signal is triggered in case bitcoin continues running. Other preventive measures include a modified MFI and fairy dust.
In future iterations, take profits and stop losses will be implemented also based upon average candle percentage move rather than ATR.

Comparative ATR%Comparison of the ATR (Average Trading Range) of multiple coins. The ATRs are shown as percentage.

pooya ATRthis is modified ATR for signal strength test
with custom ATR in multi time chart
comment your opinion...

Prometheus Scalping vs. Swinging by ZekisIt's been a while since i did not post a script, so here it is...
I found some simple indicators,put them together and saw some nice results.
There is an indicator for scalping, swinging and for exit.
With the right setup it can be very useful, so you can play with it to find what you need
It works in any timeframe in any market, just change values (default ones are good for 1H or more), all you need is volatility... (this is what you need in any market!)
Also you can enable or disable background and bar colors
Enjoy!
@Zekis

Filtered ATRThis script defines an average true range where extreme events are filtered out.
Extreme events are those bars with a true range larger than 3*sigma+average,
where average and standard deviation are estimated from the last 200 bars.
In this way the ATR is not altered by exceptional events (e.g. the flash crash of Jan 3rd 2019)
and can still be used safely for Stop Losses and Take Profits.
Hitting the like button is a free sign of gratitude, thanks.
Fib's GhostThis indicator uses Fibonacci Support/Resistance Channels, weighted with Market Volatility(ATR) to determine Trend Momentum and Strength. It has two components: the Histograms and the strength line:
- The histogram gives information about the momentum behind moves and current trend. If Histogram is positive the market is currently in an UpTrend, the height of the Histograms indicates the amount of
buying/selling pressure of the market, in a strong uptrend the histograms grow with each new candle, and never fall under 0. If the histograms cross 0 a trend reversal is signaled.
- The strength line gives information about the Strength of the current Trend, After the color switch the line should move towards the 0-line, the closest point to the 0 line signals a local Top/Bottom.
- The strength line should be used to find hidden-divergences between price and Strength, the Further away the line is from the center the higher the chances of a reversal, but no trend change is signaled until
histograms cross.
The indicator code can be granted for free upon request

ATR Volatility Spectrum
This indicator estimates price volatility and it is based on ATR only.
The advantage of this indicator is that it can be used with any pair, any time frame.
The fluctuations of a short period ATR with respect to a gently ATR with high period
are calculated.
The only parameters are the periods of the reference ATR and fast ATR, which could be
safely let untouched and modified by experts.
RED areas depict low volatility
GREEN areas depict high volatility.
When the clouds are outside the region delimited by the aqua lines we have
extreme conditions:
Extremely low volatility = red cloud outside the aqua bands
Extremely high volatility = green cloud outside the aqua bands
Vitelot/yanez/Vts December 2018.
Hitting the like button is free act of gratitude

Normalized Average True RangeThis indicator was originally developed by John Forman (Stocks & Commodities, V.24:6 (May, 2006): "Cross-Market Evaluations With Normalized Average True Range").
Mr. Forman uses a normalized average true range indicator to analyze tradables across markets.
Good luck!

Stoploss line by ATR Input
ATR peroid : 14
Entry long - Tick , Short - Tick off
Entry price - default Close
Factor of ATR to set Stoploss : 1.5
Timeframe : Daily
Aphrodite Renko Up and Down by ZekisA simple renko script with bar and background colored
In this way ups and downs can be seen more easily
Alerts are added for buy/sell, long/short
Possibility to show bricks colours and background colours, according to the market situation

Average True Range Stop Loss CalculatorThis indicator takes the average of a series of ATR to calculate what I would consider an optimum stop loss placement represented in percentage (read below for full overview).
While the data is plotted what is most helpful are the actual numbers presented.
This indicator is most helpful on the daily timeframe but can be used for all timeframes such as the 4HR or 1HR.
This indicator should not be used alone. It should be used in conjunction with proper price action analysis. It’s also a great indicator if you chart using Value Channels. Ideally you want your stop placement to be below at least one core Value Channel boundary range. In addition to standard support and resistance and some key moving averages the market respects. This also works best when trading with the prevailing BIAS of the instrument (bull or bear).
Cryptos: Generally, that means you’re buying on retracements that fit the end of a structured move. The other option is using this in a clear up trending market where the pull backs are clearly being supported with buying.
FOREX: I use this in my FOREX swing trades for my stop placements. Keep in mind I primarily trade my trade system and use this indicator to ensure my stop placements I define based on VCs are within the ATR tolerance. I’ve found that ATR * 1.5 is the best for my trade system.
WTI: Helpful but I have different rules for when I trade WTI. I rely upon VCs and diagnal VCs much more when trading this.
Equities: Helpful but with the increase of volatility as well as uncertainty of Bias of the market-- this should be used as more of a guide than
Indicator Overview:
Value 1 (maroon): 3 Period ATR
Value 2 (green): 7 Period ATR
Value 3 (blue): 30 Period ATR
Value 4 (blue, bold): 90 Period ATR
Value 5 (green): 1 Period ATR
Value 6 – Prime Stop Loss Placement (red): Average of all above ATR multiplied by 1.5
Value 7 (red): Difference between Value 6 (prime stop loss) and current period move. This is an experimental value. Two ways to use this value. Use as a tighter stop loss placement. The other option is to use as a retrace target for purchase and using the Prime Stop Placement value as you’re stop loss.
All ATRs use the LOW price of the period. After testing both the low and close I’ve settled on the low to capture the most volatility you will typically experience.
Once again, this indicator should be used in conjunction with your proven trade system.
Also, by knowing what the values are within the indicator you could just eye ball what would be the best stop placement depending on the ATR or 1 or 2 ATRs you find most represent the volatility of what you are trading.
I will be expanding on this indicator by bringing in average measured moves as well as volume analysis and most likely with color changes and modifications.
Background:
While using and refining my trade system I've noticed that most moves happen in 3 periods. So we start there. The 7 period is good for a 24 hour market such as crypto (although weekend trading can be a hit or miss) and to some extent FOREX. The longer periods of 30 & 90 are to smooth out the data set. The final value of the 1 period is to bring a little more recency to the calculation.
Why multiply the average by 1.5? I've found in my own trading and system I built to be the best placement (in conjunction with VCs) to ensure you're stop isn't to close and is within the instrument you are trading volatility.
I'm looking at making this more intelligent as well as take into account volume and structured moves.
Stochastic with Volatility-WONTONLooking for a modern stochastic oscillator and volatility together?
Stochastic using an improved calculation.
Volatility overlay.
Price Action tends to follow a bottom in volatility.
ATR 0.5 & 0.7 rangesIt good to look to ATR on intraday trading.
According to our team research only 4.8% of days security goes out of their ATR.
So we developed ATR indicator which shows Daily ATR ranges on smaller time frames.
When price crosses 70% of previous day ATR is good to look for signal to trade backward.

ATR 0.5 & 0.7 rangesOur research showed that securities usually stay in their ATR. It is about 4.8% days when security is goes out of ATR.
So we are using this feature in our trading, when security is out of their 70% of ATR we are looking for signals to trade backward.
This indicator could show you when bars are close to ATR.