ADX ColorO ADX avalia tendências de alta e baixa, buscando mostrar um movimento direcional.
O indicador é composto por três linhas: DI+, DI- e ADX;
Onde o ADX representa o índice das médias do movimento direcional.
O DI+ ocorre quando o valor do preço máximo do candle for maior que o do candle anterior, assim, temos um movimento direcional positivo.
DI+ = Máx(c) – Máx(c – 1)
E o DI- representa o movimento direcional negativo, ele ocorre quando a mínima do candle for menor que a mínima do candle anterior.
DI- = Mín(c) – Mín(c-1)
Dessa forma, se o ADX e o DI- estiverem acima do DI+ e com ADX subindo acima de 25, será o melhor momento para estar vendido, e que a tendência de baixa é forte.
E quando as médias ficam se cruzando entre si, significará que o ativo pode apenas estar em congestão, ou seja sem tendência.
平均趨向指標(ADX)

Adaptive DC of RSX+MFX and trend strengthAdaptive Donchian Channel drawn over RSX + MFI. Zero-lag trend strength estimation has been added as well. Experimental version.

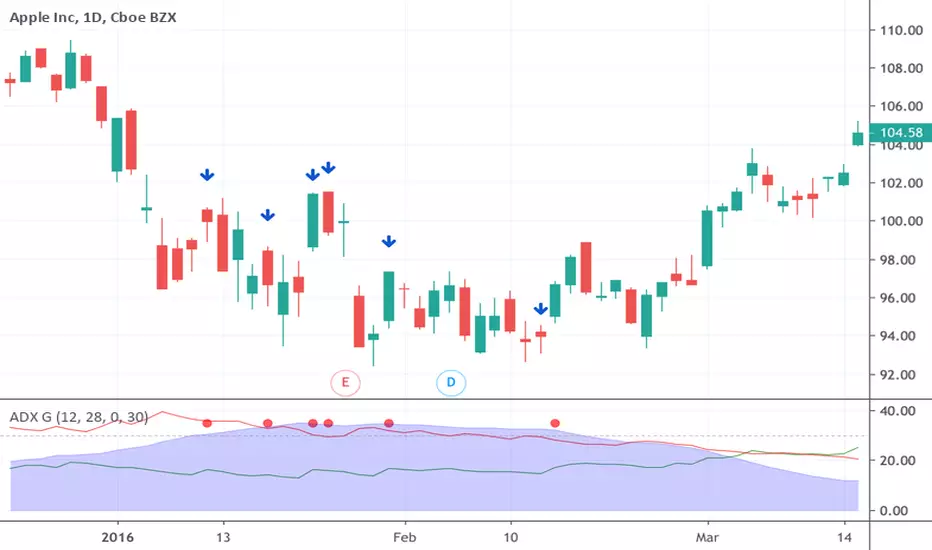
ADX GapperBased on the ADX Gapper strategy described in the book Street Smarts, it looks to exploit retracement to a prevailing trend when there has been a gap away from the trend, giving you multiple potential entries. It uses the ADX to determine a trend and detects when there is a gap to signal an entry day where:
You would enter short if the DI-(red line) > DI+ (green line), ADX (blue area) > 30 indicating a strong trend and if there is a gap up from the previous day. If all the described conditions are met then you would place a short stop at the previous day highs and trail a stop until the end of the day. This strategy is meant to give you trades to hold for 1 day (the day you enter) or 2 days if you consider you should hold it overnight.
ADX and DI With Coloured Histogram BUY/SELLWe display here the ADX has a colored histogram, which is
- green when ADX and DI+ are higher then DI-, while the ADX is increasing, meaning that we are in a potential uptrend--> we should rather be long (only buy if you have other concordant signals !)
- red when ADX and DI- are higher then DI+, while the ADX is increasing, meaning that we are in a potential downtrend --> we should rather be short (only sell if you have other concordant signals !)
- not visible if none of these conditions are met, meaning that the indicator do not show a potential trend --> don't use this indicator to buy or sell at this stage

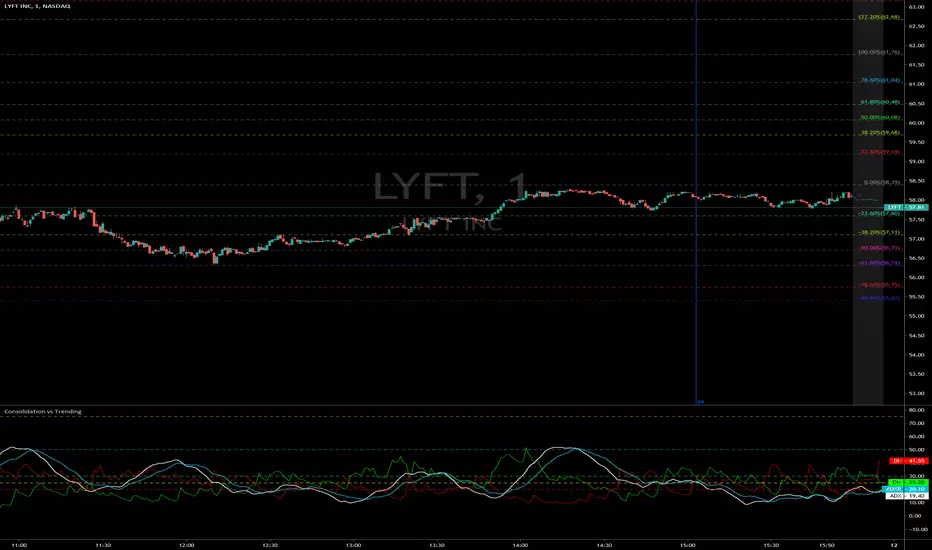
Consolidation vs Trending
ADX is used to quantify trend strength. ADX calculations are based on a moving average of price range expansion over a given period of time. The default setting is 14 bars, although other time periods can be used. ADX can be used on any trading vehicle such as stocks, mutual funds, exchange-traded funds and futures.
ADX is plotted as a single line with values ranging from a low of zero to a high of 100. ADX is non-directional; it registers trend strength whether price is trending up or down. The indicator is usually plotted in the same window as the two directional movement indicator (DMI) lines, from which ADX is derived.
When the +DMI is above the -DMI, prices are moving up, and ADX measures the strength of the uptrend. When the -DMI is above the +DMI, prices are moving down, and ADX measures the strength of the downtrend.
ADX values help traders identify the strongest and most profitable trends to trade. The values are also important for distinguishing between trending and non-trending conditions. Many traders will use ADX readings above 25 to suggest that the trend is strong enough for trend-trading strategies. Conversely, when ADX is below 25, many will avoid trend-trading strategies.
ADX Value Trend Strength
0-25 Absent or Weak Trend
25-50 Strong Trend
50-75 Very Strong Trend
75-100 Extremely Strong Trend
Hashharvest - ADX Shader v1ADX Shader overlay. Places a background overlay for ADX weak trend (>20 and <25) and places a background overlay for a string trend (>25). Will also show Positive DM and Negative DM crosses.

Hashharvest - ADX Indicator v1This is an ADX indicator with a kick. Also shows DM+ and DM-. Allows you to turn off these indicators. This also has horizontal indicators that tell with the trend maybe trendless (20), gaining (25), and trending (30). These indicators can change to accommodate your trading.

DMI ADXThis is the combination of ADX and DMI.
It will tell you about the trend strength.
In easy language Green is for bullish , red is for bearish ,and third line which is of blue and yellow will tell you about the trend strength doesn't matter in which direction. Blue will tell you that trend is getting strength and vice versa for yellow.
Keep an eye at crossovers.
New scripts r ready just doing some last testing will be out soon just wait for some more time :)
all the Scripts here will be free and always will be.
For my Indian friends a special surpriszzz is coming soon ;)
Hope you got my point.
Happy trading :)
15min Chart
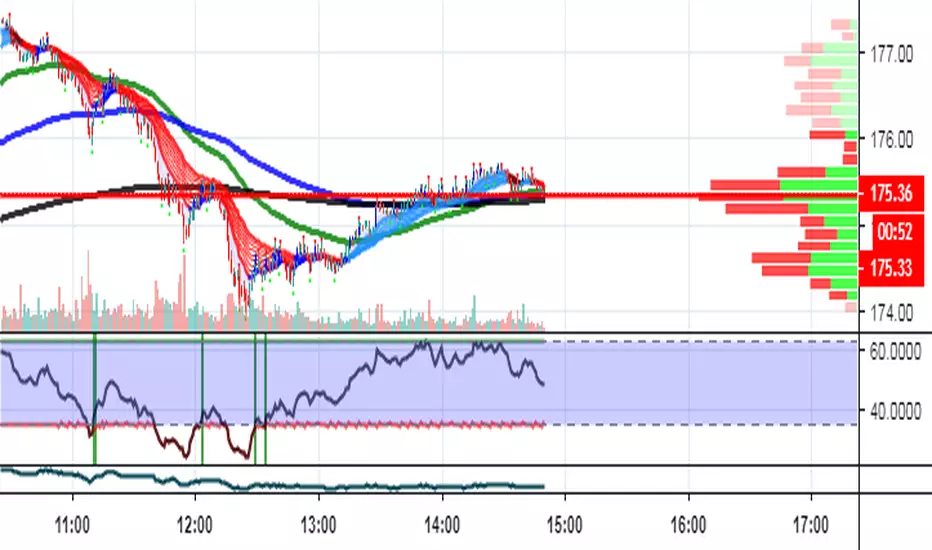
1Hr chart


Kolya Signals IntegrateScript en fase de prueba.
ADX DMI, Stoch RSI, Fisher Transform, EMA, BB, VWAP

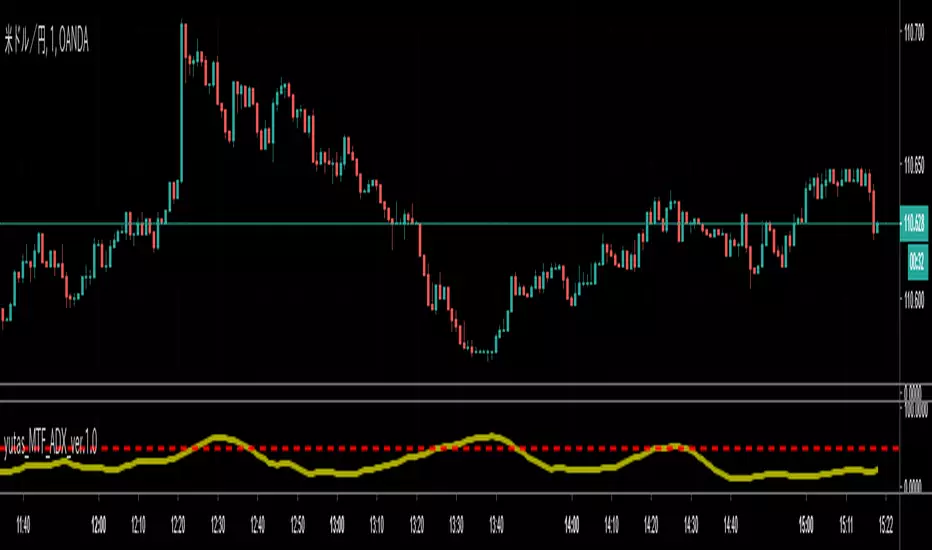
Zero Lag ADX [jwammo12]This uses Zero lag principles to ADX. The cyan line is the zero lag line and the grey line is the traditional ADX

Momentum and Trend Strength Entry Exit Pivot StudyUpdated version of previous Momentum Strength Entry Exit Pivot Study:
//************************
// @TheGeeBee - Credit where used
//
//Notes:
//
// Use 1,2,3,5 minute timeframes
// EMA Cross line and offset allows user to alter the sell characteristics where the candle low is above the EMA line and indicates a possible pre-pivot reversal
// Adjust Min and Max pivots based on risk profile
// Single Candle drawdown value represents the maximum size of a single red candle before an Exit Pivot is generated
// ADX Threshold inhibits Pivots when trending signal is below the threshold value
// Percentage Max drawdown since Entry Pivot allows the system to generate an Exit Pivot if the security has dropped X percent from the most recent Entry Pivot point
// Use Bars, Candles (preferred) or Heikin-Ashi
// Multiple Green Bars = BTFD
// Multiple Red bars = If you didn't already get out, do it now!
//
//************************
Allows for Alerts to be set for Entry and Exit Pivots.
[Delphi][CryptoNews Plus] RSI + DMI ADXRSI + DMI ADX
Inner Version 1.0 07/02/2019
Developer: iDelphi
07/02/2019 Added RSI
07/02/2019 Added ADX

ADX & DI in one lineThis is the standard ADX & DI indicator, but combined in a single line, changing color when a trend changes and changing value when the trend is strong.

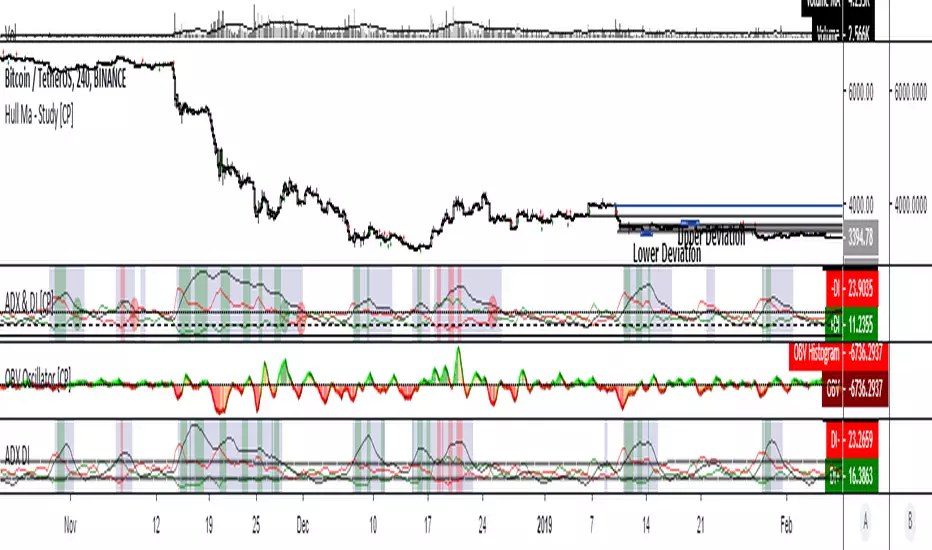
Strength & Directional Movement [CP]This my version of the ADX & DI indicator, fixed the code, ported to Pine Script v3 and loaded up with filters for your smoothing pleasure.
I have some info below on how to read this indicator, be sure to take a look!
Wilder’s DMI (ADX) consists of three indicators that measure a trend’s strength and direction.
Three lines compose the Direction Movement Index (DMI): ADX (black line), DI+ (green line) and DI- (red line).
The Average Directional Index (ADX) line shows the strength of the trend. The higher the ADX value, the stronger the trend.
According to Wilder, a trend is present when the ADX is above 25. DMI values range between zero and 100.
The Positive Directional Indicator (+DI) and Negative Directional Indicator (-DI) show the current price direction.
When the DI+ is above DI-, current price momentum is up.
When the DI- is above DI+, current price momentum is down.
DI Crossovers:
Traders could enter a long position when the DI+ line crosses above the DI- line and set a stop-loss order under the current day’s low.
When the DI- line crosses above the DI+ line, traders could place a short position with a stop above the high of the current day.
Irrespective of whether the trader takes a long or short position, the ADX should be over 25 when the crossover occurs to confirm the trend’s strength.
When the ADX is below 20, traders should use trading strategies that exploit range bound conditions
DI Contractions and Expansions:
The DI+ and DI- line move away from each other when price volatility increases and converge toward each other when volatility decreases.
Short-term traders could enter trades when the two lines move apart to take advantage of increasing volatility.
Swing traders might accumulate into a position when the lines contact in anticipation of a breakout.
The +DI generally moves in sync with price, which means the +DI rises when price rises, and it falls when price falls.
It is important to note that the -DI behaves in the opposite manner and moves counter-directional to price.
The -DI rises when price falls, and it falls when the price rises. This takes a little getting used to.
Just remember that the strength of a price move up or down is always recorded by a peak in the respective DMI line.
Reading directional signals is easy. When the +DI is dominant and rising, price direction is up.
When the -DI is dominant and rising, price direction is down. But the strength of price must also be considered.
DI strength ranges from a low of 0 to a high of 100. The higher the DI value, the stronger the prices swing.
DI values over 25 mean price is directionally strong. DI values under 25 mean price is directionally weak.

ADX Suavizado + DMI com Periodo RDNAdicione rafdourado para maiores informações de uso ou dicas para aprimoramento

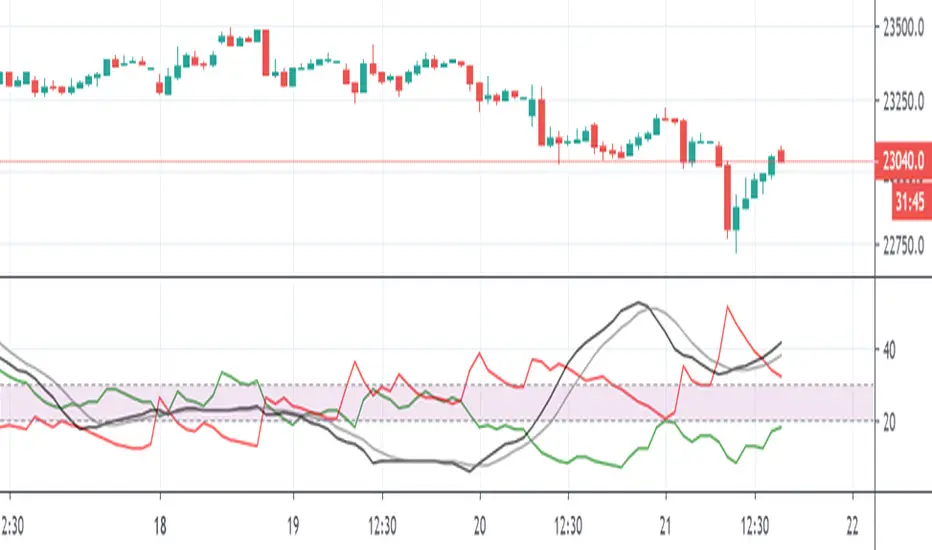
ADX +- DiThis Adx +-Di is just a complete version of what the ADX is supposed to signal.
So you have:
15 (contraction), 20 (threshold), 30 (expansion), 40 (resistance) levels.
Below 20 the price is not trending
Above 30 the price is trending
Below 15 price has been in contraction for too long
Between 20 and 30 price is in a "transition zone".
I finally added a "Resistance" level (40), which has to be adapted to best represent the historical levels where price usually encounters resistance, and where the price can be declared "overtrending", which means a return to lower levels is likely to happen.
I've chosen mild colors, and set the Adx Color to White, because I use black background, you can easily change that.
Enjoy
-Maurice

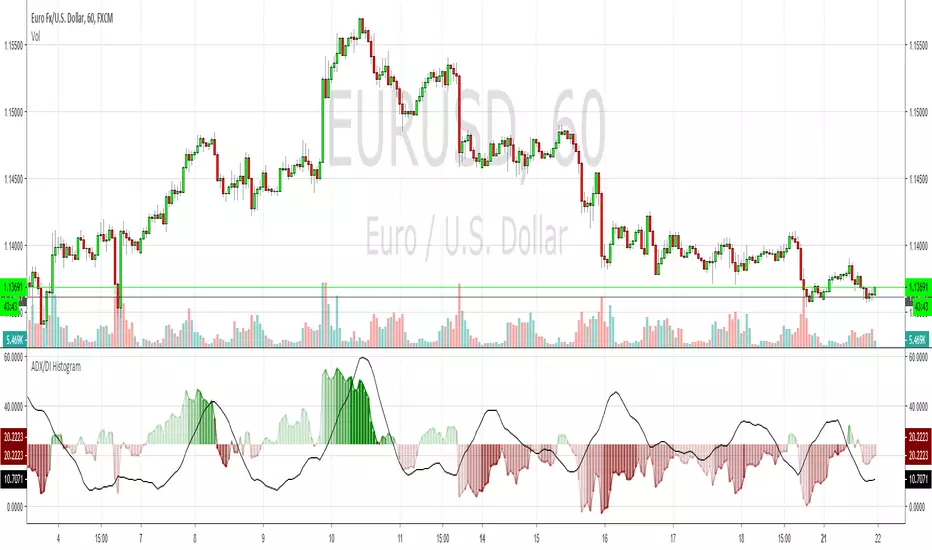
ADX & DI HistogramThis bad boy shows the same info as a normal ADX & DI but I've endeavoured to remove a lot of the confusion. I also added red/green colour gradients to show how much ADX is trending, the darker the colour, the stronger the trend. This should help to avoid the upsidedowniness and confusion I've always found with the original. I made this a while ago and have made a few changes recently but I can't remember where I go the basic ADX code from, so credit to whoever that was. Enjoy
ADX Crossover + BarColor v0.1Цвет бара показывает текущий тренд. Красный - падающий, зеленый - растущий. Желтый знак показывает начало или усиление тренда, флаг - завершение тренда, начало консолидации или следующего тренда

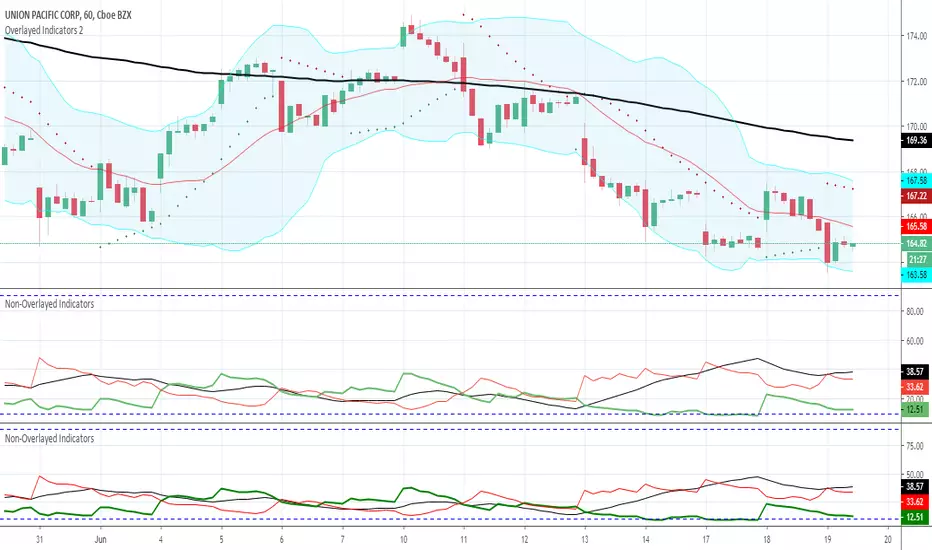
ADX & DI with Long + Short ConditionsMy version of the ADX & DI Indicator with an extra theshold and adjustable long and short conditions.
A green background (long) will appear when the ADX is rising, the DI+ is falling and the DI+ is below the (new) lower threshold.
A red background (short) will appear when the ADX is rising, the DI- is falling and the DI- is below the (new) lower treshold.
You can adjust the tolerance for the lower threshold in the settings of the indicator.