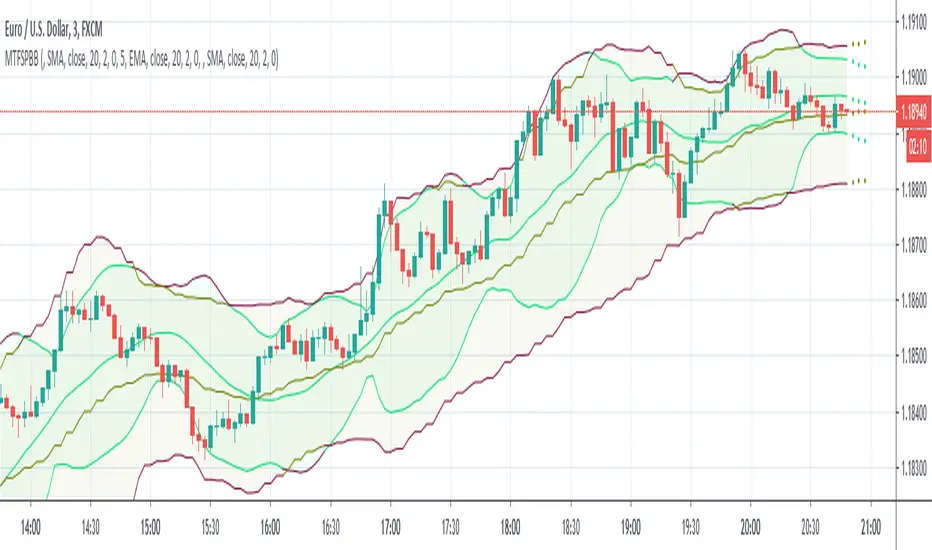
MultiTimeFrame Shifting Predictive Bollinger BandsThis is the optimized version of my MTFSBB indicator with capability of possible bands prediction in case of negative shifting (to the left).
Make me happy by using it and sending me your ideas about the prediction.
BB
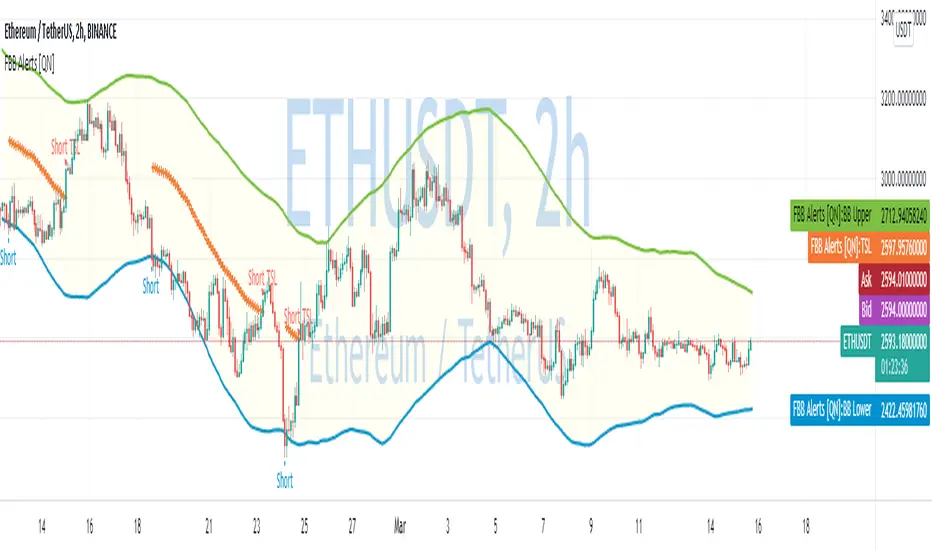
Fibonacci Bollinger Bands Alerts [QuantNomad]These are alerts for my Fibonacci Bollinger Bands Strategy. You can find more details and strategy description in it:
It's a pro indicator, you can have access to it for a small fee. Link to my PRO indicators you can find in my signature.
Disclaimer
Please remember that past performance may not be indicative of future results.
Due to various factors, including changing market conditions, the strategy may no longer perform as good as in historical backtesting.
This post and the script don’t provide any financial advice.
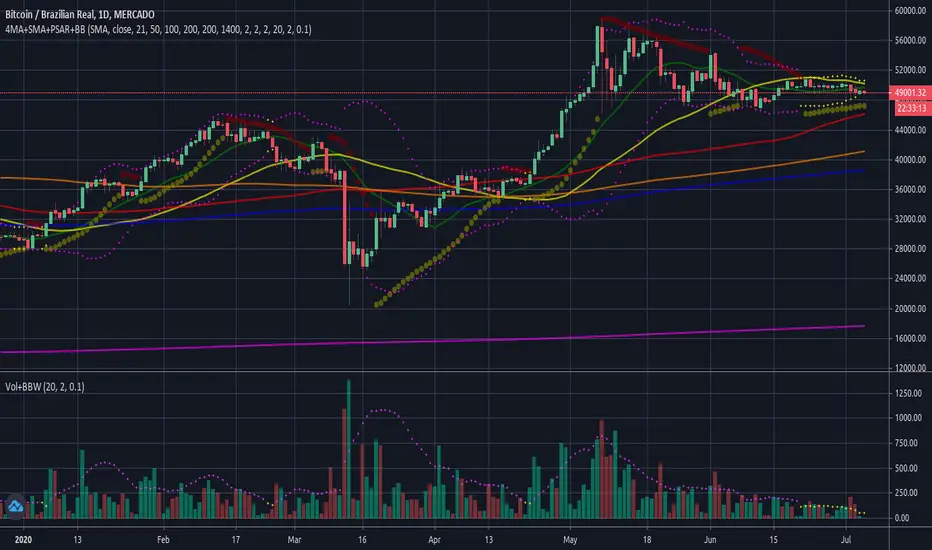
Double BB + Multi Ema Use this indicator to identify the market trend, possible dynamic Supports or Resistances and possible setbacks or corrections.
Take the Moving Averages (50,75,100,200) as a reference to identify if the market is bullish or bearish.
Have as reference the Moving Averages (8,15,20,25) as possible dynamic Supports or Resistances.
Have the BB as a reference, to identify possible setbacks or changes in trends.

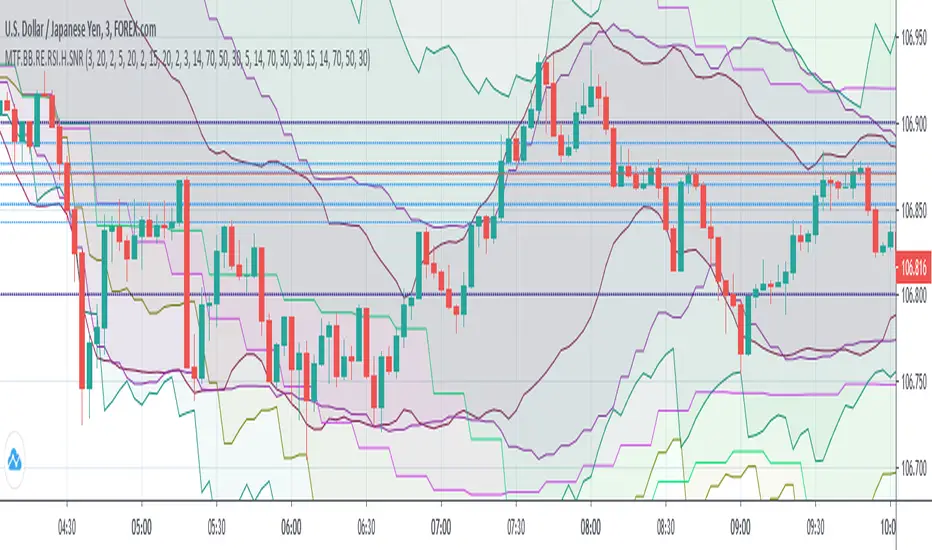
(MTF) Bollinger Bands + RE RSIs + Hidden Supports & ResistancesI merged some of my previous written indicators, because a combination of multi-timeframe Bollinger Bands, RE RSI and Resistance/Support levels could help a lot.
Don't forget to add my other useful indicator (Classical SnR) to the chart to maximize your profit!
VI BB RSI CRSI MFI - All In OneThis script simply creates a combo of some indicators I have found to be useful to visualize together.
Its fairly simple to use... buy the red and sell the green. The red and green 'zones' are VI indicator plus and minus using color to identify instead of plotting the lines and creating more mess for us.
The blue line is our BB B%... and the solid lines are the buy and sell thresholds.
The yellow line is our RSI, and the dotted lines are the thresholds.
The orange CRSI line is for intrazone (red or green VI zone) trades.. for instance, buying in the sell zone and then selling again (dead cats) and vice versa.
Lastly the purple MFI plot can be useful in identifying trend reversals.
This is not secret code, its free for everyone to use. If you find that it is too cluttered, you can simply comment out the plot function for that indicator to disable the ones that you find most cluttering.
Feedback is appreciated, along with ideas or suggestions.. cheers and happy trading!

The Complex"Red Line" vs Simple"White Line" Moving Average "BetaThis is my 2nd real attempt at an indicator for tradingview...
I have made this using the BTC/USD chart for coinbase, but this should work for any chart on the site/app...
It seems to go well with the "MACD" if you do change the input for the MACD, I know it shows up with "The Complete vs Simple Moving Average" two times... And they do give different outputs, so it's up to you to see what fits you best... One way you can use it is, use one line as a get "Ready" and the other one to "Sell" on any time frame, but I look longer and then look shorter to make my calls, I hope that makes sense to you as a reader...
So let me know what you think about this and happy trading...
Justin

MultiTimeFrame Shifting Bollinger BandsJust 3 Bollinger Bands with different adjustable timeframes plus shifting (left/right) capability and non-integer deviation values.
I wrote this because I couldn't find the perfect BB indicator that matches my needs. Feel free to use it.

Bollinger Bands Plus [xdecow]Bollinger bands with the option to use different types of moving averages.
-SMA
-EMA
-RMA
-WMA
-VWMA
-SWMA
-DEMA
-HMA
-SMMA
-T3
-TEMA

EMAs + BB by Miladythe moving averages used are EMA (25,50,100,200), bolinger bands (20,2),
This strategy is based on waiting for the point of overbought or oversold that exceeds the bolinger bands, if you are rejecting one of the emas in favor of the trend is more effective, since additional confirmations of the gut in stochastics are expected when indicating The flag, used at all times, is very useful for the options market and for scalping

WhiteSRSI
This indicator, combines stochastic and rsi of different timeframes, is convenient when used on younger timeframes.

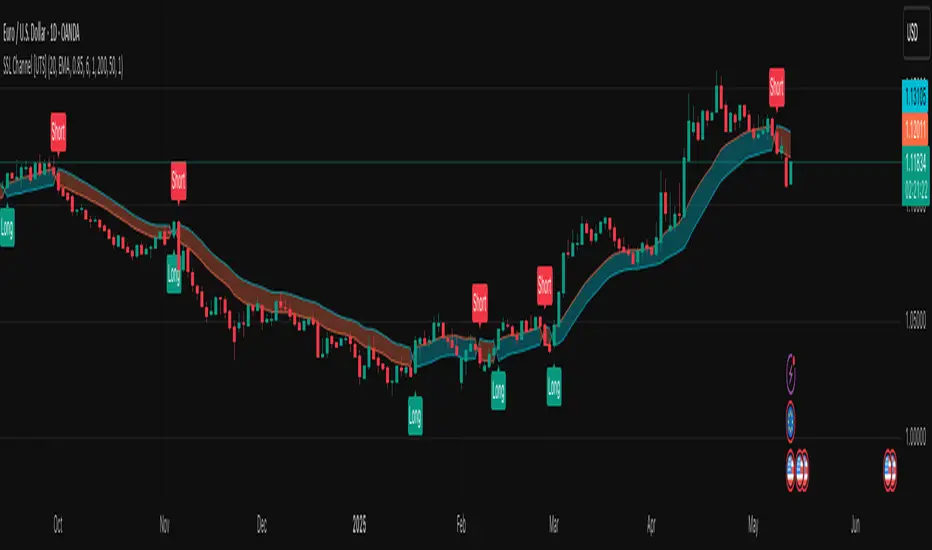
Uber SSL Channel [UTS]The SSL channel is a mighty breakout and trend-following indicator.
It is assumed as TOP 100 Forex indicator and was featured by VP of No Nonsense Forex.
General Usage
A SSL Moving Averages cross (color changes as well) is assumed as ENTRY signal and the trader can open a position following the trend direction.
Such a signal is also always an EXIT signal for currently active trades.
Moving Averages
16 different Moving Averages are available:
ALMA (Arnaud Legoux Moving Average)
DEMA (Double Exponential Moving Average)
EMA (Exponential Moving Average)
FRAMA (Fractal Adaptive Moving Average)
HMA (Hull Moving Average)
JURIK (Jurik Moving Average)
KAMA (Kaufman Adaptive Moving Average)
Kijun (Kijun-sen / Tenkan-sen of Ichimoku)
LSMA (Least Square Moving Average)
RMA (Running Moving Average)
SMA (Simple Moving Average)
SuperSmoothed (Super Smoothed Moving Average)
TEMA (Triple Exponential Moving Average)
VWMA (Volume Weighted Moving Average)
WMA (Weighted Moving Average)
ZLEMA (Zero Lag Moving Average)
A freely determinable length allows for sensitivity adjustments that fits your own requirements.
Alerts
Traders can easily use the trend change signals to trigger alerts from:
Up Signal
Down Signal
Those values are > zero if a condition is triggered.
Alert condition example: "Up Signal" - "GreaterThan" - "0"

BB-levels_MTFThis indicator draws Bollinger Bands- levels from higher timeframes on the chart's right border as a horizontal support/resistance lines. BB(20)- levels are shown from timeframes MN, 2W, 1W, 1D, 4H and 1H.
Levels are shown both for Standard Deviation 1 (dotted BB25- and BB75- lines) and STD 2 (solid BB0- and BB100- lines), as well as SMA20 (blue BB50- line).
You can choose if you want to see only the lines or the labels also. And you can modify the line's length and width, and the label's position on the screen also.

Double EnvelopeDouble Envelope is an indicator that is created using two pairs of moving averages that determine the upper and lower levels of the price range. Envelopes are commonly used to help traders and investors identify extreme overbought and oversold conditions as well as trading ranges.
We advise you to use the indicator on the daily timeframe, it is there that the resolutions that are set by default work best.

VBF Trader PRO for BTC and altcoins with LONG and SHORT alertsThis script allows you to catch trend moves between BB critical levels (red and green zones on the chart) and very good for daily scalping ether for bitcoin or any altcoins to USDT or BTC trading pairs. Probability is very HIGH.

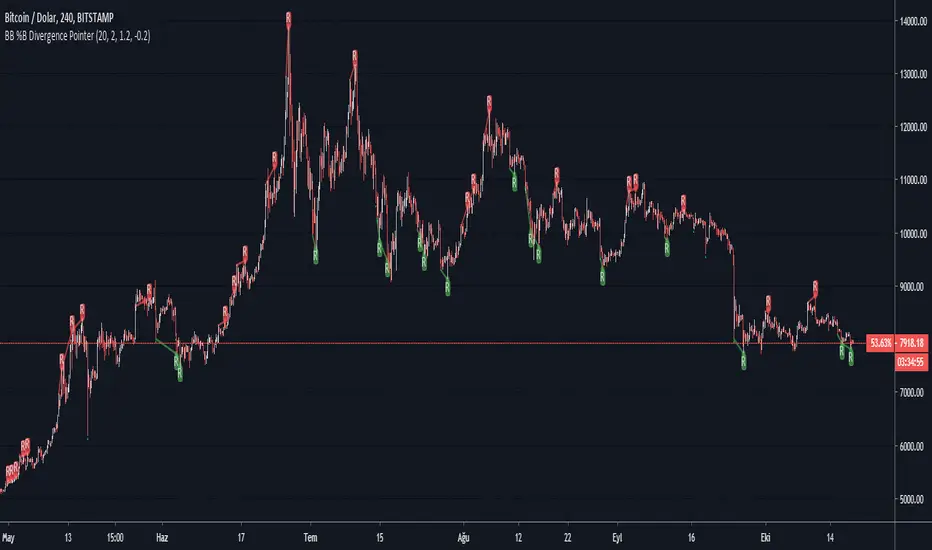
BB %B Divergence PointerThis script points regular and optionally hidden types of bullish and bearish Bollinger Band %B divergences on the chart by drawing the divergence lines and optionally labels.
Hidden divergence is disabled by default, it can be enabled over settings window.
Regular divergence is enabled by default, it can be disabled over settings window.
There is an options to display the price channel , bollinger band , Oversold and overbought levels additionally.
Supports alerts for all types of divergences.
InfoPanel Indicators microtrendThis panel shows current value and trend of some well knonw indicators. It may be usefull because you have all indicators in one panel only.
thanks to: RicardoSantos for his script of panel coding
Tradingview scripts
Please use comment section for any feedback.


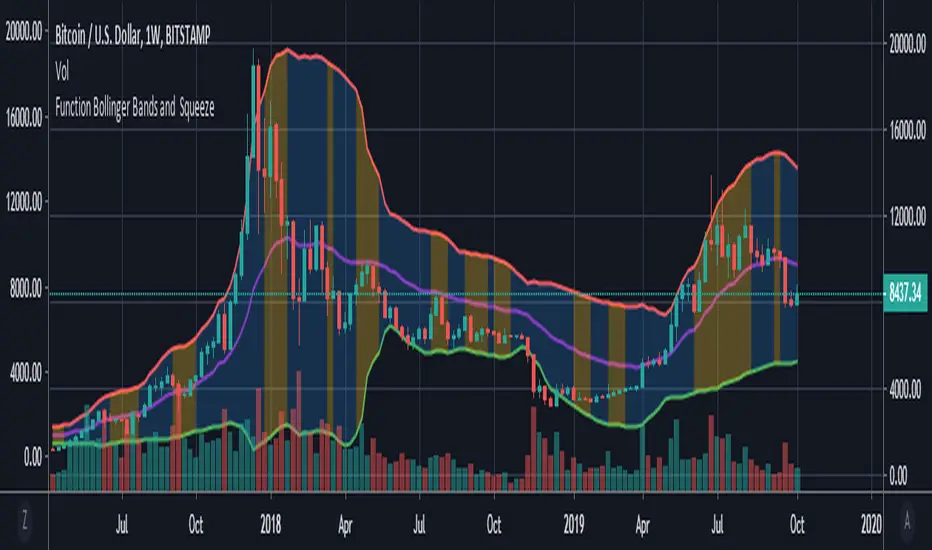
Function : Bollinger Bands and BBW Squeeze DetectorThis script shows Bollinger Bands function and want to detect Bollinger Band Width Squeeze with a successful, different perspective .
Bollinger Bands : You can specify the Bollinger Bands periods as mutable variables .
Bollinger Band Width Squeeze : First the Bollinger bands width was calculated.The width was then divided into levels using the money flow index.
Thus, the bollinger takes into account the available volume averages when calculating the band width mfi (Money Flow Index).
After this modelling, we can limit and color the lower limit and upper limits just as Relative Strength Index.
We can even put warnings on oversold areas if desired. Let's not forget that we are working with width rather than price.
By design, squeeze areas are defined directly above the Bollinger Bands with coloration. I think it is very practical and looks stylish.
I tried and found it quite successful and wanted to share it with users.
I came up with many ideas when I wrote this system, and I will share them very soon . I hope it will be useful to users and give new ideas.
Best regards.
Multi EMA/SMA with Bollinger Bands Combo 1.0This script provides:
5 regular EMAs
5 regular SMAs
3 multiple time frame EMAs
3 multiple time frame SMAs
Bollinger Bands
All features can be turned on/off and customized regarding color, lines, etc.
Excellent for TradingView users with limited or free accounts.

Multiple Moving AveragesThis is an indicator with 4 moving average slots and 6 exponential moving average slots
It also has bollinger bands and a volume weighted moving average slot
Feel free to edit this and add/remove some and publish your own
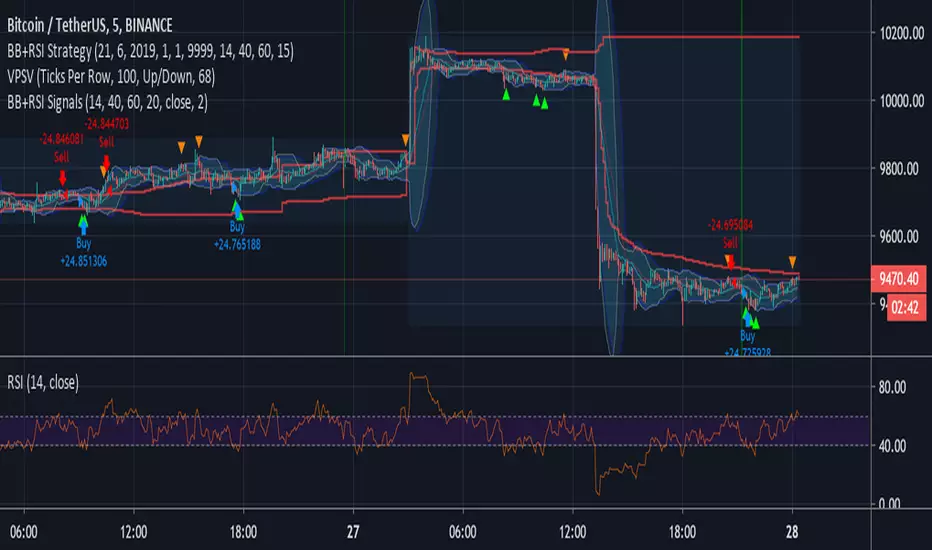
Bollinger + RSI Signals (by Bader Kamal)This idea originally by ChartArt on January 14, 2015 as Strategy, and I modify it to become as Signals on 26 July 2019.
This signals uses a modified RSI to sell when the RSI increases over the value of 60 (or to buy when the value falls below 40), with the classic Bollinger Bands strategy to sell when the price is above the upper Bollinger Band (and to buy when this value is below the lower band).
This signals only triggers when both the RSI and the Bollinger Bands indicators are at the same time in a overbought or oversold condition.