Kairi FlyerThis indicator shows the divergence between FX and spot price.
bitFlyer FXBTCJPY
XBTUSD
ETHUSD
ADA
BCH
EOS
LTC
TRX
XRP
Bitmex

Bitmex HunterBitmex Liquidation Hunter advise you with all the liquidation level from 100x 50x and 25x
so you can be a head of Bitmex market and trade each liquidation Bounce and take your profits
you will see how Bitmex bot and Bitmex Price its all the time moving from one liquidation level to the next
liquidation level hunting all the greedy and retail traders that FOMO in !!

Bitmex Liquidations (More levels)Author of the script is Jaqobs
Moving averages based on VWMA and Bitmex's leverage liquidation multipliers.
Added more levels so it is easier to visually see where scaled limit orders should be placed in order to catch extreme wicks.
Multi Timeframe Rolling Bitmex Liquidation LevelsTrack Bitmex liquidations levels in real-time with a rolling VWMA or VWAP basis.
Allows the input of a different time frame if you wish.

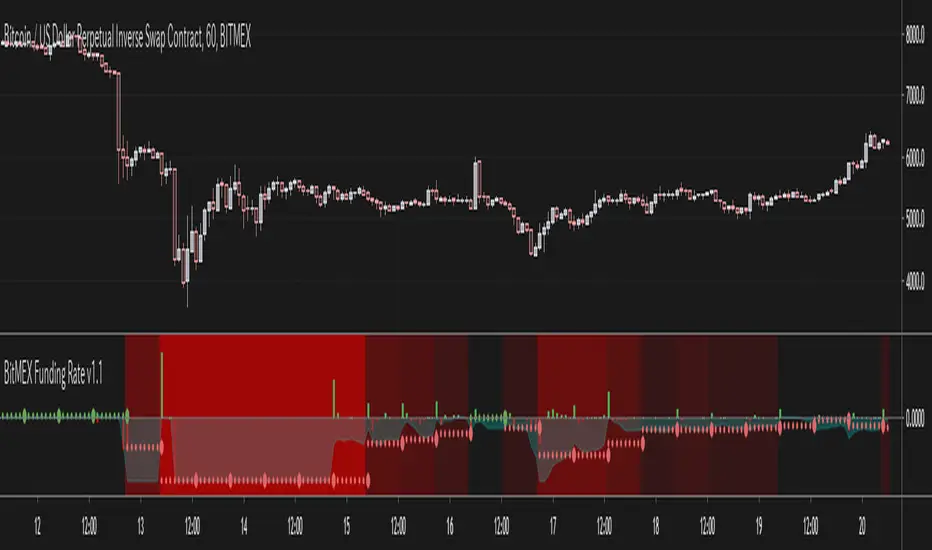
[ALERTS] CMYK-RMI-TRIPLE IIThis is the same previous script but without the Deribit index (for BITMEX users for example) that can give problems due to no connection with any of the 6 exchanges. Now use 'close' as source.
BTCUSD, XBTUSD, ...
Best time frame: 5 minutes
Alerts: 'once per bar'

Bitstamp BTC Horizontal 200 Week SMAsmall change to my horizontal 200 week SMA script.
Plots the latest 200 week SMA value from Bitstamp BTCUSD on the chart. I use it for the Bitmex chart, as Bitmex doesn't have enough history for a 200 week moving average.

TJ Money FlowTJ Money Flow, one of the most frequently used indicators by me.
This indicator is a modification of the CMF and it has great use and multiple interpretation possibilities.
I like treating it like the addition of StochRSI to RSI, just that TJ-MoneyFlow works like a "behind the scenes tool" of the volume indicator.
The first most important thing about it are the spikes. I like seeing a movement either up or down, confirming it with a spike in the TJ-MF.
The next sparkle about it is the modification of movements down and movements up.
When it moves down, it is in blue color, when it moves up it is in green color.
This lets me compare the candle direction to the Money Flow direction.
Bigger clouds of the same color indicate strength in the direction.
One more step that I like using the TJ-MoneyFlow for is for divergences. Either divergences on a cloud itself, regardless from its color.
Or divergences over two separate clouds. The idea is, if there is a significant trend, then it should be confirmed by the MoneyFlow.
Like and Follow me and you will find this page interesting because I am a TA expert and professional day trader in crypto since 2012 that does daily updates and new posts about the hottest and most discussed coins.
Cheers, TJ

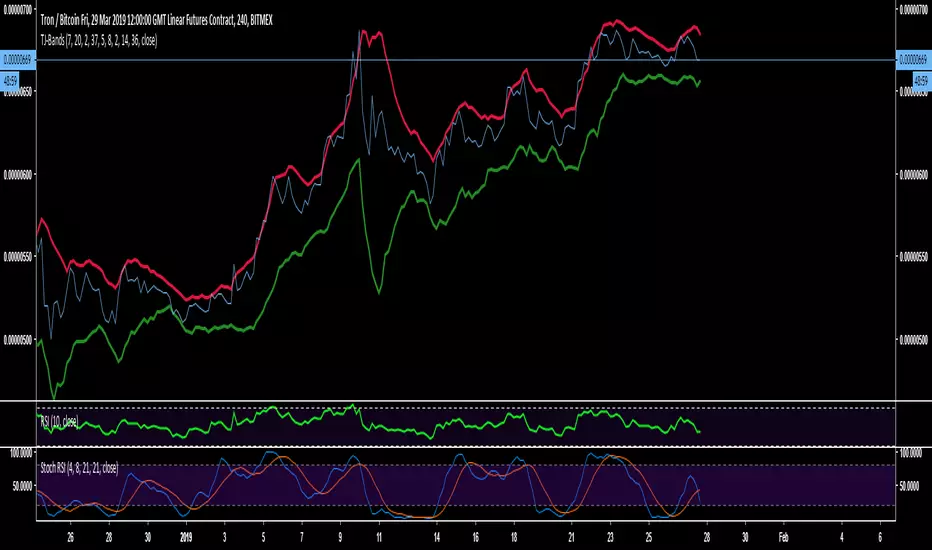
TJ-BandsDo you want to know
This indicator is a modified form of Bollinger Bands.
It works in a similar way like BB does. If you take a look at the "line" chart, you will clearly see, that a close outside these bands is very unlikely and works very well as a rejection line for the chart.
Since, the chart is likely to get rejected at the bands those have been indicated red at the top and green at the bottom.
The use is very simple, add it to your chart and there is nothing more to modify or change.
Like and Follow me and you will find this page interesting because I am a TA expert and professional day trader in crypto since 2012 that does daily updates and new posts about the hottest and most discussed coins.
Cheers, TJ
ck - Inner Bars Indicator with Alerts and Trailing Stop v1*** Please check out the matching Strategy to accompany this Indicator to allow you to fully backtest! ***
Inner Bar trading strategy is where the "inside" bar (or candle to the right) within a pair is smaller and within the high to low range of the prior bar, as this pattern tends to be somewhat predictable; especially in "chop" or sideways trading, it is useful to have in your tool box.
Features include:
Complimentary strategy you can add as well as the indicator to backtest and tune your settings before live trading
Trailing Stoploss to wring every cent from a trade
Clear Alert labels have been coded in for use with trading bots, 3commas is recommended.
Enable/Disable Shorts in addition to Longs
Visual chart shapes - Pink Triangle = Long, Purple Triangle = Short, Thin Green Arrow = Profit, Thin Red Arrow = Loss
Realtime Deal Status - Plotlines include Yellow = Entry Price, Green = Trailing Stop Profit, Red - Hard Stoploss
A further feature is that you can disable Shorts (therefore only Longing) for use with exchanges
that only allow you to Long, such as Binance & Coinbase.
Additionally, this Indicator will close a trade before opening the next, so a single exchange
account (BitMEX for example) is all that is required versus having separate accounts to long or
short on the same chart.
This strategy is intended to use $100 of capital, traded at 2.5% per order with 10x lev on Bitmex.
If you like my work, please use my referral links (you will receive discounts!)
3commas trading bots (now with Bitmex support and a lot more!) - 3commas.io
BitMEX - www.bitmex.com
If you have any comments or suggestions, please message me via TradingView.
Based on the core "Inner Bars" concept found at:
backtest-rookies.com
with original inspiration/idea from babypips.com


Bitmex Liquidation Bands - JDA simple visual representation of leverage implications in Bitmex.
Can be used as a guide to place stops or targets to as the chart tends to jump from one liquidation point to another, most of the time.
Different leverages can be selected.
If I made a mistake in the percentages, please let me know so I can correct it! ;-)
JD.
#NotTradingAdvice #DYOR

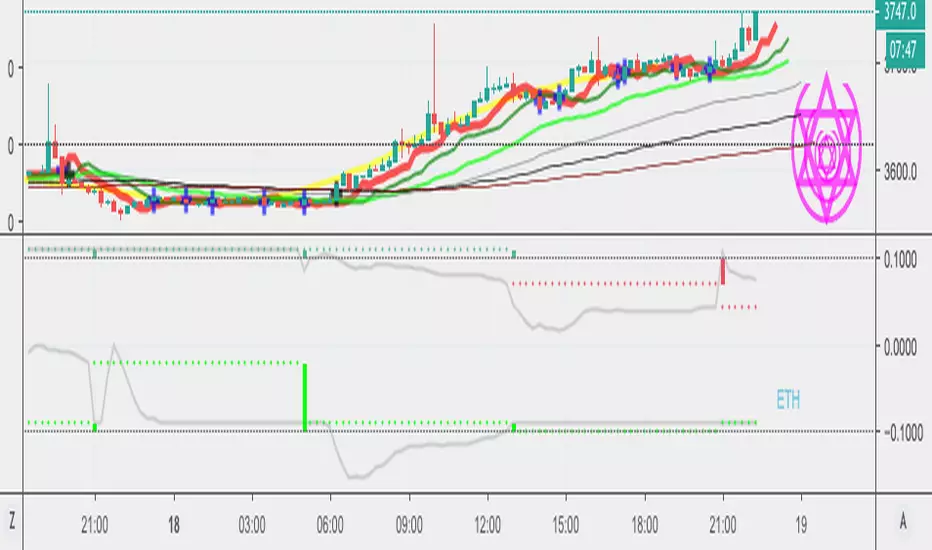
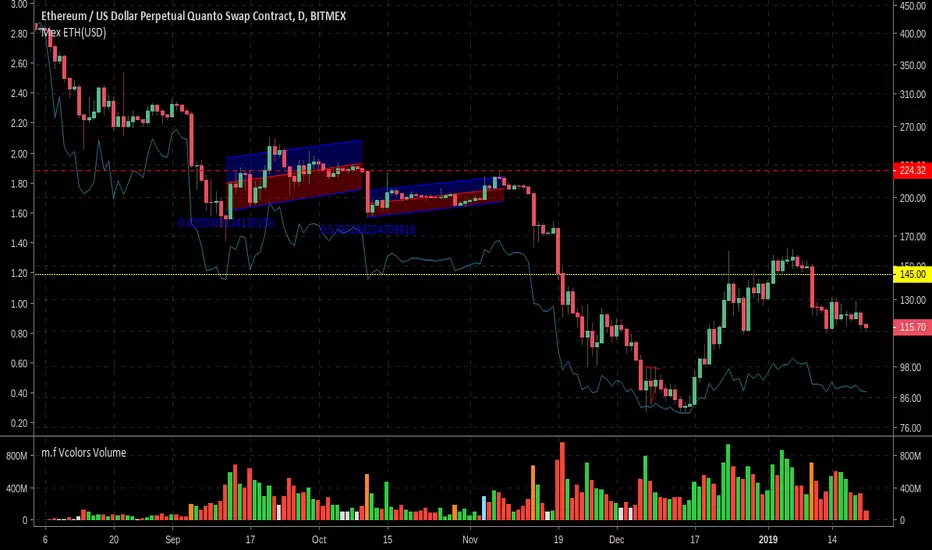
BitMEX ETHUSD contract value (USD)The ETHUSD Quanto Swap contract on BitMEX allows you to trade ETHUSD with Bitcoin put forward as collateral. However this means that 1 contract is not equal to 1 USD or 1 ETH, but instead varies according to the price of ETHUSD.
You can see the contract specs here www.bitmex.com and find more information here blog.bitmex.com
My advice is always to make sure you fully understand a derivative product before you trade it, however many of us may not have the acumen to actually understand how a quanto swap works. Nevertheless, we have to be aware that the value in USD of each contract depends on the price of Ethereum and also the price of Bitcoin at each point in time.
This tool will show you the value of a single ETHUSD contract in USD, but it solely for indicative purposes only. Your trade, your risk. I do not ask for any donations from your gains and I am not liable for any of your losses.
Source code is provided.
Note in the example image that the price of ETHUSD is plotted on a logarithmic scale but the indicative contract value is linear.
[ALERTS] CMYK-RMI-TRIPLEScript based on 3 RMI and the opening of long / short 'pyramiding' positions.
XBT:USD on BITMEX or BTC:USD on DERIBIT
Includes the calculation of the DERIBIT Index but can be used for any Crypto, the always overloaded BITMEX or even Forex, ...
Best timeframe: 5 minutes. A 5-minutes chart extended to the minimum is equal to a 1H chart.
¡NO REPAINT! : Alerts 'Once per bar'
It has take profit and it's so good that it doesn`t need Stop Loss
Original idea by MVPMC.

BitMEX Volatility Guppy [NeoButane]Guppy Multiple Moving Averages based on volatility moving averages.
Coloring rules from ChrisMoody's Guppy.
Guppy: www.investopedia.com
Volatility index moving average: etfhq.com
BitMEX volatility indexes: www.bitmex.com

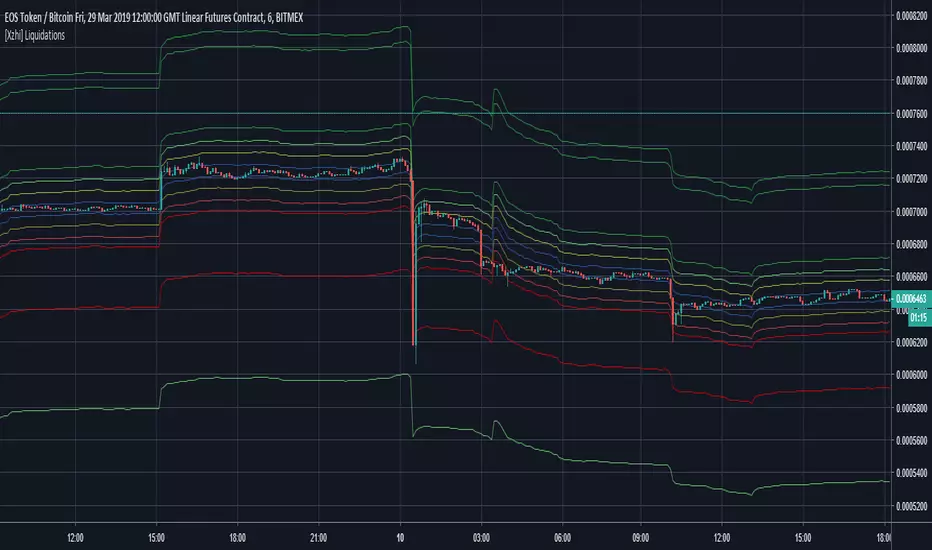
Liquinator V2 - Bitmex BTC Liquidation LevelsProjects precise liquidation levels for specific candle(s).
Warning! Levels do not indicate actual positions, only where they will be liquidated IF they exist. Which is a BIG unquantified IF!!!
Default number of candles for level range is 1 : Renders the liquidation range based on the range of that specific candle. Increasing the value will use the range of x number of candles.
If price action enters a liquidation level it will reduce/remove it.
Tried a number of different ways to pick out price action for the projected levels.
VCI (CCI of TR) - the default is the best at picking out single candles that you would want the levels for based on volatility.
I've left in the other experiments in if anyone want to play with it. You can combine them if it suits.
Bollinger can isolate based on price action (SDs from basis)
Volume option looks for SDs from the Volume SMA
TRIX for picking peak/valley tops/bottoms.
TB!G-Scalp Strategy [Alert]Scalping Crypto Assets Made Easy
TB!G-Scalp is a TradingView based alert and accompanying strategy PineV3 Script.
Backtest vs Realtime
When designing the algorithms for this strategy our focus was primarily on ease of use.This results in a beautiful yet easy to use scalping strategy. As input it takes a chart period and only one extra parameter for fine tuning. The backtest results are an accurate representation of it’s real-time behaviour.
What makes it tick?
Over the last 2 years we collected a lot of market data regarding Bull and Bear behaviours. This previous market behaviour echo’s into the current market trend.
By recognising these echo’s we are able to anticipate an upcoming micro reversal which eventually end up being a scalping strategy.
Interested
Access is provided to a limited amount of people and for the duration that is determined by it’s Alpha Decay Rate.
This ADR is expected to become problematic after 2.3 year of usage on a lot of 150 users.

MOSTKOD INDCATOR v1Hello to everyone,
The Mostkod Indicator gives us the buying and selling points.
Blue color on buy;
Red color on sale.
You can contact us for more information.
Kitaec ScalperHelper^2A simple script to see a trend direction on BTC. It paints background color in red and green, according to the current situation. It takes info from multiple timeframes and exchanges. Best to use it on 1-minute (max 3-minute) BitMEX XBTUSD perpetual chart. Please don`t try to countertrade it. Probable you can wait for a color to change and take your position accordingly then moving stoploss in the direction of your trade. Also you can see whenever there are price manipulations or not. Smooth color change is usual, and the sharp one is not, and probably its only manipulation. You can use its simplified version on any asset if you uncheck all the checkmarks in script color settings exept first and second, but for best performance you should also use 1 or 3-minute charts.

FOMO_Buy_Sell_Indicator_BasicFOMO Buy Sell Indicator (Basic Version)
Inexpensive alternative to FOMO (Full Version), best for those who wish to use FOMO but with limited functionalities.
Features
-> Conventional FOMO
-> Multiple EMAs
Doesn't Include
-> Short Term/Mid Term/Long Term Trade Signals
-> Holy Trend Line
-> Options to change parameters inside FOMO.

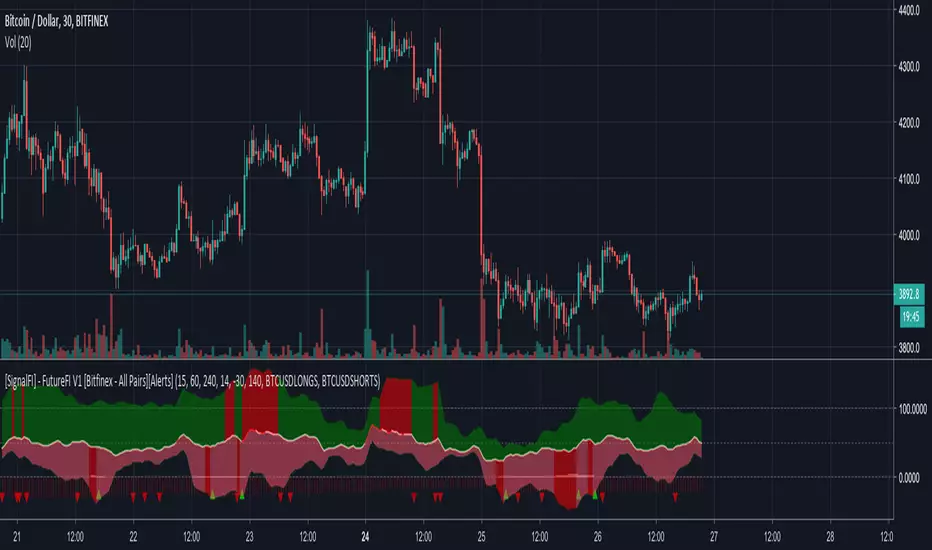
[SignalFI] - FutureFI V1 [Bitfinex - All Pairs][Alerts]FutureFI uses the futures (Long and Short) contracts housed on Bitfinex to provide a gauge for the relative difference and strength of interest in buying or selling Bitfinex assets based on total contracts created.
MUTLTIPLE-TIMEFRAME RSI FOR FUTURES CONTRACTS
DIFFERENCE STATISTICS COMBINED WITH RSI MOMENTUM
SIGNALS CAN BE APPLIED OUTSIDE OF BITFINEX
ALERTS VERSION Only for Jedi and Master Subscribers
Supported Assets:
LongAsset "BTCUSDLONGS","ETHUSDLONGS","XRPUSDLONGS","EOSUSDLONGS","LTCUSDLONGS","BTGUSDLONGS","ETPUSDLONGS","IOTUSDLONGS","ETCUSDLONGS","ZECUSDLONGS","NEOUSDLONGS","XMRUSDLONGS","ZRXUSDLONGS","OMGUSDLONGS","DSHUSDLONGS","BABUSDLONGS","BSVUSDLONGS","SANUSDLONGS","EDOUSDLONGS","TRXUSDLONGS","XLMUSDLONGS","BATUSDLONGS","VETUSDLONGS","SNGUSDLONGS"
ShortAsset "BTCUSDSHORTS","ETHUSDSHORTS","XRPUSDSHORTS","EOSUSDSHORTS","LTCUSDSHORTS","BTGUSDSHORTS","ETPUSDSHORTS","IOTUSDSHORTS","ETCUSDSHORTS","ZECUSDSHORTS","NEOUSDSHORTS","XMRUSDSHORTS","ZRXUSDSHORTS","OMGUSDSHORTS","DSHUSDSHORTS","BABUSDSHORTS","BSVUSDSHORTS","SANUSDSHORTS","EDOUSDSHORTS","TRXUSDSHORTS","XLMUSDSHORTS","BATUSDSHORTS","VETUSDSHORTS","SNGUSDSHORTS"
SignalFI was created to help traders and investors to effectively analyze the market based on the Golden Mean Ratio (Fibonacci numbers), plan a trade and ultimately execute it. To help inform and educate market decisions we developed a set of Trading Indicators which are available on TradingView , the most advanced and yet easy to use charting platform available on the web.
SignalFI indicators are just that, indicators. Our indicators are generally configured to use completely historical data (negating repaint), and we advise all alerts created with SignalFI indicators to be fired upon "close" of the current candle. Our indicators can provide valuable context and visualization support when performing market analysis and executing buy and sell decisions. However. we are not financial experts, and all information presented on this site or our other media outlets are for educational purposes only.
For subscription information, visit www.signalfi.net and follow us on twitter.