ST Order Block EngineAdvanced order block detection based on displacement and structural validation.Pine Script®指標由sahiltirth提供57
FX OSINT - Institutional Midnight Intelligence For ForexFX OSINT — Institutional Midnight Intelligence For Forex See Your FX Charts Like an Intelligence Briefing, Not a Guess If you’ve ever stared at EURUSD or GBPJPY and thought: Where is the real liquidity? Is this move sponsored by smart money or just noise? Am I buying into premium or discount? …then FX OSINT is designed for you. FX OSINT (Forex Open Source Intelligence) treats the FX market the way an analyst treats an investigation: Collect open‑source signals from price, time, and volatility. Map out liquidity, structure, and sessions in a repeatable way. Present them in a clean, non‑cluttered dashboard so you can read context quickly. No rainbow spaghetti. No 12 indicators stacked on top of each other. Just structured information, midnight visuals, and a clear read on what the market is doing right now. Why FX OSINT Exists Many FX traders run into the same problems: Overloaded charts – multiple indicators fighting for space, none talking to each other. Signals with no context – arrows that ignore structure, sessions, and liquidity. Tools not tuned for FX – generic indicators that don’t care what pair you are on. FX OSINT brings this together into one FX‑focused framework that: Understands structure : BOS/CHOCH, swings, and trend across multiple timeframes. Respects liquidity : sweeps, order blocks, and FVGs with controlled visibility. Reads volatility & ADR : how far today’s range has developed. Knows the clock : London, New York, and key killzones. Scores confluence : a 0–100 engine that summarizes how much is lining up. FX OSINT is built for traders who want structured, institutional‑style logic with a disciplined, midnight‑themed UI —not flashing buy/sell buttons. 1. Midnight Dashboard — Top‑Right Intelligence Panel This panel acts as your compact “situation room”: CONFLUENCE — 0–100 score blending trend alignment, volatility regime, sessions, liquidity events, order blocks, FVGs, and ADR context. REGIME — Low / Building / Normal / Expansion / Extreme, driven by ATR relationships, so you know if you’re in chop, trend, or expansion. HTF / MTF / LTF TREND — Higher‑, medium‑, and current‑timeframe bias in one place, so you see if you are trading with or against the larger flow. ADR USED — How much of today’s typical range has already been consumed in percentage terms. PIP VALUE — Approximate pip size per pair, including JPY‑style pairs. Everything is bold, legible, and color‑coded, but the layout stays minimal so you can: Look once → understand the context. 2. Structure, BOS, CHOCH — Smart‑Money‑Style Skeleton FX OSINT tracks swing highs and lows, then shows how structure evolves: Trend logic based on evolving swings, not just a moving average cross. BOS (Break of Structure) when price expands in the direction of trend. CHOCH (Change of Character) when behavior flips and the market structure changes. Labels are selective, not spammy . You don’t get a tag on every minor wiggle—only when structure meaningfully shifts, so it’s easier to answer: "Are we continuing the current leg, or did something actually change here?" 3. Liquidity Sweeps, Order Blocks & FVGs — The OSINT Layer FX OSINT treats liquidity as a key information layer: Liquidity sweeps — Detects when price spikes through recent highs/lows and then snaps back, flagging potential stop runs. Order blocks — The last opposite candle before a displacement move, drawn as controlled boxes with limited lifespan to avoid clutter. Fair Value Gaps (FVGs) — Three‑candle imbalances rendered as precise zones with a cap on how many can exist at once. Under the hood, boxes are managed so your chart does not become a wall of old zones: // Draw Order Blocks with overlap prevention if isBullishOB and showOrderBlocks if array.size(obBoxes) >= maxBoxes oldBox = array.shift(obBoxes) box.delete(oldBox) newBox = box.new(bar_index , low , bar_index + obvLength, high , border_color = bullColor, bgcolor = bullColorTransp, border_width = 2, extend = extend.none) array.push(obBoxes, newBox) Box limits keep the number of zones under control. Borders and transparency are tuned so you still see price clearly. You end up with a curated liquidity map , rather than a chart buried under every level price has ever touched. 4. Volatility, ADR & Sessions — Time and Range Intelligence FX OSINT runs a Volatility Regime Analyzer and an ADR engine in the background: Volatility regime — Five states (Low → Extreme) derived from fast vs. slow ATR. ADR bands — Daily high/mid/low projected from the current daily open. ADR used % — How far today’s move has traveled relative to its typical range. On the time side: Asia, London, New York sessions are softly highlighted with a single active background to avoid overlapping colors. Killzones (e.g., London and New York opens) can be emphasized when you want to focus on where significant moves often begin. Together, this helps you answer: "What time is it in the trading day?" "How stretched are we?" "Is expansion just starting, or are we late to the move?" 5. ICT‑Style Add‑Ons — BOS/CHOCH, Premium/Discount, and Confluence For modern FX / ICT‑inspired workflows, FX OSINT includes: BOS / CHOCH labels — Clear structural shifts based on swings. Premium / Discount zones — 25%, 50%, 75% levels of the daily range, so you know if you are buying discount in an uptrend or selling premium in a downtrend. Confluence score — A single number summarizing how many conditions line up in the current context. Instead of replacing your plan, FX OSINT compresses your checklist into the chart: Structure Liquidity Session / Time Volatility / ADR Higher‑timeframe alignment When these agree, the dashboard reflects it. When they don’t, it stays neutral and lets you see the conflict. How To Use FX OSINT FX OSINT is not a signal bot. It is an information engine that organizes context so you can apply your own plan. A typical workflow might look like: Start on higher timeframes (e.g., H4/D1) to form directional bias from structure, volatility regime, and ADR context. Move to intraday timeframes (e.g., M15/H1) around your chosen sessions (London and/or New York). Look for confluence : HTF / MTF / LTF trends aligned. Price in discount for longs or premium for shorts. Recent liquidity sweep into a meaningful OB or FVG. Confluence score at or above a level you consider significant. Then refine entries using BOS/CHOCH on lower timeframes according to your own risk and execution rules. FX OSINT aims to make sure you do not enter a trade without seeing: Where you are in the day (ADR and sessions). Where you are in the volatility cycle (regime). Who currently appears in control (structure and trend). Which liquidity was just targeted (sweeps and zones). Design Choices and Scope FX OSINT was designed around a few clear constraints: FX‑focused — Logic and filters tuned for FX majors, minors, exotics, and metals. It is intended for FX markets, not for every possible asset class. Open‑source — The full Pine Script code is available so you can read it, learn from it, and adapt it to your own workflow if needed. Clear themes — Two main visual styles (e.g., dark institutional “midnight” and a lighter accent variant) with a focus on readability, not visual noise. Chart‑friendly — Panels use fixed areas, session highlights avoid overlapping, and boxes are capped/pruned so the chart remains usable. FX OSINT is for only Forex pairs, not anything else! Hope you enjoyed and remember your Open Source Intelligence Matters 😉! -officialjackofalltradesPine Script®指標由officialjackofalltrades提供79
Smart Structure Breaks & Order BlocksOverview (What it does) The indicator “Smart Structure Breaks & Order Blocks” detects market structure using swing highs and lows, identifies Break of Structure (BOS) events, and automatically draws order blocks (OBs) from the origin candle. These zones extend to the right and change color/outline when mitigated or invalidated. By formalizing and automating part of discretionary analysis, it provides consistent zone recognition. Main Components Swing Detection: ta.pivothigh/ta.pivotlow identify confirmed swing points. BOS Detection: Determines if the recent swing high/low is broken by close (strict mode) or crossover. OB Creation: After a BOS, the opposite candle (bearish for bullish BOS, bullish for bearish BOS) is used to generate an order block zone. Zone Management: Limits the number of zones, extends them to the right, and tracks tagged (mitigated) or invalidated states. Input Parameters Left/Right Pivot (default 6/6): Number of bars required on each side to confirm a swing. Higher values = smoother swings. Max Zones (default 4): Maximum zones stored per direction (bull/bear). Oldest zones are overwritten. Zone Confirmation Lookback (default 3): Ensures OB origin candle validity by checking recent highs/lows. Show Swing Points (default ON): Displays triangles on swing highs/lows. Require close for BOS? (default ON): Strict BOS (close required) vs loose BOS (line crossover). Use candle body for zones (default OFF): Zones drawn from candle body (ON) or wick (OFF). Signal Definition & Logic Swing Updates: Latest confirmed pivots update lastHighLevel / lastLowLevel. BOS (Break of Structure): Bullish – close breaks last swing high. Bearish – close breaks last swing low. Only one valid BOS per swing (avoids duplicates). OB Detection: Bullish BOS → previous bearish candle with lowest low forms the OB. Bearish BOS → previous bullish candle with highest high forms the OB. Zones: Bull = green, Bear = red, semi-transparent, extended to the right. Zone States: Mitigated: Price touches the zone → border highlighted. Invalidated: Bull zone → close below → turns red. Bear zone → close above → turns green. Chart Appearance Swing High: red triangle above bar Swing Low: green triangle below bar Bull OB: green zone (border highlighted on touch) Bear OB: red zone (border highlighted on touch) Invalid Zones: Bull zones turn reddish, Bear zones turn greenish Practical Use (Trading Assistance) Trend Following Entries: Buy pullbacks into green OBs in uptrends, sell rallies into red OBs in downtrends. Focus on First Touch: First mitigation after BOS often has higher reaction probability. Confluence: Combine with higher timeframe trend, volume, session levels, key price levels (previous highs/lows, VWAP, etc.). Stops/Targets: Bull – stop below zone, partial take profit at swing high or resistance. Bear – stop above zone, partial take profit at swing low or support. Parameter Tuning (per market/timeframe) Pivot (6/6 → 4/4/8/8): Lower for scalping (3–5), medium for day trading (5–8), higher for swing trading (8–14). Increase to reduce noise. Strict Break: ON to reduce false breaks in ranging markets; OFF for earlier signals. Body Zones: ON for assets with long wicks, OFF for cleaner OBs in liquid instruments. Zone Confirmation (default 3): Increase for stricter OB origin, fewer zones. Max Zones (default 4 → 6–10): Increase for higher volatility, decrease to avoid clutter. Strengths Standardizes BOS and OB detection that is usually subjective. Tracks mitigation and invalidation automatically. Adaptable: allows body/wick zone switching for different instruments. Limitations Pivot-based: Signals appear only after pivots confirm (slight lag). Zones reflect past balance: Can fail after new events (news, earnings, macro data). Range-heavy markets: More false BOS; consider stricter settings. Backtesting: This script is for drawing/visual aid; trading rules must be defined separately. Workflow Example Identify higher timeframe trend (4H/Daily). On lower TF (15–60m), wait for BOS and new OB. Enter on first mitigation with confirmation candle. Stop beyond zone; targets based on R multiples and swing points. FAQ Q: Why are zones invalidated quickly? A: Flow reversal after BOS. Adjust pivots higher, enable Strict mode, or switch to Body zones to reduce noise. Q: What does “tagged” mean? A: Price touched the zone once = mitigated. Implies some orders in that zone may have been filled. Q: Body or Wick zones? A: Wick zones are fine in clean markets. For volatile pairs with long wicks, body zones provide more realistic areas. Customization Tips (Code perspective) Zone storage: Currently ring buffer ((idx+1) % zoneLimit). Could prioritize keeping unmitigated zones. Automated testing: Add strategy.entry/exit for rule-based backtests. Multi-timeframe: Use request.security() for higher timeframe swings/BOS. Visualization: Add labels for BOS bars, tag zones with IDs, count touches. Summary This indicator formalizes the cycle Swing → BOS → OB creation → Mitigation/Invalidation, providing consistent structure analysis and zone tracking. By tuning sensitivity and strictness, and combining with higher timeframe context, it enhances pullback/continuation trading setups. Always combine with proper risk management.Pine Script®指標由PakunFX提供407
Order Blocks-[B.Balaei]Order Blocks - **Description:** The Order Blocks - indicator is a powerful tool designed to identify and visualize Order Blocks on your chart. Order Blocks are key levels where significant buying or selling activity has occurred, often acting as support or resistance zones. This indicator supports multiple timeframes (MTF), allowing you to analyze Order Blocks from higher timeframes directly on your current chart. **Key Features:** 1. **Multi-Timeframe Support**: Choose any timeframe (e.g., Daily, Weekly) to display Order Blocks from higher timeframes. 2. **Customizable Sensitivity**: Adjust the sensitivity to detect more or fewer Order Blocks based on market conditions. 3. **Bullish & Bearish Order Blocks**: Clearly distinguishes between bullish (green) and bearish (red) Order Blocks. 4. **Alerts**: Get notified when price enters a Bullish or Bearish Order Block zone. 5. **Customizable Colors**: Personalize the appearance of Order Blocks to match your chart style. **How to Use:** 1. Add the indicator to your chart. 2. Select your desired timeframe from the "Multi-Timeframe" settings. 3. Adjust the sensitivity and colors as needed. 4. Watch for Order Blocks to form and use them as potential support/resistance levels. **Ideal For:** - Swing traders and position traders looking for key levels. - Traders who use multi-timeframe analysis. - Anyone interested in understanding market structure through Order Blocks. **Note:** This indicator is for educational and informational purposes only. Always conduct your own analysis before making trading decisions. **Enjoy trading with Order Blocks - !** Pine Script®指標由Behnam_Balaei_Official提供22339
Predictive Order Blocks [CryptoSea]The Predictive Order Blocks Indicator is a unique and innovative tool that enhances market analysis by identifying support and resistance blocks based on standard deviations from a median line. Unlike traditional indicators that rely solely on the close price, this indicator leverages the median line and standard deviations to form areas of interest, rather than targeting a single price point. This approach provides a more accurate representation of market structure, especially during periods of consolidation and expansion. Key Features Multi-Term Length Analysis: The indicator offers short, medium, and long-term settings, allowing traders to customise the analysis based on their preferred trading strategy and timeframe. This flexibility ensures that the tool is adaptable to various market conditions and trading styles. Standard Deviation-Based Order Blocks: The core functionality of the indicator revolves around calculating standard deviations from a median line to form support and resistance blocks. These blocks provide a clearer and more reliable picture of market structure compared to single-point levels. By focusing on areas rather than exact price levels, the indicator helps traders identify zones where price is likely to react, leading to more informed trading decisions. Dynamic Box Creation: The indicator dynamically creates breakout boxes based on user-selected standard deviation ranges. These boxes are formed at the start of market expansion following periods of consolidation. This feature is particularly useful because it highlights key levels where price is likely to retrace after breaking out, providing traders with actionable insights during market transitions. Proximity-Based Gradient Colors: The indicator features gradient colors that change based on the price's proximity to the standard deviation bands. This visual aid helps traders quickly assess the current market condition and the potential significance of the support and resistance blocks. Adaptive Display Options: To accommodate different trading preferences, the indicator includes options to toggle the display of the trend line (median line) and the standard deviation bands. This flexibility allows traders to customise their chart view to match their analysis style, whether they prefer a more clutter-free view or a detailed breakdown of market levels. In the example below, the indicator shows the bands compressing during a period of consolidation, highlighting the potential for a breakout. How it Works Median Line Calculation: The indicator calculates the median line using a user-defined period. This line serves as the central reference point from which the standard deviations are calculated. By using the median line instead of just the close price, the indicator provides a more stable and reliable baseline for identifying support and resistance areas. Standard Deviation Bands: Around the median line, the indicator calculates multiple standard deviation bands. These bands represent areas where price is statistically likely to find support or resistance. By focusing on these areas, traders can better anticipate where price might react, rather than relying on arbitrary levels. Dynamic Box Creation and Expansion Detection: The indicator monitors the compression and expansion of the standard deviation bands. During periods of low volatility (squeeze), the bands compress, indicating consolidation. Once the bands start expanding, it signals the potential for a breakout. At this point, the indicator dynamically creates predictive order blocks based on the selected standard deviation range. These blocks highlight key levels where price might retrace or react, providing traders with valuable entry and exit points. Color-Coded Proximity Alerts: To further enhance usability, the indicator uses color gradients to indicate how close the current price is to the calculated bands. This visual representation helps traders quickly assess the potential significance of the price's current position relative to the support and resistance areas. In the example below, the indicator shows the bands expanding with the price, triggering the formation of the predictive order block. In the final example, the price retraces into the order block before bouncing back to the upside, demonstrating the effectiveness of the identified support area. Alerts Trend Line Alerts: The indicator provides alerts when the price crosses above or below the trend line (median line). This feature is crucial for traders looking to identify potential trend changes early, allowing them to act quickly on emerging opportunities. Band Alerts: Alerts are also triggered when the price crosses above or below the upper or lower bands for each standard deviation level. This helps traders identify potential breakout or breakdown scenarios, ensuring they are notified of significant market movements as they happen. Customisable Alert Conditions: To cater to different trading strategies, the indicator allows users to set alert conditions for each standard deviation band and the trend line. This level of customisation ensures that traders receive alerts that are relevant to their specific trading style and market analysis. Application Strategic Decision-Making: The Predictive Order Blocks Indicator assists traders in making informed decisions by providing detailed analysis of potential breakout zones. By identifying key support and resistance areas, the indicator helps traders plan their entries and exits with greater precision. Trend Confirmation: The indicator reinforces trading strategies by identifying key levels where price is likely to react. This confirmation is crucial for traders looking to enter trades with higher confidence. Customized Analysis: The indicator adapts to various trading styles with extensive input settings that control the display and calculation of order blocks. Whether you're a day trader, swing trader, or long-term investor, the indicator can be tailored to meet your specific needs. Visual Clarity: With customizable color settings and display options, the indicator enhances chart readability, allowing traders to quickly and easily interpret market data. The Predictive Order Blocks Indicator by CryptoSea is an invaluable addition to a trader's toolkit, offering depth and precision in market trend analysis to navigate complex market conditions effectively. Pine Script®指標由CryptoSeaTV提供393
Pivot Order Blocks// How it Works \\ Order Blocks based on pivot reversal candle When a pivot High or Pivot Low is found and confirmed, a box will be plotted on the open and close values of that pivot candle // Settings \\ In the settings you have the ability to change the distances required to confirm an pivot High or Low These are the lengths where the script checks to see if it is at its local high or low. You also have the ability to change the amount of candles the box stretches over as well as the colors of the bullish and bearish boxes // Use Case \\ Pivot points often provide Support and Resistance points on their own, one way of marking up order blocks is by taking the pivot candle and marking that up as a resistance area where you could be looking for price to reverse // Suggestions \\ Happy for anyone to make any suggestions on changes which could improve the script, // Terms \\ Feel free to use the script, If you do use the script could you please just tag me as I am interested to see how people are using it. Good Luck!Pine Script®指標由TradingWolf提供已更新 5353 3.5 K
BB Order BlocksUsing the Bollinger Band to mark areas of Support and Resistance The scrip finds the highest and lowest levels of the bands to mark up futures areas of interest. If the High/Lows are being broken on the Bollinger band, or if the look back range has expired without finding new levels, the script will stop plotting them until new levels are found I have found many combinations which work well Changing the band length to to levels 20,50,100 or 200 seem to give interesting results Aswell as this changing the standard deviation to 3 instead of 2 marks up key levels. The look back range seems to show better levels on 50,100 and 200 Let me know any changes or updates you think you could make an impact , this was just a quick basic script I wanted to share.Pine Script®指標由TradingWolf提供99 1.2 K
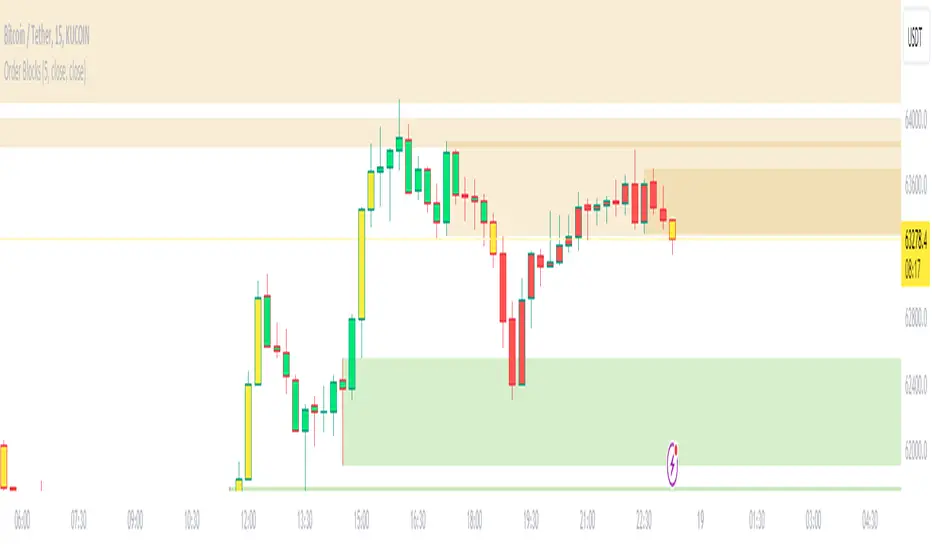
Order BlocksThis script analyses candle stick patterns and draws order blocks in real time, it is designed to be very easy to use and works on all markets. With a simple sensitivity configuration to control the range of candles in scope for analysis, the order blocks are automatically drawn and removed in real time if price action closes through an order block.Pine Script®指標由MarkMiddleton2020提供已更新 147147 4.3 K