Elev8+ Impulse Levels | Smart Support & ResistanceElev8+ Impulse Levels
Why does price reject specific levels that look "empty" on the chart?
The answer usually lies in the past. These are Institutional Impulses—footprints left behind by massive market moves that algorithms and smart money defend days or even weeks later.
The Elev8+ Impulse Levels indicator is designed to automatically reveal this hidden Market Structure. It scans for the "Perfect Storm" of Volume + Aggression and projects these critical levels forward for you.
🧠 How It Works (The Logic)
This is not a standard Support & Resistance tool. It does not look for swing highs or lows. Instead, it detects Market Intent.
The indicator highlights specific candles where:
Volume Spikes: Buying or Selling pressure exceeds the average by a significant multiplier.
Volatility Expands: The candle body is unusually large relative to recent price action (ATR).
When these two factors combine, it signals that a major player has entered the market. The closing price of this impulse becomes a "Line in the Sand" for future price action.
🎯 How to Trade This Strategy
We built a "Smart Line" feature into this tool that changes the visual style of the level based on price behavior. This helps you trade two distinct setups:
1. The Defense (Bounce)
Visual: 🟢 Solid Lines
The Setup: A Solid Line represents a Fresh Level that has never been touched.
Why it works: Institutions often defend their entry price. When price returns to a fresh Solid Line, look for a rejection or a bounce.
2. The Flip (Break & Retest)
Visual: ◌ Dotted Lines
The Setup: When a candle closes past a level, the indicator automatically dims it to a Dotted Line.
Why it works: This signals a "Breaker Block." If a Support level (Green) is broken, it often flips to become Resistance. Watch for price to come back and "kiss" the Dotted Line from the other side before continuing the trend.
✨ Key Features
Smart Visualization: Lines automatically switch from Solid to Dotted when broken, keeping your chart analysis clean and logical.
Impulse Coloring: The indicator highlights the specific candle that created the level, so you can see the origin of the move.
Fully Customizable: Adjust the sensitivity of the Volume and Size detection to fit any asset class (Crypto, Forex, Futures, or Stocks).
🚀 The Elev8+ Workflow
Elev8+ Impulse Levels gives you the "Map"—it tells you where the market is likely to react.
To know exactly when to enter, we recommend pairing this tool with our premium Elev8+ Reversal Indicator, which specializes in timing the entry signal precisely when price hits these high-value levels.
Build your narrative. See the structure. Elev8 your trading.
Disclaimer: Trading involves high risk. This tool is for educational purposes to assist with technical analysis and does not guarantee future performance.
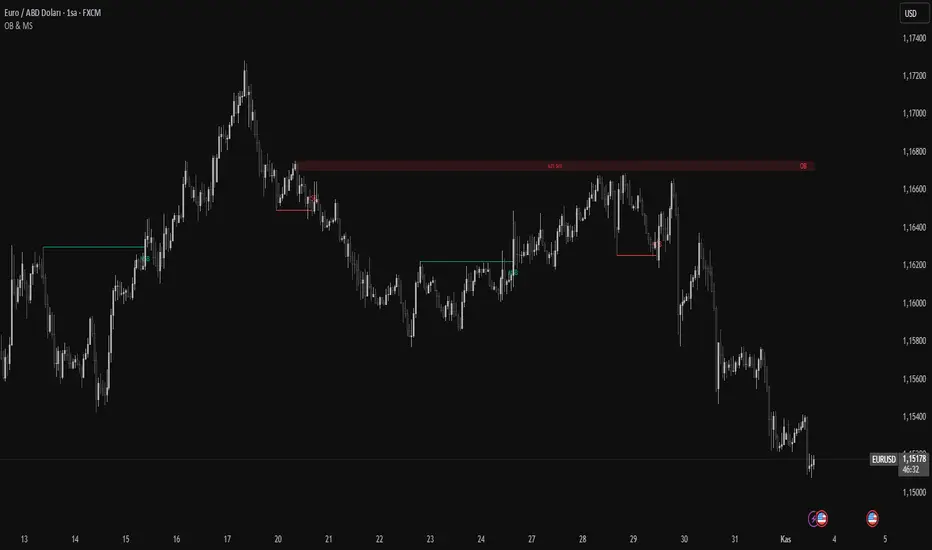
Breaker

Order Blocks & Market Structure (SMC)# Order Blocks & Market Structure (SMC)
## 📊 Overview
A Smart Money Concepts indicator that identifies institutional order blocks (OB), market structure breaks (MSB), and breaker blocks (BB) with volume-based strength analysis. Designed for traders seeking to identify institutional accumulation/distribution zones and market structure shifts.
## 🎯 Originality Statement
This indicator combines multiple analytical approaches into a unified system:
- **Multi-level OB strength classification** using volume spike detection and body ratio analysis (OB/OB+/OB++)
- **Automatic lifecycle tracking** that converts invalidated Order Blocks to Breaker Blocks with polarity reversal
- **Volume context integration** showing buyer/seller dominance percentage at block formation
- **Dynamic zone extension** that updates OB boundaries until price interaction or invalidation
- **Delayed touch alerts** (5-bar minimum) to filter premature retest signals
Unlike simple order block scripts that only mark zones, this tool provides strength assessment, volume analysis, and intelligent state management throughout the block lifecycle.
## ⚙️ Technical Methodology
**Market Structure Detection:**
Uses pivot-based swing point analysis to identify trend changes. When price closes above a pivot high (bullish MSB) or below a pivot low (bearish MSB), the structure is marked with horizontal reference lines.
**Order Block Identification:**
Searches the specified lookback period for the lowest low (bullish MSB) or highest high (bearish MSB). When a strong directional candle is found (opposite color to trend direction), its range becomes an OB zone.
**Strength Analysis:**
- Compares candle volume against 20-period SMA with configurable multiplier (1.2-3.0x)
- Calculates body-to-range ratio to assess candle strength (0.4-0.8 threshold)
- Assigns strength levels: Standard (no conditions), Strong (one condition), Premium (both conditions)
**Breaker Block Conversion:**
When price closes completely through an OB zone (bullish OB broken downward or bearish OB broken upward), the zone automatically converts to BB with reversed polarity and color.
## 📋 Features
**Market Structure (MSB):**
- Detects bullish and bearish structure breaks
- Configurable swing length (5-50 bars)
- Visual markers with horizontal lines
**Order Blocks (OB):**
- Three strength tiers: OB (standard), OB+ (strong), OB++ (premium)
- Volume percentage display (buyer vs seller dominance)
- Dynamic zone extension until invalidation
**Breaker Blocks (BB):**
- Automatic conversion from failed OBs
- Polarity tracking (bullish ↔ bearish)
- Fixed zones after conversion
## 🔧 Settings Documentation
**Market Structure Group:**
*Show Market Structure* - Enable/disable MSB detection and line drawing
- Default: ON
- When OFF: No structure lines or labels appear
*MSB Labels* - Display text labels at structure break points
- Default: ON
- Labels show "MSB" at the break candle
*Swing Length* - Lookback period for pivot point detection
- Range: 5-50 bars
- Default: 10
- Higher values = longer-term structure, fewer signals
- Lower values = short-term structure, more signals
*Bull Color* - Color for bullish elements (MSB, bullish OB, bullish BB)
- Default: #089981 (green)
*Bear Color* - Color for bearish elements (MSB, bearish OB, bearish BB)
- Default: #f23645 (red)
**Order Block Group:**
*Order Blocks* - Enable/disable OB detection and zone drawing
- Default: ON
- When OFF: No boxes appear (MSB lines still show if enabled)
*OB Strength* - Enable multi-level strength classification
- Default: ON
- When ON: Labels show OB/OB+/OB++ based on analysis
- When OFF: All zones labeled simply as "OB"
*Volume %* - Display buyer/seller volume percentage
- Default: ON
- Shows "X% Buy" or "X% Sell" inside zones
- Calculated over 10 bars from zone formation
*OB Lookback* - How many bars to search for OB candle
- Range: 5-30 bars
- Default: 10
- Searches for lowest low (bullish) or highest high (bearish) within this range
*Vol Threshold* - Minimum volume multiplier for strength upgrade
- Range: 1.2-3.0x
- Default: 1.5x
- Volume must exceed (20-period SMA × threshold) for OB+ or OB++
*Body Ratio* - Minimum body-to-range ratio for strength upgrade
- Range: 0.4-0.8
- Default: 0.6
- Candle body must be at least this proportion of total range for OB+ or OB++
## 📖 How to Use
**For Trend Following:**
1. Wait for MSB in your desired direction
2. OB forms in the breakout area (the institutional entry zone)
3. Price may immediately continue or pull back to retest OB
4. Enter on OB retest with "OB Touch" alert (after 5+ bars from creation)
5. Higher strength OB (OB+, OB++) indicates stronger institutional activity
**For Reversal Trading:**
1. Identify Breaker Blocks (former OBs that failed)
2. BB represents potential reversal zone with opposite polarity
3. Wait for MSB in BB direction for confirmation
4. Enter on pullback to BB zone
**Volume Analysis:**
- 70%+ Buy/Sell dominance = strong institutional bias
- 60-70% = moderate bias
- 50-60% = weak bias, use caution
**Optimal Conditions:**
- Works best on trending markets (4H, Daily, Weekly timeframes)
- Less effective in tight ranges or low-volume periods
- Major pairs/assets with good liquidity recommended
## 🔔 Alert Conditions (8 Types)
The indicator provides the following alerts:
1. **Bullish MSB** - Upward market structure break detected
2. **Bearish MSB** - Downward market structure break detected
3. **Bullish OB Created** - New bullish order block formed
4. **Bearish OB Created** - New bearish order block formed
5. **Bullish BB Created** - Bearish OB converted to bullish BB
6. **Bearish BB Created** - Bullish OB converted to bearish BB
7. **Bullish OB Touch** - Price revisited bullish OB (minimum 5 bars after creation)
8. **Bearish OB Touch** - Price revisited bearish OB (minimum 5 bars after creation)
Touch alerts include a 5-bar delay to avoid alerting on immediate continuation moves.
## ⚠️ Limitations & Risk Disclosure
**Known Limitations:**
- MSB signals can produce whipsaws in ranging or choppy markets
- Not all OB touches result in successful trades
- OB zones may be tested multiple times before activation
- Volume data may be unavailable or unreliable on some instruments/exchanges
- Strength analysis requires sufficient volume history
- Historical repainting: OB zones extend dynamically as price interacts with them
**Risk Considerations:**
This indicator is designed for educational and analytical purposes. It identifies potential institutional zones but does not predict price movement. Past identification of zones does not guarantee future trading success. OB and BB zones represent areas of interest, not guaranteed support/resistance. Always use proper risk management, combine with other analysis methods, and never risk more than you can afford to lose.
## 🎨 Visual Guide
**Colors & Symbols:**
- 🟢 Green boxes = Bullish Order Blocks / Bullish Breaker Blocks
- 🔴 Red boxes = Bearish Order Blocks / Bearish Breaker Blocks
- Horizontal lines = Market Structure Break levels
- "MSB" labels = Structure break points (above/below line)
- "OB" / "OB+" / "OB++" labels = Order Block strength (right side of box)
- "BB" labels = Breaker Block (converted from OB)
- "X% Buy/Sell" labels = Volume analysis (center of box)
**Box Behavior:**
- OB zones extend to the right as long as price interacts with them (not broken)
- When OB is invalidated, it stops extending and converts to BB
- BB zones remain fixed at their invalidation point
## 💡 Best Practices
- Focus on OB+ and OB++ zones for higher probability setups
- Confirm OB touches with price action (rejection wicks, engulfing patterns)
- Use multiple timeframe analysis (Daily OB + 4H entry)
- Avoid trading in the first 1-2 bars after OB creation (wait for touch alert)
- Consider volume % - avoid zones with <60% dominance
- Combine with other confluence factors (Fibonacci, support/resistance)
- Set realistic stop losses beyond the OB/BB zone
---
**Version:** 1.0
**Pine Script:** Version 6
**Category:** Smart Money Concepts, Order Flow, Market Structure
For questions or suggestions, use the TradingView comments section below.
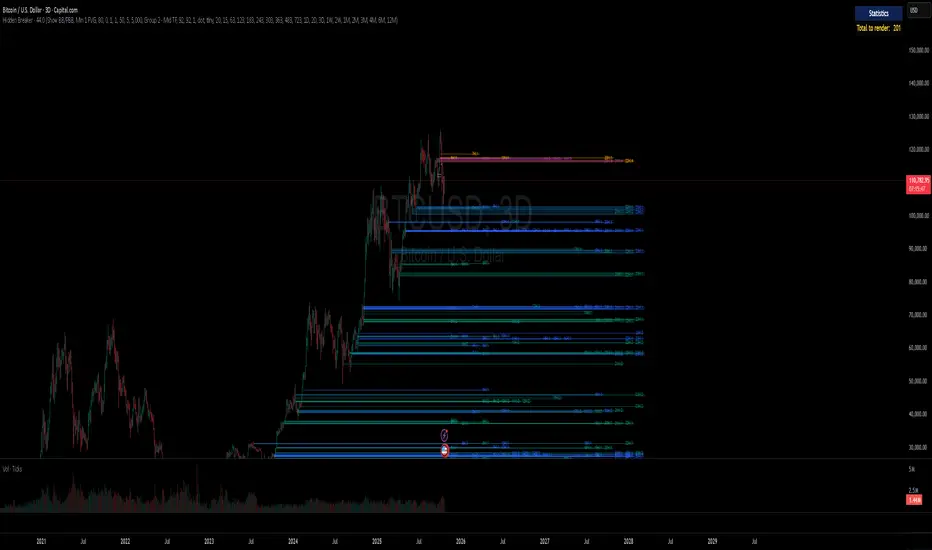
Hidden BreakerHidden Breaker
DESCRIPTION
The Hidden Breaker identifies Order Blocks and tracks their transformation when they interact with Fair Value Gaps. It displays both standard Order Blocks and those modified by FVG (Breaker Blocks) across multiple timeframes within a single chart view.
METHODOLOGY ORIGIN
This indicator is based on concepts from the MoneyTaur trading methodology, which focuses on identifying Order Blocks hidden behind Fair Value Gaps from the multi-timeframe perspective.
WHAT MAKES THIS UNIQUE
- Box Management System: User-controlled box allocation through dynamic filters, ensuring all detected blocks remain visible within Pine Script's 500 box limit. Users can manage which blocks to display through price range and filter adjustments.
- Creates unified columnar visualization
- Processes 70+ timeframes (incl custom)
- Tracks each block's complete lifecycle
KEY FEATURES
Order Blocks (OB): Detects engulfing candle patterns between candle bodies with customizable deviation tolerance.
Breaker Blocks (BB): Order Blocks (candle body) that crossed Fair Value Gaps by 100% without being touched by wicks.
Partial Breaker Blocks (PBB): Candle bodies that didn't fit 100% within an FVG or were partially mitigated by wicks. Min BB size in % after passing FVG is adjustable within filter.
Multi-Timeframe Analysis: Processes 70+ timeframes without repainting
Visual Organization: Displays blocks in columns by timeframe for easy comparison. Spacing is adjustable within menu.
FVG Counter: Shows interaction count (1-5) for each block
Statistics Table: Real-time monitoring of detected blocks
Price Range Filter: Manages Pine Script's 500 box limit effectively
HOW IT WORKS
The indicator uses a three-stage detection process:
Stage 1 - Order Block Detection:
Identifies engulfing patterns where one candle body fully engulfs the body of the previous opposite candle. The system allows for small price deviations. The detected zone spans from the open to close of the engulfed candle.
Stage 2 - FVG Interaction:
Monitors for Fair Value Gaps that occur when the candle's low is above the high from two candles ago (bullish gap) or when the high is below the low from two candles ago (bearish gap). When such a gap overlaps an existing Order Block, the system evaluates:
Checks whether the OB’s body is fully contained within the FVG range (passed 100% through it without wick contact) — shown as 1H | 1, where 1H is the timeframe and 1 the FVG count.
The percentage of the OB body retained within the FVG after zone adjustment is filter-controlled.
Directional bias is inherited from the FVG.
Blocks with multiple FVG interactions (counted 1–5+) allow filtering of BBs based on their FVG overlap frequency.
Stage 3 - Single or Multi-Timeframe Processing:
Collects data from multiple timeframes simultaneously, processes it without repainting, and displays horizontal boxes with timeframe labels arranged in vertical columns, where each timeframe occupies its own designated horizontal space for clear visual separation.
DETECTION CRITERIA
Order Block: Engulfing with body-to-body alignment within adjustable deviation tolerance
Breaker Block: OB that intersects with subsequent FVG. When filter is set to 100%, shows only BBs where the body fully passed through FVG without wick touches.
Partial Breaker Block (PBB): An Order Block partially intersected by an FVG or partially mitigated by a subsequent candle, narrowing the original Breaker Block range.
FVG validation: Gap between candles 1 and 3
VISUAL GUIDE
Green: Bullish Order Blocks
Red: Bearish Order Blocks
Blue: Bullish Breaker Blocks
Orange: Bearish Breaker Blocks
Teal: Bullish Partial Breaker Blocks
Purple: Bearish Partial Breaker Blocks
Numbers: FVG interaction count (1-5)
Percentages: Remaining unmitigated area
SETTINGS
Block Type Selection: Choose to display OB only, BB/PBB only
Deviation (%): Tolerance for engulfing pattern detection
Min Engulfing Impulse (%): Minimum required price movement for valid engulfing
FVG Filter: Set minimum FVG count required (1-5)
Min BB Size after FVG (%): Minimum remaining size of an BB after passing an FVG
Hide if Mitigated More Than (%): Visibility threshold for partially mitigated blocks
Price Range Filter (%): Limit Block detection to specific price ranges from current price
Price Range Axis (%): Offset reference point for price range
Timeframe Groups: Select from 6 predefined groups or custom timeframes
Max Bars to Scan: Historical lookback period (100-10000)
Replay Mode: used for historical backtesting and visual analysis for higher TF data.
TIMEFRAME GROUPS
Group 1: Minutes & Short Hours (5m-4H)
Group 2: Extended Hours (5H-23H)
Group 3: Days (1D-19D)
Group 4: Weeks (1W-12W)
Group 5: Months (1M-12M)
Group 6: 19 Custom timeframes
USAGE NOTES
Select appropriate timeframe groups for your analysis style
Adjust deviation and impulse settings based on market volatility
Use FVG filter to focus on blocks with multiple gap interactions
Monitor the statistics table to ensure box count stays under 500. If approaching limit, narrow the price range filter
Each box shows its description aligned vertically by timeframe
TECHNICAL SPECIFICATIONS
Pine Script Version 6
Default scan range: 5000 historical bars
Maximum 500 boxes per chart (Pine Script limitation)
Non-repainting calculations
Compatible with all markets and timeframes
Optimized memory management for multi-timeframe processing
TERMS AND CONDITIONS
This indicator and its documentation do not constitute financial or investment advice.
Users should make independent trading decisions and accept full responsibility for their outcomes.
Use of this tool implies that you understand the risks of financial markets and agree that the author is not liable for any loss or damage arising from its use.
This indicator is designed solely as a visualisation tool to assist with chart analysis.
It does not teach, promote, or automate any specific trading strategy, concept, or methodology.
All visual elements — such as OBs, BBs, PBBs, FVGs, and related interactions — are intended to support manual study and backtesting, not to generate trading signals.
Past performance does not guarantee future results. By using this tool, users agree to these terms.
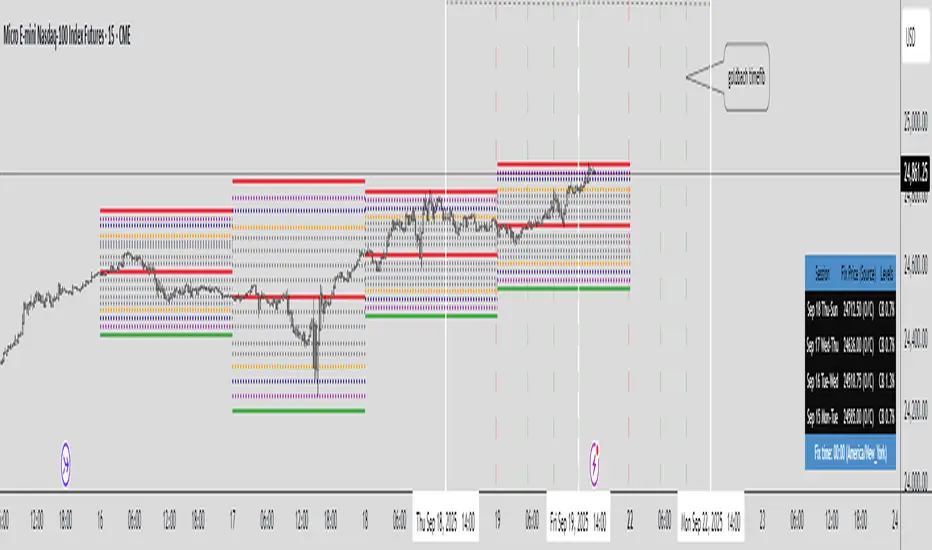
Hopiplaka Twin Tower Levels (Variable Multiplier) [NZA 333]Purpose
Instrument scope: This indicator is for exchange-traded futures only (e.g., CME/ICE). It assumes a regular session with a 16:00 daily fix; use on spot FX, equities/ETFs, CFDs, or crypto is not supported and may produce incorrect windows/levels.
This tool draws structured possible support/resistance price-level frameworks anchored to a daily “Fix” at 16:00 and lets you study intraday expansion/mean-reversion from that anchor. It overlays three families of levels:
CB - Circuit-Breaker style bands: symmetric bands at ±X% of the Fix (user-defined), plus intermediate percentages (14/26/40/50/60/74/86) and three highlighted “impulse” bands.
GB – “Goldbach-type” ratios: fixed ratios applied to a user-selected PO3 dealing range (e.g., 729, 2187, 6561 points). This produces low/eq/high rails and intermediate harmonics, including extended rails at −0.111 and 1.111.
STDV – “Stop-Run” ladders: equidistant steps (user step size) centered on the Fix and bounded by ±PO3/2.
All drawings are time-boxed windows that run from one 16:00 to the next 16:00 so you can compare today vs. prior sessions at a glance, including weekends/market closures.
How it works (high level)
Session windows (16:00→16:00)
For non-crypto symbols, each “day” is a window starting at 16:00 in the user-chosen timezone (default: America/New_York) and ending at the next day’s 15:59. When a new 16:00 occurs, the script immediately rolls the windows forward so Day-0, Day-1, Day-2, Day-3 always reference the latest four 16:00 anchors, even across weekends.
Fix source (per day)
Each day can use one of:
O/C: the open price of the 16:00 bar (acts as an official fix for that session).
VWAP: the VWAP value on the 15:59:30 (last 30 seconds bar before 16:00). You need Trading View Premium to use this source.
Manual: user-entered value. You can visit CME Group's website to see the published fix prices for your chart and enter it manually.
For a current session you want to use the previous session fix price until 4 pm (New York).
Market type handling
Crypto: by default the Fix is 16:00 Europe/London (configurable). Crypto session handling remains continuous; the script keeps the crypto branch behavior separate so nothing changes for 24/7 markets.
Non-crypto: uses the selected timezone (default NY). The script explicitly handles weekends/holidays so Day-0 can be Fri→Mon and Day-1 Thu→Fri, etc.
Ratios & math
Circuit Breakers bands: Fix ± (Fix * percent / 100), with extra mid-points (“CE levels”) and the intermediate percentages listed above.
Goldbach ratios: a fixed array of ratios mapped onto the PO3 distance; on Forex, PO3 is automatically converted to price units using syminfo.mintick.
STDV steps: Fix ± n * step, drawn only within ±PO3/2.
Rendering model
Lines are created with xloc = xloc.bar_time between the window’s start/end timestamps. A housekeeping buffer deletes/redraws on the last bar to keep charts responsive when you toggle features. A compact table shows, per day window, the session label, Fix (and its source), and the active options (CB%, PO3, STDV).
Update behavior
As soon as the 16:00 1-minute bar closes, the Fix for Day-0 updates and older windows roll forward. Historical windows (Day-1/2/3) also move forward afterward, since their Fix times are already stored. On higher timeframes, the script relies on the captured 1-minute Fix so Day-0 levels appear intrabar even if the higher-TF candle hasn’t closed yet.
How to use it
I - Choose the Fix source per day (Manual / VWAP / O/C).
II- Choose levels to show on each day, via toggles:
- Mode 1: Toggle "Show Goldbach Levels" and/or "NG Levels" / "CE Levels" (extra ratio sets) to show these levels for the day. Choose PO3 DR (Dealing Range), note the fix price acts as Equilibrium.
- Mode 2: Toggle "Show Stop Run Levels" to show PO3 distance in handles from Fix Price. Choose a PO3 number from the "STDV" option, this will be your max distance in handles (think Dealing Range).
- Mode 3: Toggle "Show Circuit Breaker Levels" to show ratios derived from the CME Group's official price limits percents from the fix price for a day (7%, 13% or 20%) * 2.
Each mode's toggles are in the same line, one line per mode. Usually you just need one of the 3 modes.
III - Use Day shift to scroll the four windows through past sessions (0 by default).
IV - Use Hour shift to visually nudge the drawings on the time axis without changing calculations.
Timezone: for non-crypto, select America/New_York, Europe/London or UTC for the 16:00 anchor. Crypto can auto-use London 16:00.
Notes & limitations
The tool does not generate buy/sell signals; it’s a visual framework for contextual levels.
O/C fixes (Default) are captured from the 1-minute series at exactly 16:00; if a symbol lacks 1-minute history at that time (rare), a day window may show as missing or could take the fix price incorrectly.
VWAP fixes are captured from the 30-seconds series at exactly 16:00; if a symbol lacks 30 seconds history at that time, a day window may show as missing.
Historical windows are fixed once their 16:00 bar has closed; Day-0 updates only at the moment a new 16:00 occurs.
Be mindful of symbol tick size/PO3 scale on Forex vs. indices/futures.
This indicator does not predict future values and does not access future data beyond the last completed 16:00 bar. See TradingView’s guidance on realistic claims and use of request.security.
(Educational use only. Trading involves risk; past behavior of levels relative to price does not guarantee future outcomes.)
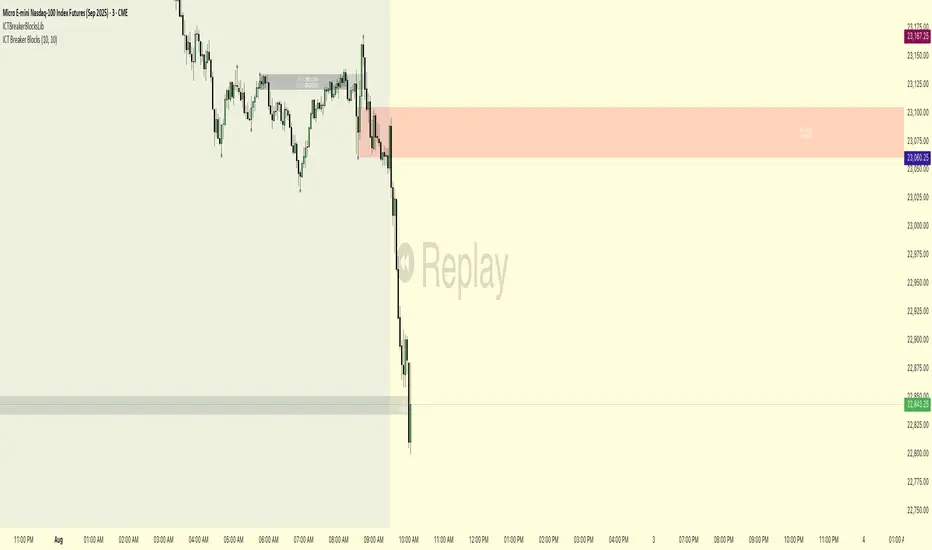
ICT Breaker BlocksICT Breaker Block Detector
This indicator automatically identifies and displays high-probability ICT (Inner Circle Trader) Breaker Blocks on your chart. It is designed to help traders spot key shifts in market structure where price is likely to react.
What It Does
The indicator's primary function is to find and draw both Bullish and Bearish Breaker Blocks. These are specific price action patterns that signal a potential reversal after a liquidity sweep.
Bullish Breaker Block (Green): Forms after a low is swept (creating a lower low) and the market structure shifts by breaking above the intermediate swing high. This broken swing high becomes the Bullish Breaker.
Bearish Breaker Block (Red): Forms after a high is swept (creating a higher high) and the market structure shifts by breaking below the intermediate swing low. This broken swing low becomes the Bearish Breaker.
Invalidation: The indicator also tracks these zones in real-time. If price trades completely through a breaker block, the zone is considered invalidated. It will stop extending, its color will change to gray, and an exclamation mark ! will be added to its label.
How It Functions
The script's logic is designed to precisely identify the ICT breaker pattern:
Liquidity Sweep: It first identifies a sequence where a recent swing high is taken out by a higher high (for a bearish setup) or a swing low is taken out by a lower low (for a bullish setup).
Market Structure Shift (MSS): After the sweep, it waits for a clear break in market structure. This occurs when price closes below the intermediate swing low (for a bearish breaker) or above the intermediate swing high (for a bullish breaker).
Drawing the Zone: Once the MSS is confirmed, the indicator draws a box around the range of the swing point that was broken. This box is the Breaker Block, which is then extended into the future to serve as a potential area of interest.
How to Use This Indicator
Settings
Pivot Lookback: This setting determines the sensitivity of the swing point detection. A higher number will identify larger, more significant market structure and result in fewer, but potentially stronger, breaker blocks. A lower number will identify smaller, more immediate patterns.
Color & Display Options: You can customize the colors for the bullish, bearish, and invalidated zones, as well as toggle the visibility of each type of breaker.
Trading Application
Traders can use these automatically drawn zones as high-probability Points of Interest (POI). The common application is to wait for price to return to the breaker block after it has formed. This retest can offer a potential entry opportunity in the direction of the market structure shift.
For a Bullish Breaker, a trader might look for a long entry when the price dips back into the green zone.
For a Bearish Breaker, a trader might look for a short entry when the price rallies back up into the red zone.
Disclaimer: This indicator is a tool to assist in technical analysis. It is not a standalone trading system and does not provide financial advice. Always use proper risk management and combine this tool with your own analysis and trading strategy.
Order + Breaker Blocks - Custom TimeframesThis indicator is a Hidden Liquidity Script, being a much more refined and precise version of "Order Blocks" also known as "Supply and Demand" zones.
This script is more refined and precise as this script is the only script that displays the exact body part of blocks on multiple timeframes, showing potentially powerful price reversal zones for taking a long or short.
This is a PRICE ACTION indicator, demonstrating price action that can result in potential good support/resistance levels for taking a long or short trade.
This indicator only displays the body part of order blocks, instead of including wicks that all other indicators do. That makes this script a much more refined version of all other scripts out there.
Not only that, this script can collate multiple timeframes into one indicator, again something other scripts cannot do.
This script is also unique compared to other Hidden Liquidity style scripts in that you have full control over each Order Block so you can see each individual block on a chart, whilst other charts combine them into a zone instead. This refined version gives you precise potential entries and much further refinement as well as more thorough backtesting capabilities.
This script also can highlight order blocks that pass THROUGH a Fair Value Gap. These are known as 'Breaker Blocks'. These powerful blocks can be places of interest as support or resistance for a long or short trade. Note: This script shows the body part of a block only and not the wick.
Breaker Blocks, where significant displacement has occurred in price past a block can be more powerful. This script does not highlight Fair Value Gaps themselves, only order blocks (supply and demand) and breaker blocks through displacement in price (through an FVG). FVGs on their own can be weaker without order blocks behind them hence they are not highlighted.
The BODY of the order block, and the 0.5 of the order block are key regions for considering a trade, treating that level as either resistance or support.
Important: PLEASE NOTE: This indicator will only show timeframes that are higher than or the same as the current chart timeframe.
For Example, only blocks 3 Days or higher will show on a 3D chart. It will not show 12h blocks on a 3D chart. You would need to go to a 12 hour chart with the 12h blocks showing to see all Blocks that are 12h or higher drawn.
This Script differs from others in that you can DEFINE your OWN TIMEFRAMES.
It caters for 4 timeframes. If it is slow loading, deselect the 3 others and show only one.
LTF can take a looong time to load and may not be possible at all on subscriptions with only 20s compute time on their plan.
However if you have a timeframe in mind you have wanted to check out that is not standard, you can do it with this Indicator.
For seconds, use the digit and add an “S” to it. Eg 45 seconds use “45S”
For Mintues and Hours, you must do them in minute format with no letter added. Eg 145 minutes is “145”. 30 minutes is “30”. 6 hours is “360” minutes. Trading View allows up to 24 hours in minute format.
For Days, eg 3 Days use “3D”
For Weeks, eg 5 Weeks, use ‘5W”
For Months, eg 6 Months, use “6M”.
If you don’t use the correct format as specified above it will not work or display anything.
SETTINGS:
There is options to change the colours of the boxes and to differentiate between Order Blocks and stronger Breaker Blocks if desired.
If this is NOT desired, make all color options the same color,.
Shown below is blue Order Blocks (Supply and Demand
Shown below there is Pink Breaker Blocks.
There is options to weaken the colour of blocks that have been tapped by a wick and thus partially used up, also called partially "mitigated".These blocks can be considered weaker support/resistance.
Once a block has had a wick or body close over it entirely, the block can be considered fully "mitigated" and will disappear from the indicator once that candle has closed. This block level can now be considered too weak. You can also choose to not show these partially mitigated blocks at all.
The charts above shows pale Violet blocks as partially mitigated or "tapped" blocks.
The blocks in HOT BRIGHT Violet are untapped and potentially stronger levels for a Long or Short trade. See below the 7h.
Additional SETTINGS:
Further options include, if selected: Counting the number of fair value gaps an order block may pass through. More FVGs an order block (now a breaker block) passes through can strengthen the support of that block level, making a reversal more likely.
There is an option of showing old mitigated order blocks and changing the color of these on the chart. This can aid in backtesting of levels.
Further Settings include:
- an option to remove very thin blocks that may not be strong points.
- an option to denote with a character such as a * blocks that have their EQ 0.5 region wicked - these can be considered weaker.
- an option to denote with an additional * or another character blocks that are barely tapped by a small percent so you know they are still considered quite strong.
- an option to show how many candles form the order block.
Additional Options include:
- an option to show blocks only within a specific price range or percent range of the current price.
- an option to only look X number of bars back.
There is Options regarding labelling, and Border widths on boxes.
It is ESSENTIAL to do your own research and backtesting!
It is recommended to combine these levels with other concepts for added confluence.
Other indicators are NOT included in this script. This is purely a refined order block script for the BODY of a block only.
You can combine Order Blocks and stronger versions known as Breaker Blocks in this script with other indicators or concepts to form a Full Trading Strategy.
Other potential concepts to combine, not shown in this script can include Smart Money Concepts, Market Structure, Fibonnaccis, SMAs, EMAs or any other concept to give added confluence to the support / resistance levels identified in this script that may indicate that the level is stronger.
This indicator is not a trading strategy on its own. It is best used in combination with other concepts to improve the success.
Backtesting this indicator is highly recommended and incorporated into a full trading system of your own design. This only identifies possible key regions based on Price Action Strategies.
This indicator simply makes the identification of these hot levels easier and simpler to find, especially across multiple timeframes.
A strong bright zone on the indicator can be a stronger level than a weak partial block that is in light colours.
Again -Please do your own research and backtesting.
These indicators make finding these levels much much simpler and easier when combined with a full trading strategy.
Any feedback is welcome.

Order + Breaker Blocks MTF - Vees Hidden LiquidityThis indicator is a Hidden Liquidity Script, being a much more refined and precise version of "Order Blocks" also known as "Supply and Demand" zones.
This script is more refined and precise as this script is the only script that displays the exact body part of blocks on multiple timeframes, showing potentially powerful price reversal zones for taking a long or short.
This is a PRICE ACTION indicator, demonstrating price action that can result in potential good support/resistance levels for taking a long or short trade.
This indicator only displays the body part of order blocks, instead of including wicks that all other indicators do. That makes this script a much more refined version of all other scripts out there.
Not only that, this script can collate multiple timeframes into one indicator, again something other scripts cannot do.
This script is also unique compared to other Hidden Liquidity style scripts in that you have full control over each Order Block so you can see each individual block on a chart, whilst other charts combine them into a zone instead. This refined version gives you precise potential entries and much further refinement as well as more thorough backtesting capabilities.
This script also can highlight order blocks that pass THROUGH a Fair Value Gap. These are known as 'Breaker Blocks'. These powerful blocks can be places of interest as support or resistance for a long or short trade. Note: This script shows the body part of a block only and not the wick.
Breaker Blocks, where significant displacement has occurred in price past a block can be more powerful. This script does not highlight Fair Value Gaps themselves, only order blocks (supply and demand) and breaker blocks through displacement in price (through an FVG). FVGs on their own can be weaker without order blocks behind them hence they are not highlighted.
The BODY of the order block, and the 0.5 of the order block are key regions for considering a trade, treating that level as either resistance or support.
Important: PLEASE NOTE: This indicator will only show timeframes that are higher than or the same as the current chart timeframe.
For Example, only blocks 3 Days or higher will show on a 3D chart. It will not show 12h blocks on a 3D chart. You would need to go to a 12 hour chart with the 12h blocks showing to see all Blocks that are 12h or higher drawn.
SETTINGS:
There is options to change the colours of the boxes and to differentiate between Order Blocks and stronger Breaker Blocks if desired.
If this is NOT desired, make all color options the same color,.
Shown below is blue Order Blocks (Supply and Demand
Shown below there is Pink Breaker Blocks.
There is options to weaken the colour of blocks that have been tapped by a wick and thus partially used up, also called partially "mitigated".These blocks can be considered weaker support/resistance.
Once a block has had a wick or body close over it entirely, the block can be considered fully "mitigated" and will disappear from the indicator once that candle has closed. This block level can now be considered too weak. You can also choose to not show these partially mitigated blocks at all.
The charts above shows pale Violet blocks as partially mitigated or "tapped" blocks.
The blocks in HOT BRIGHT Violet are untapped and potentially stronger levels for a Long or Short trade. See below the 7h.
Additional SETTINGS:
Further options include, if selected: Counting the number of fair value gaps an order block may pass through. More FVGs an order block (now a breaker block) passes through can strengthen the support of that block level, making a reversal more likely.
There is an option of showing old mitigated order blocks and changing the color of these on the chart. This can aid in backtesting of levels.
Further Settings include:
- an option to remove very thin blocks that may not be strong points.
- an option to denote with a character such as a * blocks that have their EQ 0.5 region wicked - these can be considered weaker.
- an option to denote with an additional * or another character blocks that are barely tapped by a small percent so you know they are still considered quite strong.
- an option to show how many candles form the order block.
Additional Options include:
- an option to show blocks only within a specific price range or percent range of the current price.
- an option to only look X number of bars back.
There is Options regarding labelling, and Border widths on boxes.
It is ESSENTIAL to do your own research and backtesting!
It is recommended to combine these levels with other concepts for added confluence.
Other indicators are NOT included in this script. This is purely a refined order block script for the BODY of a block only.
You can combine Order Blocks and stronger versions known as Breaker Blocks in this script with other indicators or concepts to form a Full Trading Strategy.
Other potential concepts to combine, not shown in this script can include Smart Money Concepts, Market Structure, Fibonnaccis, SMAs, EMAs or any other concept to give added confluence to the support / resistance levels identified in this script that may indicate that the level is stronger.
This indicator is not a trading strategy on its own. It is best used in combination with other concepts to improve the success.
Backtesting this indicator is highly recommended and incorporated into a full trading system of your own design. This only identifies possible key regions based on Price Action Strategies.
This indicator simply makes the identification of these hot levels easier and simpler to find, especially across multiple timeframes.
A strong bright zone on the indicator can be a stronger level than a weak partial block that is in light colours.
Again -Please do your own research and backtesting.
These indicators make finding these levels much much simpler and easier when combined with a full trading strategy.
Any feedback is welcome.
Order + Breaker Blocks HTFThis indicator is a Hidden Liquidity Script, being a much more refined and precise version of "Order Blocks" also known as "Supply and Demand" zones.
This script is more refined and precise as this script is the only script that displays the exact body part of blocks on multiple timeframes, showing potentially powerful price reversal zones for taking a long or short.
This is a PRICE ACTION indicator, demonstrating price action that can result in potential good support/resistance levels for taking a long or short trade.
This indicator only displays the body part of order blocks, instead of including wicks that all other indicators do. That makes this script a much more refined version of all other scripts out there.
Not only that, this script can collate multiple timeframes into one indicator, again something other scripts cannot do.
This script is also unique compared to other Hidden Liquidity style scripts in that you have full control over each Order Block so you can see each individual block on a chart, whilst other charts combine them into a zone instead. This refined version gives you precise potential entries and much further refinement as well as more thorough backtesting capabilities.
This script also can highlight order blocks that pass THROUGH a Fair Value Gap. These are known as 'Breaker Blocks'. These powerful blocks can be places of interest as support or resistance for a long or short trade. Note: This script shows the body part of a block only and not the wick.
Breaker Blocks, where significant displacement has occurred in price past a block can be more powerful. This script does not highlight Fair Value Gaps themselves, only order blocks (supply and demand) and breaker blocks through displacement in price (through an FVG). FVGs on their own can be weaker without order blocks behind them hence they are not highlighted.
The BODY of the order block, and the 0.5 of the order block are key regions for considering a trade, treating that level as either resistance or support.
Important: PLEASE NOTE: This indicator will only show timeframes that are higher than or the same as the current chart timeframe.
For Example, only blocks 3 Days or higher will show on a 3D chart. It will not show 12h blocks on a 3D chart. You would need to go to a 12 hour chart with the 12h blocks showing to see all Blocks that are 12h or higher drawn.
SETTINGS:
There is options to change the colours of the boxes and to differentiate between Order Blocks and stronger Breaker Blocks if desired.
If this is NOT desired, make all color options the same color,.
Shown below is blue Order Blocks (Supply and Demand)
Shown below there is Pink Breaker Blocks.
There is options to weaken the colour of blocks that have been tapped by a wick and thus partially used up, also called partially "mitigated".These blocks can be considered weaker support/resistance.
Once a block has had a wick or body close over it entirely, the block can be considered fully "mitigated" and will disappear from the indicator once that candle has closed. This block level can now be considered too weak. You can also choose to not show these partially mitigated blocks at all.
The chart above shows pale Violet blocks as partially mitigated or "tapped" blocks.
The blocks in HOT BRIGHT Violet are untapped and potentially stronger levels for a Long or Short trade.
See below and example of a HOT PINK stronger level with a 1,2,3,4,5 Days of blocks in the one area.
See below an example of a weaker pink level. Still valid, but potentially riskier. There is a weaker 5D Block in pale pink and no other days in that same zone.
Additional SETTINGS:
Further options include, if selected: Counting the number of fair value gaps an order block may pass through. More FVGs an order block (now a breaker block) passes through can strengthen the support of that block level, making a reversal more likely.
There is an option of showing old mitigated order blocks and changing the color of these on the chart. This can aid in backtesting of levels.
Further Settings include:
- an option to remove very thin blocks that may not be strong points.
- an option to denote with a character such as a * blocks that have their EQ 0.5 region wicked - these can be considered weaker.
- an option to denote with an additional * or another character blocks that are barely tapped by a small percent so you know they are still considered quite strong.
- an option to show how many candles form the order block.
Additional Options include:
- an option to show blocks only within a specific price range or percent range of the current price.
- an option to only look X number of bars back.
There is Options regarding labelling, and Border widths on boxes.
It is ESSENTIAL to do your own research and backtesting!
It is recommended to combine these levels with other concepts for added confluence.
Other indicators are NOT included in this script. This is purely a refined order block script for the BODY of a block only.
You can combine Order Blocks and stronger versions known as Breaker Blocks in this script with other indicators or concepts to form a Full Trading Strategy.
Other potential concepts to combine, not shown in this script can include Smart Money Concepts, Market Structure, Fibonnaccis, SMAs, EMAs or any other concept to give added confluence to the support / resistance levels identified in this script that may indicate that the level is stronger.
This indicator is not a trading strategy on its own. It is best used in combination with other concepts to improve the success.
Backtesting this indicator is highly recommended and incorporated into a full trading system of your own design. This only identifies possible key regions based on Price Action Strategies.
This indicator simply makes the identification of these hot levels easier and simpler to find, especially across multiple timeframes.
A strong bright zone on the indicator can be a stronger level than a weak partial block that is in light colours.
Again -Please do your own research and backtesting.
These indicators make finding these levels much much simpler and easier when combined with a full trading strategy.
Any feedback is welcome.
Protected Pivots Points by RiotwolftradingProtected Pivots Points by Riotwolftrading
---
You have an advanced visual tool designed for traders who want to identify and manage key price levels with maximum precision.
This script detects protected pivots (significant highs and lows) and marks them with horizontal lines on the chart. These lines automatically extend for a fixed number of bars or until price invalidates the level with a closing break.
---
🚀 What makes this indicator special?
---
✅ Protected pivot detection:
The indicator identifies protected highs and lows using a fixed pivot strength
✅ Wick break detection (liquidity sweep visualization):
When a wick crosses the pivot level **without the candle closing beyond the level, the indicator automatically changes the line’s color and style.
👉 This immediately shows the trader that the level was tested but remains structurally valid.
✅ Highly customizable visuals:
* Choose whether to show color for protected highs, lows, or wick break levels.
* Set your own colors, line styles (solid, dashed, dotted), and line widths.
---
### 🌟 Why is wick break detection so valuable?
---
💡 Instant context on price action:
No need to manually check every candle to see if a level was barely tested. The indicator changes the line’s appearance automatically, so you can focus on decisions.
💡 Clear distinction between untouched levels and tested levels:
* A level with no wick test is pristine support/resistance.
* A level tested by a wick but not invalidated is still valid — but may have been swept for liquidity.
💡 Crucial for precision trading strategies:
This is particularly important for strategies that rely on:
✅ Liquidity sweeps / stop hunts.
✅ Reversals from tested zones.
✅ Smart Money Concepts (SMC).
✅ ICT concepts, breakers, Quasimodo, BOS/MSS.
The wick break visualization helps filter false breakouts and highlights areas where institutional players may have stepped in.
💡 Avoid premature exits or entries:**
The color/style change tells you a level was tested but not broken, so you avoid overreacting to wick activity.
---
### ⚡ Example use case**
Imagine a protected low line:
🔹 Price dips and its wick touches the level — the line changes color (e.g. violet solid line).
🔹 The level is still valid because the close didn’t break it.
🔹 This could signal a stop hunt or liquidity grab, with a possible reversal opportunity right at that level.
---
### 🧭 **Why most pivot indicators don’t offer this**
Most pivot indicators:
❌ Simply mark the level and remove it after a close break.
❌ Don’t distinguish between a wick test and a true break.
🌟 **This indicator does — giving traders an extra layer of market insight.**
---
### ⚠ **Disclaimer**
This indicator is a visual aid to help identify key levels and price reactions. It does **not** generate buy or sell signals and should be used alongside your trading analysis and strategy.
---
BIX Candle MarkerBIX Candle Marker (by Bogdan Ilie)
"BIX Candle Marker" is a visual indicator designed to automatically mark the High and Low levels of specific candles at user-defined times and sessions directly on the main chart, facilitating easy intraday analysis.
**How does it work?**
- The indicator automatically fetches the High and Low values from a user-specified timeframe and draws horizontal lines at these levels at precise user-defined session times.
- You can configure up to 4 different sessions per trading day, each with its own customizable color and timing.
- Marked levels are automatically reset at the start of each new trading day.
**Customizable Settings:**
- **Timezone Offset:** Adjust the indicator according to your chart's timezone.
- **Candle Time Frame:** Choose the timeframe from which the candle data will be extracted.
- **Marker Length:** Set the length (number of bars) of the displayed horizontal lines.
- **Line Thickness & Style:** Customize the thickness and style of the lines (solid, dotted, dashed).
- **Sessions (1-4):** Independently configure the hour, minute, and color for each of the four possible sessions.
**Suggested Use:**
- Quickly identify intraday support and resistance levels based on key session candles.
- Ideal for breakout and reversal-based trading strategies.
---
**Disclaimer:**
This indicator is intended solely for chart analysis and educational purposes. It does not constitute financial advice. Always use it in conjunction with your personal trading strategy and risk management practices.
Author: Bogdan Ilie
Pine Script Version: v6
License: Mozilla Public License 2.0
---
BIX Candle Marker (by Bogdan Ilie)
"BIX Candle Marker" este un indicator vizual care marchează automat nivelurile High și Low ale lumânărilor specifice din sesiuni predefinite pe graficul principal, facilitând analiza punctelor-cheie intraday.
**Cum funcționează?**
- Indicatorul preia automat nivelurile maxime și minime dintr-un timeframe personalizabil și afișează linii orizontale pentru aceste nivele exact la orele și minutele configurate.
- Permite definirea a până la 4 sesiuni diferite într-o zi, fiecare având culori și setări proprii.
- Liniile marcate se resetează automat la începutul fiecărei zile de tranzacționare.
**Setări personalizabile:**
- **Timezone Offset:** ajustează indicatorul în funcție de fusul orar al graficului.
- **Candle Time Frame:** selectează timeframe-ul din care se vor prelua datele.
- **Marker Length:** stabilește lungimea (numărul de bare) liniilor orizontale afișate.
- **Line Thickness & Style:** grosimea și stilul liniilor pot fi personalizate (solid, punctat, întrerupt).
- **Sesiuni (1-4):** ora, minutul și culoarea fiecărei sesiuni pot fi configurate independent.
**Sugestii de utilizare:**
- Folosește indicatorul pentru a identifica rapid zonele de suport și rezistență create de lumânări-cheie pe parcursul zilei.
- Poate fi util pentru strategii bazate pe breakout sau reversal.
---
**Disclaimer:**
Acest indicator este destinat exclusiv analizei grafice și nu reprezintă sfaturi financiare. Utilizează-l împreună cu propriile strategii și tehnici de gestionare a riscului.
Autor: Bogdan Ilie
Versiune Pine Script: v6
Licență: Mozilla Public License 2.0

ICT Breakers (BOS / MSS - Market Structure) [ICTProTools]The Breakers (Market Structure) indicator is designed to help traders identify true breaker structures , a key concept in Inner Circle Trader (ICT) methodology. In market structure, Breakers represent powerful shifts where a key high or low is broken, leading to a reversal in market direction. Most tools misinterpret structure shifts, using internal structure , leading to fake breakouts. This tool solves that problem by filtering out false signals , providing clear & structured insights , all with multi-timeframe compatibility.
💎 Key Features
⚡️ Breakers in action
The indicator shows the structure following ICT instructions. A breaker is defined by two lines:
The first line confirms the previous trend (it could be interpreted as a BOS).
The second line highlights the moment price breaks structure (with candle body or wick based on your chosen settings), signaling a shift in trend direction (like an MSS).
Furthermore, it’s important to note that a breaker not only shows the structure, but also defines a potential Point of Interest (POI), an area where price may retrace before continuing its trend.
Here, we can observe two clear structure shifts.
On the far left, the market was in a bearish trend, illustrated by the first visible (dotted and red) line. Shortly after, the second (solid and green) line appears, showing a break that initiates a new bullish trend.
This upward movement continues, with the last confirmation marked by a top structure line. And finally, the structure is broken once again indicating a transition back into a bearish trend.
💪 Real Structure with True Highs / Lows
Unlike many indicators that detect internal breakouts , this tool follows ICT’s true market structure rules .
In a bearish trend , a bullish breaker is only confirmed when the high that created the low is broken , and conversely for a bullish scenario.
Fake breakouts are ignored, preventing misleading signals.
In the image above, the white breakout is correctly ignored by the indicator, as it doesn't align with ICT’s structural rules. That white high is simply part of the internal structure, not the true swing point. Instead, the green line highlights the key level that truly matters, the one whose rupture would have confirmed a real change in market structure.
🔔 Smart Alerts for Structure Updates
Stay one step ahead with customizable alerts designed to notify you instantly when market structure changes occur.
Get notified for BOS (Continuation) and / or MSS (Breaker) events.
Set alerts for bullish , bearish , or both directions.
Choose between once or repeated alerts , based on your strategy.
This feature allows traders to remain focused and reactive , even when monitoring multiple markets.
In the alert settings, select which structure shifts you want to be notified of. Whether you're a scalper or a swing trader, the alerts keep you connected to key moments without needing to constantly monitor the chart.
⏳ Multi-Timeframe Structure
All features of the indicator are fully compatible with higher timeframes .
Get a broader view of market structure without switching timeframes.
Monitor higher timeframe structures and receive alerts, all without leaving your analysis chart .
In this example, the market structure of the 30m timeframe is displayed while on a 5m chart, providing a clearer perspective.
✨ Customization & User Control
Make it yours! The indicator allows full customization:
Swing bars (to confirm high / low)
Select your mode for Breakers (MSS) , using the candle body only or body / wick
Line style (type, width, color)
Choice of displayed timeframe
Activate any alert , with the frequency you want
🎯 Conclusion
✅ Avoid false signals by focusing on true ICT Breakers
✅ Smart alerts to never miss a structural shift
✅ Multi-timeframe support for enhanced analysis
✅ Clean & professional design for an optimal trading experience

Breaker Blocks + Order Blocks confirm [TradingFinder] BBOB Alert🔵 Introduction
In the realm of technical analysis, various tools and concepts are employed to identify key levels on price charts. These tools assist traders in analyzing market trends with greater precision, enabling them to optimize their trading decisions. Among these tools, the Order Block and Breaker Block hold a significant place, serving as effective instruments for analyzing market structure.
🟣 Order Block
An Order Block refers to zones on a chart where large financial institutions and high-volume traders place their orders. Due to the substantial volume of buy or sell orders in these areas, they are often regarded as pivotal points for potential price reversals or temporary pauses in a trend. Order Blocks are particularly crucial when prices react to these zones after a strong market move, acting as strong support or resistance levels.
🟣 Breaker Block
On the other hand, a Breaker Block refers to areas on a chart that previously functioned as Order Blocks but where the price has managed to break through and continue in the opposite direction. These zones are typically recognized as key points where market trends might shift, helping traders identify potential reversal points in the market.
🟣 Overlapping Block (BBOB)
Now, imagine a scenario where these two essential concepts in technical analysis—Order Blocks and Breaker Blocks—overlap on a chart. Although this overlap is not specifically discussed within the ICT (Inner Circle Trader) trading framework, exploring and utilizing this overlap can provide traders with powerful insights into strong support and resistance zones. The combination of these two robust concepts can highlight critical areas in trading, potentially offering significant advantages in making informed trading decisions.
In this article, we will delve into the concept of this overlap, explaining how to utilize it in trading strategies. Additionally, we will analyze the potential outcomes and benefits of incorporating this concept into your trading decisions.
Bullish Overlapping Block (BBOB) :
Bearish Overlapping Block (BBOB) :
🔵 How to Use
The overlap between Order Blocks and Breaker Blocks is a compelling and powerful concept that can help traders identify key levels on the chart with a high probability of success. This overlap is particularly valuable because it combines two well-regarded concepts in technical analysis—zones of high order volume and critical market shifts.
🟣 Here’s how to effectively use this overlap in your trading
1. Dentifying the Overlapping Block : To make the most of the overlap between Order Blocks and Breaker Blocks, begin by identifying these zones separately. Order Blocks are areas where price typically reacts and reverses after a strong market move.
Breaker Blocks are areas where a previous Order Block has been breached, and the price continues in the opposite direction. When these two zones overlap on a chart, it’s crucial to pay close attention to this area, as it represents a high-probability reaction zone.
2. Analyzing the Overlapping Block : After identifying the overlap zone, carefully analyze price action within this region. Candlestick patterns and price behavior can provide essential clues.
If the price reaches this overlap zone and strong reversal patterns such as Pin Bars or Engulfing patterns are observed, it’s likely that this zone will act as a pivotal reversal point. In such cases, entering a trade with confidence becomes more feasible.
3. Entering the Trade : When sufficient signs of price reaction are present in the overlap zone, you can proceed to enter the trade. If the overlap zone is within an uptrend and bullish reversal signals are evident, a long position might be appropriate.
Conversely, if the overlap zone is in a downtrend and bearish reversal signals are observed, a short position would be more suitable.
4. Risk Management : One of the most critical aspects of trading in overlap zones is managing risk. To protect your capital, place your stop loss near the lowest point of the Order Block (for buy trades) or the highest point (for sell trades). This approach minimizes potential losses if the overlap zone fails to hold.
5. Price Targets : After entering the trade, set your price targets based on other key levels on the chart. These targets could include other support and resistance zones, Fibonacci levels, or pivot points.
Bullish Overlapping Block :
Bearish Overlapping Block :
🟣 Benefits of the Overlapping Block Between Order Block and Breaker Block
1. Enhanced Precision in Identifying Key Levels : The overlap between these two zones usually acts as a highly reliable area for price reactions, increasing the accuracy of identifying entry and exit points.
2. Reduced Trading Risk : Given the high importance of the overlap zone, the likelihood of making incorrect decisions is reduced, contributing to overall lower trading risk.
3. Increased Probability of Success : The overlap between Order Blocks and Breaker Blocks combines two powerful concepts, enhancing the likelihood of success in trades, as multiple indicators confirm the importance of the area.
4. Creation of Better Trading Opportunities : Overlap zones often provide traders with more robust trading opportunities, as these areas typically represent strong reversal points in the market.
5. Compatibility with Other Technical Tools : This concept seamlessly integrates with other technical analysis tools such as Fibonacci retracements, trend lines, and chart patterns, offering a more comprehensive market analysis.
🔵 Setting
🟣 Global Setting
Pivot Period of Order Blocks Detector : Enter the desired pivot period to identify the Order Block.
Order Block Validity Period (Bar) : You can specify the maximum time the Order Block remains valid based on the number of candles from the origin.
Mitigation Level Order Block : Determining the basic level of a Order Block. When the price hits the basic level, the Order Block due to mitigation.
Mitigation Level Breaker Block : Determining the basic level of a Breaker Block. When the price hits the basic level, the Breaker Block due to mitigation.
Mitigation Level Overlapping Block : Determining the basic level of a Overlapping Block. When the price hits the basic level, the Overlapping Block due to mitigation.
🟣 Overlapping Block Display
Show All Overlapping Block : If it is turned off, only the last Order Block will be displayed.
Demand Overlapping Block : Show or not show and specify color.
Supply Overlapping Block : Show or not show and specify color.
🟣 Order Block Display
Show All Order Block : If it is turned off, only the last Order Block will be displayed.
Demand Main Order Block : Show or not show and specify color.
Demand Sub (Propulsion & BoS Origin) Order Block : Show or not show and specify color.
Supply Main Order Block : Show or not show and specify color.
Supply Sub (Propulsion & BoS Origin) Order Block : Show or not show and specify color.
🟣 Breaker Block Display
Show All Breaker Block : If it is turned off, only the last Breaker Block will be displayed.
Demand Main Breaker Block : Show or not show and specify color.
Demand Sub (Propulsion & BoS Origin) Breaker Block : Show or not show and specify color.
Supply Main Breaker Block : Show or not show and specify color.
Supply Sub (Propulsion & BoS Origin) Breaker Block : Show or not show and specify color.
🟣 Order Block Refinement
Refine Order Blocks : Enable or disable the refinement feature. Mode selection.
🟣 Alert
Alert Name : The name of the alert you receive.
Alert Overlapping Block Mitigation :
On / Off
Message Frequency :
This string parameter defines the announcement frequency. Choices include: "All" (activates the alert every time the function is called), "Once Per Bar" (activates the alert only on the first call within the bar), and "Once Per Bar Close" (the alert is activated only by a call at the last script execution of the real-time bar upon closing). The default setting is "Once per Bar".
Show Alert Time by Time Zone :
The date, hour, and minute you receive in alert messages can be based on any time zone you choose. For example, if you want New York time, you should enter "UTC-4". This input is set to the time zone "UTC" by default.
🔵 Conclusion
The overlap between Order Blocks and Breaker Blocks represents a critical and powerful area in technical analysis that can serve as an effective tool for determining entry and exit points in trading.
These zones, due to the combination of two key concepts in technical analysis, hold significant importance and can help traders make more confident trading decisions.
Although this concept is not specifically discussed in the ICT framework and is introduced as a new idea, traders can achieve better results in their trades through practice and testing.
Utilizing the overlap between Order Blocks and Breaker Blocks, in conjunction with other technical analysis tools, can significantly improve the chances of success in trading.

Order Blocks & Breaker Blocks [TradingFinder] Signals + Alerts🔵 Introduction
Order Block and Breaker Block, are powerful tools in technical analysis. By understanding these concepts, traders can enhance their ability to predict potential price reversals and continuations, leading to more effective trading strategies.
Using historical price action, volume analysis, and candlestick patterns, traders can identify key areas where institutional activities influence market movements.
🟣 Demand Order Block and Supply Breaker Block
Demand Order Block : A Demand Order Block is formed when the price succeeds in breaking the previous high pivot.
Supply Breaker Block : A Supply Breaker Block is formed when the price succeeds in breaking the Demand Order Block. As a result, the Order Block changes its role and turns from the role of price support to resistance.
🟣 Supply Order Block and Demand Breaker Block
Supply Order Block : A Supply Order Block is formed when the price succeeds in breaking the previous low pivot.
Demand Breaker Block : A Demand Breaker Block is formed when the price succeeds in breaking the Supply Order Block. As a result, the Order Block changes its role and turns from the role of price resistance to support.
🔵 How to Use
🟣 Order Blocks (Supply and Demand)
Order blocks are zones where the likelihood of a price reversal is higher. In demand zones, buying opportunities arise, while in supply zones, selling opportunities can be explored.
The "Refinement" feature allows you to adjust the width of the order block to fit your trading strategy. There are two modes in the "Order Block Refine" feature: "Aggressive" and "Defensive." The primary difference between these modes is the width of the order block.
For risk-averse traders, the "Defensive" mode is ideal as it offers a lower loss limit and a higher reward-to-risk ratio.
Conversely, for traders who are willing to take more risks, the "Aggressive" mode is more suitable. This mode, with its wider order block width, caters to those who prefer entering trades at higher prices.
🟣 Breaker Blocks (Supply and Demand)
Trading based on breaker blocks is the same as order blocks and the price in these zones is likely to be reversed.
🔵 Setting
🟣 Global Setting
Pivot Period of Order Blocks Detector : Enter the desired pivot period to identify the Order Block.
Order Block Validity Period (Bar) : You can specify the maximum time the Order Block remains valid based on the number of candles from the origin.
Mitigation Level Order Block : Determining the basic level of a Order Block. When the price hits the basic level, the Order Block due to mitigation.
Mitigation Level Breaker Block : Determining the basic level of a Breaker Block. When the price hits the basic level, the Breaker Block due to mitigation.
Switching Colors Theme Mode : Three modes "Off", "Light" and "Dark" are included in this parameter. "Light" mode is for color adjustment for use in "Light Mode".
"Dark" mode is for color adjustment for use in "Dark Mode" and "Off" mode turns off the color adjustment function and the input color to the function is the same as the output color.
🟣 Order Block Display
Show All Order Block : If it is turned off, only the last Order Block will be displayed.
Demand Main Order Block : Show or not show and specify color.
Demand Sub (Propulsion & BoS Origin) Order Block : Show or not show and specify color.
Supply Main Order Block : Show or not show and specify color.
Supply Sub (Propulsion & BoS Origin) Order Block : Show or not show and specify color.
🟣 Breaker Block Display
Show All Breaker Block : If it is turned off, only the last Breaker Block will be displayed.
Demand Main Breaker Block : Show or not show and specify color.
Demand Sub (Propulsion & BoS Origin) Breaker Block : Show or not show and specify color.
Supply Main Breaker Block : Show or not show and specify color.
Supply Sub (Propulsion & BoS Origin) Breaker Block : Show or not show and specify color.
🟣 Order Block Refinement
Refine Order Blocks : Enable or disable the refinement feature. Mode selection.
🟣 Alert
Alert Name : The name of the alert you receive.
Alert Demand OB Mitigation :
On / Off
Alert Demand BB Mitigation :
On / Off
Alert Supply OB Mitigation :
On / Off
Alert Supply BB Mitigation :
On / Off
Message Frequency :
This string parameter defines the announcement frequency. Choices include: "All" (activates the alert every time the function is called), "Once Per Bar" (activates the alert only on the first call within the bar), and "Once Per Bar Close" (the alert is activated only by a call at the last script execution of the real-time bar upon closing). The default setting is "Once per Bar".
Show Alert Time by Time Zone :
The date, hour, and minute you receive in alert messages can be based on any time zone you choose. For example, if you want New York time, you should enter "UTC-4". This input is set to the time zone "UTC" by default.
Display More Info :
Displays information about the price range of the order blocks (Zone Price) and the date, hour, and minute under "Display More Info".
If you do not want this information to appear in the received message along with the alert, you should set it to "Off".

Market Structure (Breakers) [LuxAlgo]The Market Structure (Breakers) indicator aims to detect "Breaker Market Structures", an original concept inspired by breaker blocks, and extend on the original concept of market structures by extending existing MS levels, providing supports/resistances as a result.
Various graphical elements are included that highlight the interactions between price and Breaker structures.
🔶 USAGE
Breaker structures occur when a market structure is confirmed (price breaking a previous swing level). The broken swing point is extended by a dotted line which can be used as potential support or resistance.
After a market structure, the price can eventually reverse and break one or multiple breaker structures at the same time, allowing for the detection of new trends in the price.
A market structure closer to the top/bottom of a trend can return Breaker structures breakouts more indicative of potential reversals.
Breakers MS breakouts can also be useful as exits for entries done using market market structures.
The script additionally highlights support/resistance events by highlighting candle borders, with a border using a green color indicating support events while a red color is indicative of a resistance event.
🔹 Breaker Structure Lifespan
The "lifespan" of Breaker structures, that is the amount of time the script will extend/evaluate them is determined by various user settings.
The Maximum Breaks setting determines the maximum amount of breaks a breaker structure can withstand before it is broken.
For example, a maximum amount of breaks of 3 for a bearish breaker structure would require the price to cross under that precise breaker structure level three times. Using higher values of this setting will also highlight more Breakers MS.
The Breaker Maximum Duration setting on the other hand determines how many bars a breaker structure can be evaluated without being broken. If a breaker structure is not broken after this amount of bars then it will stop being evaluated and will be removed.
🔶 SETTINGS
Swings Period: Period used for the swing detection, with higher values returning longer term markter structures.
Maximum Breaks: Amount of break required for a breaker block to be considered broken.
Breaker Maximum Duration: Maximum duration of a breaker block (in bars).

Order Blocks & Breaker Blocks [LuxAlgo]The Order Blocks & Breaker Blocks indicator detects order blocks that can be turned into breaker blocks on the chart automatically once mitigated.
Users can determine the amount of bullish and bearish order/breaker blocks that display on their chart from within the settings menu.
🔶 SETTINGS
Swing Lookback: Lookback period used for the detection of the swing points used to create order blocks.
Show Last Bullish OB: Number of the most recent bullish order/breaker blocks to display on the chart.
Show Last Bearish OB: Number of the most recent bearish order/breaker blocks to display on the chart.
Use Candle Body: Allows users to use candle bodies as order block areas instead of the full candle range.
🔹 Style
Show Historical Polarity Changes: Allows users to see labels indicating where a swing high/low previously occurred within a breaker block.
🔶 USAGE
We have published several scripts covering the detection of order blocks previously, however, the concept of breaker blocks was not yet introduced.
When price mitigates an order block, a breaker block is confirmed. We can eventually expect price to trade back to this breaker block offering a new trade opportunity.
We can see that this is similar to a change in polarity, where a support becomes a resistance after a breakout and vice versa.
This script highlights regular order blocks as solid extended areas on the chart and breaker blocks as dashed lines with dual-colored areas. The color change and dashed line starts at the location where the order block was mitigated.
Using a higher "Swing Lookback" setting will return longer term order/breaker blocks on the chart.
Users can optionally enable "Historical Polarity Changes" labels within the settings menu to see where breaker blocks might have provided an effective trade setup previously.
The "Historical Polarity Changes" setting is disabled by default & is most effective using replay mode as the labels are backpainted.
The order blocks & breaker blocks themselves can be used in real-time as they are detected based on the swing length & previous breaker blocks being mitigated.

[blackcat] L2 Intraday R-Breaker IndicatorLevel: 2
Background
The famous R-Breaker is a short-term intraday trading strategy that combines trend and reversal trading methods.
Function
-1) When the intraday highest price exceeds the observed selling price, and the intraday price drops and further breaks below the support line constituted by the reverse selling price, a reversal strategy is adopted, that is, at this point (backhand, open position) ) Short;
-2) When the intraday lowest price is lower than the observed purchase price, and the intraday price rebounds and further exceeds the resistance line constituted by the reverse purchase price, a reversal strategy is adopted, that is, at this point (backhand, open position) ) Long;
-3) In the case of a short position, if the intraday price exceeds the breakthrough buying price, a trend strategy is adopted, that is, open a long position at that point;
-4) In the case of a short position, if the intraday price breaks below the selling price, a trend strategy is adopted, that is, open a short position at that point.
Key Signal
pivot --> pivot pionts
reverse_sell_price --> pivot points,reverse selling prices: senter
observe_sell_price --> bserve selling price: ssetup
break_bid_price --> breakthrough bid price: bbreak1
reversal_bid_price --> reversal bid price: bbreak2
observe_buy_price --> observe buy price: bsetup
break_sell_price --> break sell price: sbreak
Remarks
This is a Level 2 free and open source indicator.
Feedbacks are appreciated.

Broken Fractal : Someone's broken dream is your profit!Idea
The idea is simple : when market turns around, it traps a bunch of traders off guard. We trade with them, in the same direction of their exit!
Method
We let the market first create a fractal
We then let the market create an opposite fractal
We then let the market break the first fractal it created, thereby trapping lots of trades in the process
We then patiently wait till the market gives these trapped traders a chance to exit - and we trade in the same direction
How to use?
Green boxes are for long entry, red boxes are for short.
Whenever a box appears, that's the risk criteria - setup limit orders and trade along!
Works on all timeframes
If you like this script, please leave a note on how you are using it.
I personally use it with Higher Timeframe bias.
PS1 : some traders call this Break of market structure, some call it Breaker, I just call it "Broken Fractal"
PS2 : Break of a broken fractal is also very potent. Watch out for those!
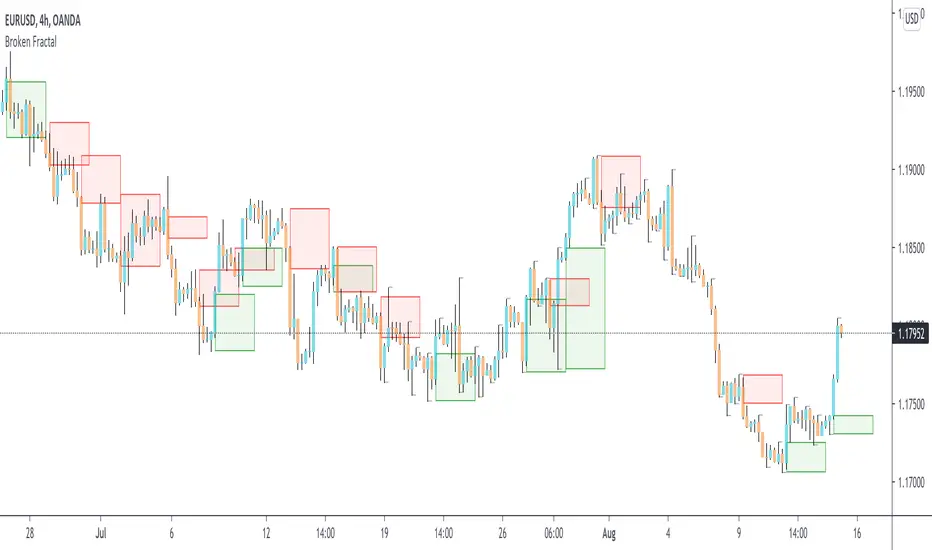
THE AV BREAKERTHE SHARKFIN
The AV Breaker uses a TDI to define sharkfins. You can set it up so it only
alert sharkfins at a specific level. Like 70/30 above/below. Or at anytime
it sharkfin the upper/lower band (Not using any level criteria.)
THE BREAKER
A breaker happens when an order block is taken out after a sharkfin setup.
This gives a HIGH probabillity reversal signal. If used with your own
higher Timeframe strategy.
THE ALERTS
The AV Breaker has built in Alert Function. You can however tell The AV breaker
what hours you want to see the alerts. You can also color the chart with a click
of a button during your alert hours session.
The Alert Session Plotted on Chart uses New York Time.
Settings:
- Time Session (Between what hours you want alert to be active)
- Highlight Session Range If you want chart to color selected "Time Sessiion Hours"
- Number of candles in The Order Block (Set your requirement for an Order Block)
TDI Settings: (The TDI do not need to be added to chart, but can be handy visually to add)
- TDI Low Level: 30 Default
- TDI High Level: 70 Default
- Use High/Low TDI Levels (If sharkfin has to be created above/below choosen TDI Level)
-- (Plus you can set any number on The TDI (Bands, RSI, MA's etc) --
How to use:
How you use it is up to you. However upon signal of The Breaker it can be good to wait
for a pullback to breaking opposite candle, or use a simple ABC 50% Fibs or similar.
Block_Saver_v1This is a script that lets you manually add in a "Zone" by top and bottom price, which I intended to use so I could "Save" or "Trace Over" lines from the Breakers/OrderBlock indicator. This is so you can take the same drawing across different time-frames and charts, and color-code them.
In the future I will be adding labels to the top and/or bottom of blocks so you can annotate more specifically which time-frame they were formed on, price level, etc.

bg_Breakers_orderBlocks_detection (Breakers)Version 0.1
Using Pivots / Swing Point detection, this script plots the final swing candle's body span from top to bottom with an extended horizontal line, with a mid-channel point at 50% between open and close.
Once the trend changes, these zones serve as support and resistance zones, and can help identify breakouts from ranges and probable reversal points moving forward.
To avoid clutter, the script allows you to select a specific date-range (start / end date) which the rule will only apply and plot for.
Other customizable options are the length in bars of the pivot/swing point detection, which is defaulted at 20 bars for both highs and lows.
Works best on time-frames 4H, 1D, etc. with some luck to be had in occasionally shorter time-frames as shown above.
4H:
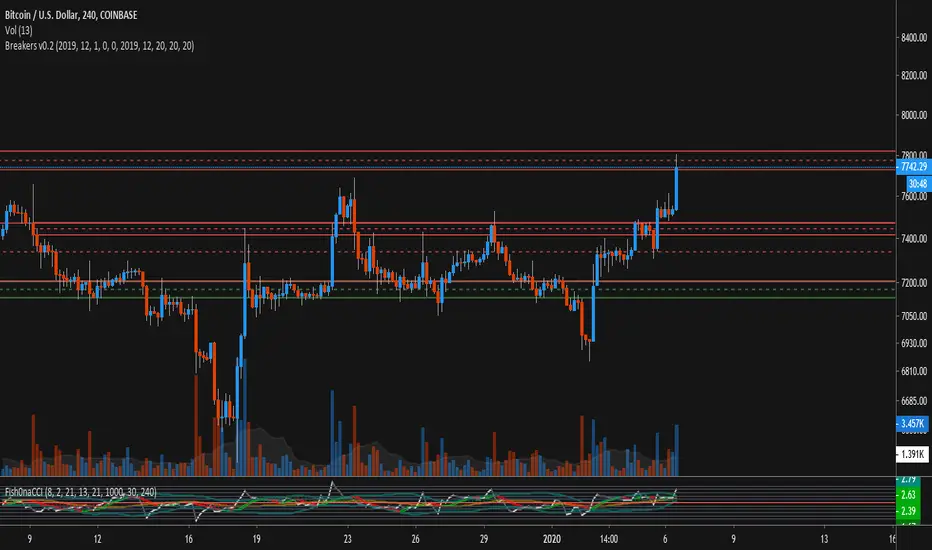
Quickfingers Luc's Base Breaking Indicator v2Overview of Features
This indicator attempts to implement Quickfingers Luc’s (QFL) Base Breaking trading methodology(1). It will monitor the chart price action and identify bases as they form and provide alert notifications for when bases and/or layers are cracked and respected.
This indicator is designed to locate pivot patterns and validate them to ensure they qualify as valid bases according to QFL’s trading principles by analyzing the percent price drop/bounce, volume and other settings to help you customize it to your chart. It will switch to new bases as they are identified and validated, thus there's the potential for bases to not be respected because it has switched to a new base.
It supports up to nine (9) layers with crack and respected alerts with chart X-Cross shapes to help you visualize the events.
Lastly, the indicator creates additional data points that are viewable in the data window panel, displaying the following metrics:
Bases Created
Bases Cracked
Bases Respected
Success Rate %
Median Drop %
Median Bounces %
Usage Information
The indicator can be applied to any chart at any time frame, but QFL principles advise to use at least 1 hour resolution for best results.
Direct message me to start the process of obtaining access.
Version/Release Information
This indicator is version 2 and is a re-write of the previous release
New features in the next release will include:
Defect fixes as they are identified
Multiple bases at the same-time, in order to improve respected base detection when switching to new bases
Any new features proposed by the user community
References
1. Luc, Quickfingers. (2016, July). “Quickfingers Luc, Some people love gardening, not me, I grow money (trading)” . Retrieved from steemit.com
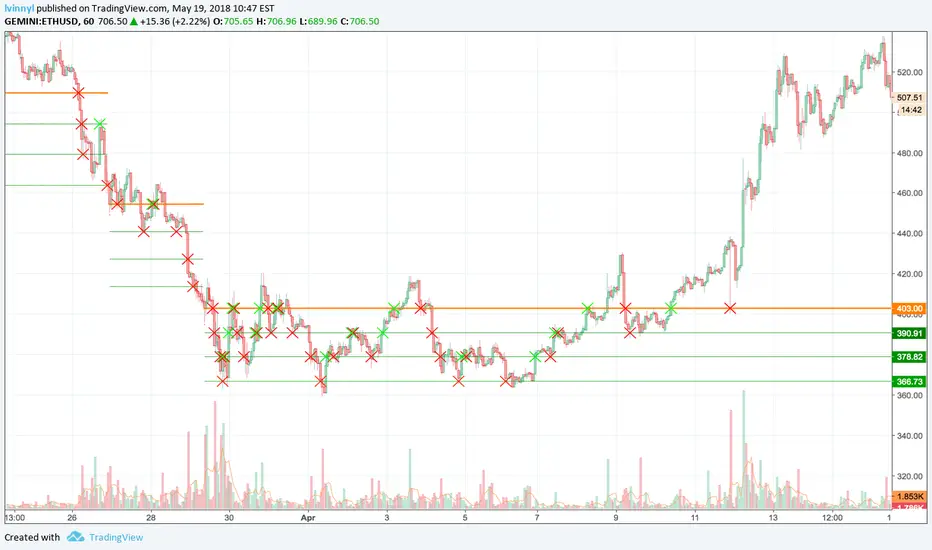
Quickfingers Luc's Base Breaking Indicator v1This script is an attempt to implement Quickfingers Luc's Base Breaking Strategy (steemit.com) where it will detect bases using pivot low detection, panic selling detection (price momentum), RSI and percent below base thresholds to trigger an alert condition.
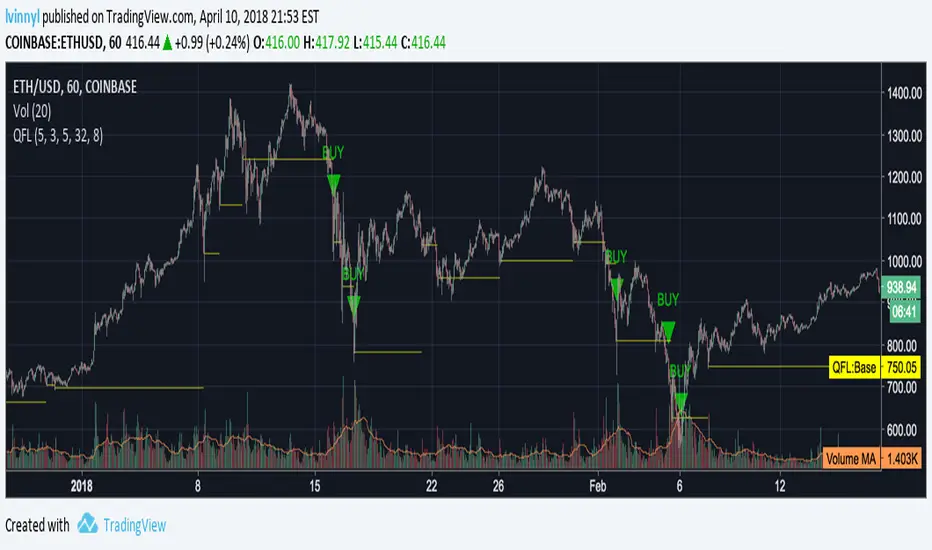
Arbitrage PulseArbitrage pulse is used to see the big picture.
The Bright Blue Line can not leave our Year Band (Dark Grey Band)
Whenever our money line (Lime green line) crosses that bright blue line good or bad things happen.
Typically our Major line( Orange Line) supports our money line but when it breaks support look out below!
