Adaptive Trend Breaks Adaptive Trend Breaks
## WHAT IT DOES
This script is a modified and enhanced version of "Trendline Breakouts With Targets" concept by ChartPrime.
Adaptive Trend Breaks (ATB) is a trendline breakout system optimized for scalping liquid futures contracts. The indicator automatically draws dynamic support and resistance trendlines based on pivot points, then generates trade signals when price breaks through these levels with confirmation filters. It includes automated target and stop-loss placement with real-time P&L tracking in dollars.
## HOW IT WORKS
**Trendline Detection Method:**
The indicator uses pivot high/low detection to identify significant price turning points. When a new pivot forms, it calculates the slope between consecutive pivots to draw dynamic trendlines. These lines extend forward based on the established trend angle, creating actionable support and resistance zones.
**Band System:**
Around each trendline, the script creates a "band" using a volatility-adjusted calculation: `ATR(14) * 0.2 * bandwidth multiplier / 2`. This adaptive band accounts for current market conditions - wider during volatile periods, tighter during quiet markets.
**Breakout Logic:**
A breakout signal triggers when:
1. Price closes beyond the trendline + band zone
2. Volume exceeds the 20-period moving average by your set multiplier (default 1.2x)
3. Price is within Regular Trading Hours (9:30-16:00 EST) if session filter enabled
4. Current ATR meets minimum volatility threshold (prevents trading dead markets)
**Target & Stop Calculation:**
Upon breakout confirmation:
- **Entry**: Trendline breach point
- **Target**: Entry ± (bandwidth × target multiplier) - default 8x for quick scalps
- **Stop**: Entry ± (bandwidth × stop multiplier) - default 8x for 1:1 risk/reward
- Multipliers adjust automatically to market volatility through the ATR-based band
**P&L Conversion:**
The script converts point movements to dollars using:
```
Dollar P&L = (Price Points × Contract Point Value × Quantity)
```
For example, a 10-point NQ move with 2 contracts = 10 × $20 × 2 = $400
## HOW TO USE IT
**Setup:**
1. Select your instrument (NQ/ES/YM/RTY) - point values auto-configure
2. Set contract quantity for accurate dollar P&L
3. Choose pivot period (lower = more signals but more noise, default 5 for scalping)
4. Adjust bandwidth multiplier if trendlines are too tight/loose (1-5 range)
**Filters Configuration:**
- **Volume Filter**: Requires breakout volume > moving average × multiplier. Increase multiplier (1.5-2.0) for higher conviction trades
- **Session Filter**: Enable to trade only RTH. Disable for 24-hour trading
- **ATR Filter**: Prevents signals during low volatility. Increase minimum % for more active markets only
**Risk Management:**
- Set target/stop multipliers based on your risk tolerance
- 8x bandwidth = approximately 1:1 risk/reward for most liquid futures
- Enable trailing stops for trend-following approach (moves stop to protect profits)
- Adjust line length to see targets further into the future
**Statistics Table:**
- Choose timeframe to analyze: all-time, today, this week, custom days
- Monitor win rate, profit factor, and net P&L in dollars
- Track long vs short performance separately
- See real-time unrealized P&L on active trades
**Reading Signals:**
- **Green triangle below bar** = Long breakout (resistance broken)
- **Red triangle above bar** = Short breakout (support broken)
- **White dashed line** = Entry price
- **Orange line** = Take profit target with dollar value
- **Red line** = Stop loss with dollar value
- **Green checkmark (✓)** = Target hit, winning trade
- **Red X (✗)** = Stop hit, losing trade
## WHAT IT DOES NOT DO
**Limitations to Understand:**
- Does not predict future trendline formations - it reacts to breakouts after they occur
- Historical trendlines disappear after breakout (not kept on chart for clarity)
- Requires sufficient volatility - may not signal in extremely quiet markets
- Volume filter requires exchange volume data (not available on all symbols)
- Statistics are indicator-based simulations, not actual trading results
- Does not account for slippage, commissions, or order fills
## BEST PRACTICES
**Recommended Settings by Market:**
- **NQ (Nasdaq)**: Default settings work well, consider volume multiplier 1.3-1.5
- **ES (S&P 500)**: Slightly slower, try period 7-8, volume 1.2
- **YM (Dow)**: Lower volatility, reduce bandwidth to 1.5-2
- **RTY (Russell)**: Higher volatility, increase bandwidth to 3-4
**Risk Management:**
- Never risk more than 2-3% of account per trade
- Use contract quantity calculator: Max Risk $ ÷ (Stop Distance × Point Value)
- Start with 1 contract while learning the system
- Backtest your specific timeframe and instrument before live trading
**Optimization Tips:**
- Increase pivot period (7-10) for fewer but higher-quality signals
- Raise volume multiplier (1.5-2.0) in choppy markets
- Lower target/stop multipliers (5-6x) for tighter profit taking
- Use trailing stops in strong trending conditions
- Disable session filter for overnight gaps and Asia session moves
## TECHNICAL DETAILS
**Key Calculations:**
- Pivot Detection: `ta.pivothigh(high, period, period/2)` and `ta.pivotlow(low, period, period/2)`
- Slope Calculation: `(newPivot - oldPivot) / (newTime - oldTime)`
- Adaptive Band: `min(ATR(14) * 0.2, close * 0.002) * multiplier / 2`
- Breakout Confirmation: Price crosses trendline + 10% of band threshold
**Data Requirements:**
- Minimum bars in view: 500 for proper pivot calculation
- Volume data required for volume filter accuracy
- Intraday timeframes recommended (1min - 15min) for scalping
- Works on any timeframe but optimized for fast execution
**Performance Metrics:**
All statistics calculate based on indicator signals:
- Tracks every signal as a trade from entry to TP/SL
- P&L in actual contract dollar values
- Win rate = (Winning trades / Total trades) × 100
- Profit factor = Gross profit / Gross loss
- Separates long/short performance for bias analysis
## IDEAL FOR
- Futures scalpers and day traders
- Traders who prefer visual trendline breakouts
- Those wanting automated TP/SL placement
- Traders tracking performance in dollar terms
- Multiple timeframe analysis (compare 1min vs 5min signals)
## NOT SUITABLE FOR
- Swing trading (targets too close)
- Stocks/forex without modifying point values
- Extremely low timeframes (<30 seconds) - too much noise
- Markets without volume data if using volume filter
- Illiquid contracts (signals may not execute at shown prices)
---
**Settings Summary:**
- Core: Period, bandwidth, extension, trendline style
- Filters: Volume, RTH session, ATR volatility
- Risk: R:R ratio, target/stop multipliers, trailing stop
- Display: Stats table position, size, colors
- Stats: Timeframe selection (all-time to custom days)
**License:** This indicator is published open-source under Mozilla Public License 2.0. You may use and modify the code with proper attribution.
**Disclaimer:** This indicator is for educational purposes. Past performance does not guarantee future results. Always practice proper risk management and test thoroughly before live trading.
---
## CREDITS & ATTRIBUTION
This script builds upon the "Trendline Breakouts With Targets" concept by ChartPrime with significant enhancements:
**Major Improvements Added:**
- **Futures-Specific Calculations**: Automated dollar P&L conversion using actual contract point values (NQ=$20, ES=$50, YM=$5, RTY=$50)
- **Advanced Statistics Engine**: Comprehensive performance tracking with customizable timeframe analysis (today, week, month, custom ranges)
- **Multi-Layer Filtering System**: Volume confirmation, RTH session filter, and ATR volatility filter to reduce false signals
- **Professional Trade Management**: Enhanced visual trade tracking with separate TP/SL lines, dollar value labels, and optional trailing stops
- **Optimized for Scalping**: Faster pivot periods (5 vs 10), tighter bands, and reduced extension bars for quick entries
Original trendline detection methodology by ChartPrime - used with modification under Mozilla Public License 2.0.
Breaks

Swing Breakout Sequence [LuxAlgo]The Swing Breakout Sequence tool enables traders to identify a directional price action scalping sequence comprising two unsuccessful breakouts in the same direction, with the expectation of a third.
🔶 USAGE
This sequence looks for pressure on one side of a swing zone.
The market tried to break out of the zone twice but failed. This led to a pullback into the zone after each attempt. Once a reversal inside the zone is identified, the sequence is complete. It is expected that the market will move from the final reversal within the zone to the final breakout attempt outside the zone.
The sequence of price action is as follows:
Point 1: Breakout attempt out of the swing zone
Point 2: Pullback into the zone
Point 3: Breakout attempt out of Point 1
Point 4: Pullback into the zone, tapping into Point 2 liquidity
Point 5: Reversal structure with Point 4 in the form of a double top or double bottom
This sequence assumes traders will be caught off-guard when they try to capitalize on the initial breakout at Point 1, which is likely to result in a loss. If the breakout at Point 3 fails, all traders will be caught out and switch positions.
If there is enough pressure in the swing zone to cause a reversal at Point 5, the trapped traders could be the start of the next breakout attempt.
🔹 Sequence Detection
Traders can define sequence behavior and adjust detection with three parameters from the Settings panel.
Disabling Points 4 and 5 will detect the most uncompleted sequences.
🔹 Showing/Hiding Elements
Traders can change the look of sequences by showing or hiding their parts using the Style settings.
🔶 SETTINGS
Swing Length: Number of candles to confirm a swing high or swing low. A higher number detects larger swings.
Internal Length: Number of candles to confirm a internal high or internal low. A lower number detects smaller swings. It must be the same size or smaller than the swing length.
🔹 Detection
Point 4 Beyond Point 2: It only detects sequences where Point 4 is beyond Point 2.
Show Point 5: Enable/disable Point 5 detection.
Require Equal H/L at Point 5: Enable/Disable double top/bottom detection at Point 5 within a given threshold. A bigger value detects more sequences.
🔹 Style
Show Sequence Path: Enable/disable a line between sequence points.
Show Boxes: Enable/disable colored boxes for each sequence.
Show Lines: Enable/disable horizontal lines from each point of the sequence.
Default Color: Define the color or enable/disable auto color.

LOWESS (Locally Weighted Scatterplot Smoothing) [ChartPrime]LOWESS (Locally Weighted Scatterplot Smoothing)
⯁ OVERVIEW
The LOWESS (Locally Weighted Scatterplot Smoothing) [ ChartPrime ] indicator is an advanced technical analysis tool that combines LOWESS smoothing with a Modified Adaptive Gaussian Moving Average. This indicator provides traders with a sophisticated method for trend analysis, pivot point identification, and breakout detection.
◆ KEY FEATURES
LOWESS Smoothing: Implements Locally Weighted Scatterplot Smoothing for trend analysis.
Modified Adaptive Gaussian Moving Average: Incorporates a volatility-adapted Gaussian MA for enhanced trend detection.
Pivot Point Identification: Detects and visualizes significant pivot highs and lows.
Breakout Detection: Tracks and optionally displays the count of consecutive breakouts.
Gaussian Scatterplot: Offers a unique visualization of price movements using randomly colored points.
Customizable Parameters: Allows users to adjust calculation length, pivot detection, and visualization options.
◆ FUNCTIONALITY DETAILS
⬥ LOWESS Calculation:
Utilizes a weighted local regression to smooth price data.
Adapts to local trends, reducing noise while preserving important price movements.
⬥ Modified Adaptive Gaussian Moving Average:
Combines Gaussian weighting with volatility adaptation using ATR and standard deviation.
Smooths the Gaussian MA using LOWESS for enhanced trend visualization.
⬥ Pivot Point Detection and Visualization:
Identifies pivot highs and lows using customizable left and right bar counts.
Draws lines and labels to mark broke pivot points on the chart.
⬥ Breakout Tracking:
Monitors price crossovers of pivot lines to detect breakouts.
Optionally displays and updates the count of consecutive breakouts.
◆ USAGE
Trend Analysis: Use the color and direction of the smoothed Gaussian MA line to identify overall trend direction.
Breakout Trading: Monitor breakouts from pivot levels and their persistence using the breakout count feature.
Volatility Assessment: The spread of the Gaussian scatterplot can provide insights into market volatility.
⯁ USER INPUTS
Length: Sets the lookback period for LOWESS and Gaussian MA calculations (default: 30).
Pivot Length: Determines the number of bars to the left for pivot calculation (default: 5).
Count Breaks: Toggle to show the count of consecutive breakouts (default: false).
Gaussian Scatterplot: Toggle to display the Gaussian MA as a scatterplot (default: true).
⯁ TECHNICAL NOTES
Implements a custom LOWESS function for efficient local regression smoothing.
Uses a modified Gaussian MA calculation that adapts to market volatility.
Employs Pine Script's line and label drawing capabilities for clear pivot point visualization.
Utilizes random color generation for the Gaussian scatterplot to enhance visual distinction between different time periods.
The LOWESS (Locally Weighted Scatterplot Smoothing) indicator offers traders a sophisticated tool for trend analysis and breakout detection. By combining advanced smoothing techniques with pivot point analysis, it provides a comprehensive view of market dynamics. The indicator's adaptability to different market conditions and its customizable nature make it suitable for various trading styles and timeframes.

Linear Regression Oscillator [ChartPrime]Linear Regression Oscillator Indicator
Overview:
The Linear Regression Oscillator is a custom TradingView indicator designed to provide insights into potential mean reversion and trend conditions. By calculating a linear regression on the closing prices over a user-defined period, this oscillator helps identify overbought and oversold levels and highlights trend changes. The indicator also offers visual cues and color-coded price bars to aid in quick decision-making.
Key Features:
◆ Customizable Look-Back Period:
Input: Length
Default: 20
Description: Determines the period over which the linear regression is calculated. A longer period smooths the oscillator but may lag, while a shorter period is more responsive but may be noisier.
◆ Overbought and Oversold Thresholds:
Inputs: Upper Threshold and Lower Threshold
Default: 1.5 and -1.5 respectively
Description: Define the upper and lower bounds for identifying overbought and oversold conditions. Values outside these thresholds suggest potential reversals.
◆ Candlestick Color Plotting:
Input: Plot Bar Color
Default: false
Description: Option to color the price bars based on the oscillator's value, providing a visual representation of market conditions. Bars turn cyan for positive oscillator values and blue for negative.
◆ Mean Reversion and Trend Signals:
Visual markers and labels indicate when the oscillator suggests mean reversion or trend changes, aiding in identifying key market turning points.
◆ Invalidation Levels:
Tracks the highest and lowest prices over a recent period to set levels where the current trend signal would be considered invalidated.
◆ Gradient Color Coding:
Utilizes gradient color coding to enhance the visualization of oscillator values, making it easier to interpret overbought and oversold conditions.
◆ Usage Notes:
Setting the Look-Back Period:
Adjust the "Length" input based on the timeframe and the type of trading you are conducting. Shorter periods are more suited for intraday trading, while longer periods can be used for swing trading.
Interpreting Thresholds:
Use the upper and lower threshold inputs to fine-tune the sensitivity of the overbought and oversold signals. Higher absolute values reduce the number of signals but increase their reliability.
Candlestick Coloring:
Enabling the "Plot Bar Color" option can help quickly identify the current state of the oscillator in relation to the zero line. This visual aid can be particularly useful in fast-moving markets.
Mean Reversion and Trend Signals:
Pay attention to the symbols and labels on the chart indicating mean reversion and trend changes. These signals are designed to highlight potential entry and exit points.
Invalidation Levels:
Use the plotted invalidation levels as stop-loss or signal invalidation points. If the price moves beyond these levels, the current trend signal is likely invalid.
This indicator helps traders identify overbought and oversold conditions, potential mean reversions, and trend changes based on the linear regression of the closing prices over a specified look-back period.

Pivotal MomentsPivotal Moments draws lines for each of up to 500 pivot high and pivot low levels that have never been revisited at the present moment in time. After the Pivotal Moments indicator has been loaded onto chart and any of the subsequent realtime bars that are formed touch or cross a pivot level it is deleted. The duration for how long any touched or crossed pivot levels remain on chart before deletion may be extended by N bars or N units of time.
There are user selectable options for the following:
• Pivot Bars Left : the number of lower highs or higher lows that must be formed before a possible pivot bar can occur.
• Right : the number of lower highs or higher lows that must be formed after potential pivot to validate a pivot bar.
• Lines Show As : the choice of line style to use for the drawn pivot levels includes Dashed, Dotted, or Solid.
• Wide : the number of lines wide for how thick the drawn pivot levels are desired to be on the chart.
• Delay Removal : the number of units that touched or crossed pivot levels will persist on chart.
• Units : the choice of which delay unit type includes nBars, nSecs, nMins, nHrs, or nDays.
• Extend Right : the number of bars right of current bar to extend drawn pivot levels.
• Show : the number of maximum recent drawn pivot levels to keep on chart.
• Colors Used : the colors used for pivots high, low, and dual pivot bars.
• Show Price Labels : the choice whether to show prices for levels.
• On Right : the choice to move prices to right of pivot levels.
• Show Pivot Bars : the choice to colorize pivot bars.
If desired, alerts can be received for whenever new touches or crosses occur for both pivot highs and pivot lows by creating a single Alert. Note that these alerts are triggered by realtime bars which by their very nature are repainting prices, thus the alert creation window will warn of this with an orange exclamation symbol. For an illustration of how to create alerts for this indicator click the chart below:
Credit: this indicator was originally built for @Luckshury, who has graciously given me permission to publish it publicly.
NOTICE: This is an example script and not meant to be used as an actual strategy. By using this script or any portion thereof, you acknowledge that you have read and understood that this is for research purposes only and I am not responsible for any financial losses you may incur by using this script!

Forex Session Breaks DST AWARE!There seems to be no open source forex trading session DST (Daylight Savings Time) aware scripts which I think is absurd. This amazing community deserves better. So I adapted some code by icostan adding DST capabilities.
Original code by icostan here
I added DST code. Warning may not be perfect yet. Could be a bug or two. It only supports 3 major sessions right now but you can add your own rules for the other timezones by copying my logic.
It is open source so please add the other sessions and regions as needed and update me please.

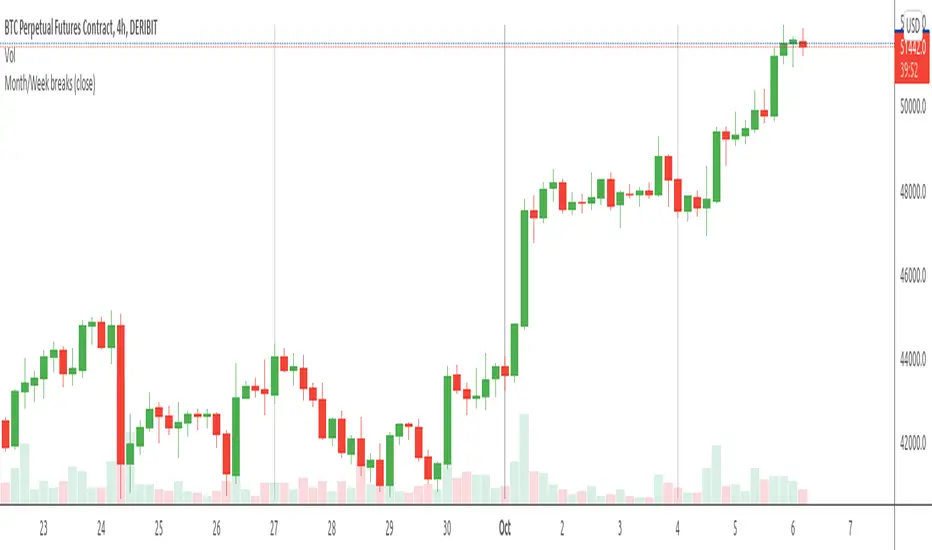
Month/week breaksThe big brother of Month-breaks indicator that shows vertical lines for "week breaks" as well. As always I try to make it non-intrusive but you can change the colors/lines in Settings.
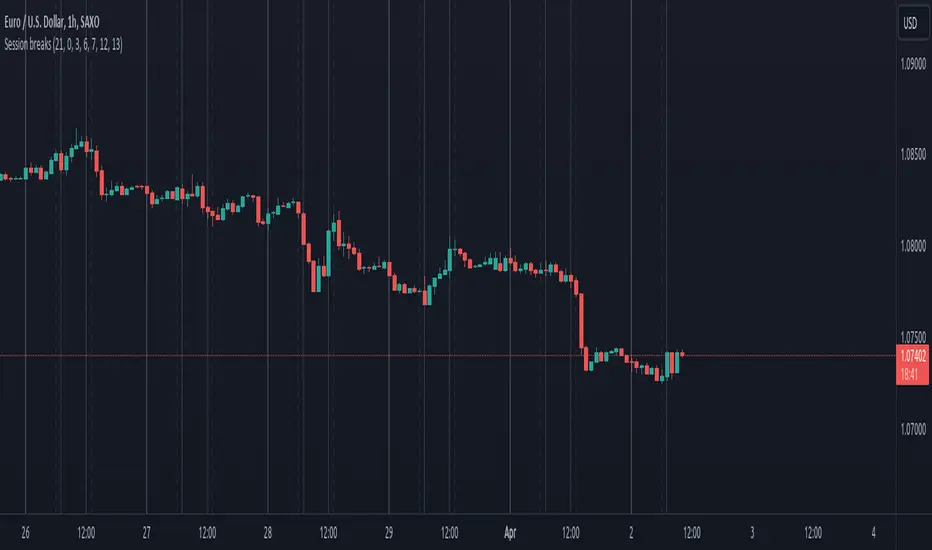
Session breaksThis indicator marks the start of each trading session around the world, starting with Tokyo at 0am UTC, London at 7am UTC, NY at 12pm and Sydney at 9pm, is non-intrusive (light gray vertical lines) and works with both UTC and exchanges' local time and handles DST / timezone offsets as well.
You can easily see that sometimes it acts as pivot-point especially on high volume.
And last, it is supposed to replace the "Session breaks" option that you can find in "Settings - Appearance" that only displays the end of session for the current exchange.
Bollinger Breaks and Cycles Indicator - JDThe BBC indicator shows price in relation to the upper (in red) and lower (in green) Bollinger Bands
It highlights breaks in the Bands, where the 0-line represents a price equal to the band.
These breaks can either be used as take-profit points or as entry points, depending on trend direction.
Entries can be at the beginning of a break (eg. for impulse or continuation moves)
or at the end (mostly for expected trend reversals)
To find the best setups, the BBC should be accompanied by other indicators (preferably ones that focus on different aspects)
The oscilating line in the middle indicates market cycles
JD.
#NotTradingAdvice #DYOR
