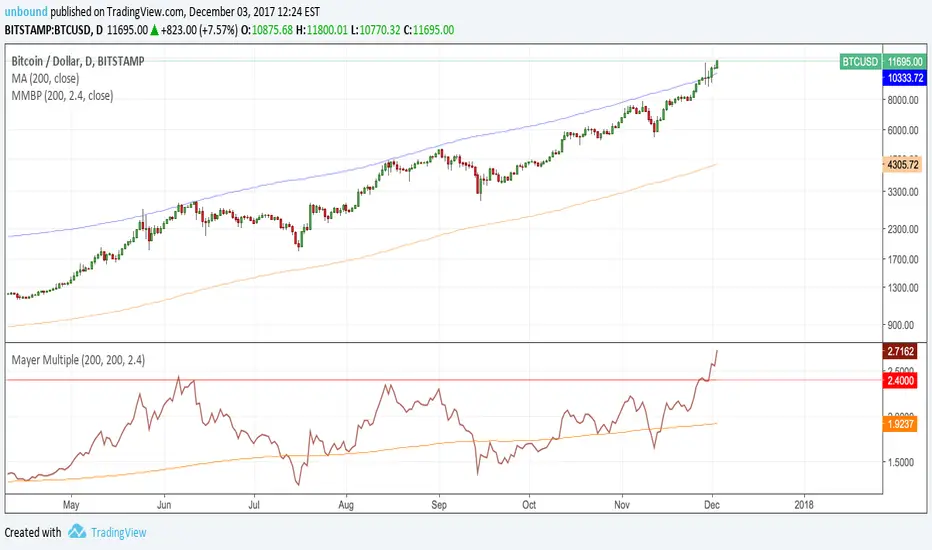
MayerMultiple Price BBThis charts an indicator created by Trace Mayer with some extras.
Plots:
- Mayer Multiple (may be hard to notice, since it overlays by default and stay at the bottom...)
- Price adjusted by Mayer Multiple Average with Bollinger Bands
Moving Average Function can be selected from a list with standard functions and following experimental extras:
- Volume Weighted Exponential Moving Average
- Volume Weighted Time Decayed Moving Average // similar to vwema, but alpha is calculated from length as half-life decay function (not sure if I got that right...)
Default MA function is sma, to keep it true to the original MM indicator, but I think VWEMA and VWTDMA may perform better with exponential nature of Bitcoin .
Suggestions and bug reports are welcome =)
Btc!
MayerMultiple Price BBThis charts an indicator created by Trace Mayer with some extras.
Plots:
- Mayer Multiple
- Price adjusted by Mayer Multiple Average with Bollinger Bands
Moving Average Function can be selected from a list with standard functions and following experimental extras:
- Volume Weighted Exponential Moving Average
- Volume Weighted Time Decayed Moving Average // similar to vwema, but alpha is calculated from length as half-life decay function (not sure if I got that right...)
Default MA function is sma, to keep it true to the original MM indicator, but I think VWEMA and VWTDMA may perform better with exponential nature of Bitcoin .
Suggestions and bug reports are welcome =)
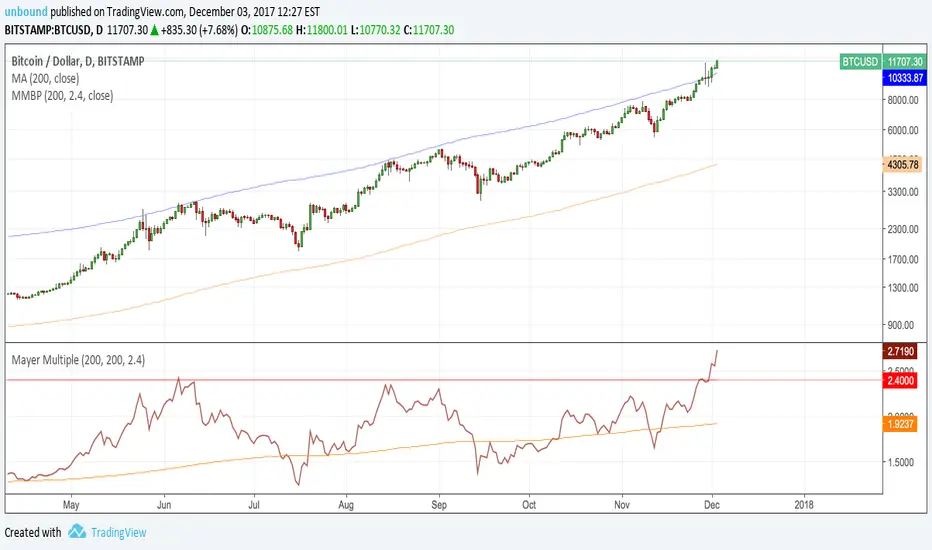
Mayer Multiple v2.0 - Klahr ThresholdThis is a simple update to the Mayer Multiple script by Unbound , which charts an indicator created by Trace Mayer and popularized by Preston Pysh.
The original post identified any price below 2.4x the 100-day MA as the BTC buy threshold. While the logic there is historically sound, it does not account for the fact that the BTC trend is parabolic in nature. With that in mind, I've attempted to update the 2.4x multiple to react based on the moving average of the Mayer Multiple itself. To do so, I simply found the number that, when added to the MM moving average, historically hit the 2.4x multiple during periods of low volatility. This turns out to be 1.17.
The green line represents the Klahr Threshold (is it obnoxious if I call it that? I've always wanted an indicator named after me). As you can see from the above chart, it hovers around 2.4x in late 2012 to early 2013, rises above it until mid 2014, and then stays below until 2016. It then stays almost exactly at 2.4x until April 2017, when it rises significantly above it for the first time since July 2014. The convergence in late 2012 and 2016-2017 is what leads me to believe that this should be the basis for the updated threshold.
It's entirely possible that there's a more robust method of calculating a reactive threshold (or a different number that should be added to the multiple's MA), but I think this is a good first step in refining the multiple to withstand the test of time.

Mayer MultipleFollowing Preston Pysh's "Bitcoin Mayer Multiple" study, I made this simple script to plot the Mayer multiple by calculating the ratio between bitcoin price and its 200-day moving average. It also plots the moving average of ratio itself.
Mayer Multiple Buy PriceFollowing Preston Pysh's "Bitcoin Mayer Multiple" study, I made this simple script to plot the recommended buy price based on the calculated 2.4x ratio between bitcoin price and its 200-day moving average. The ratio and SMA length have default values of 2.4 and 200 and can be adjusted.
BTC Buy Sell Guide (BSG) - MA & RSIhi BTChes,
green is when the price drops below the 100 day MA
red is the intensity of the 14 day RSI
BUY @ green
SELL @ the second or third RSI spike
most importantly, keep in mind fundamentals :)
-joie
BCH / BTC Domination Correlation - FINEXBlue Line shows the BCH dominance of a particular BTC price move.
Blue is fast, orange is slow
This version is the oscillator script of a 2-in-1 overlay + oscillator depending on which plots are enabled.
Use with "Actualized BCH+BTC Price Persistence BITFINEX" - the overlay version of this script.
SNOW_CITY

BTC Volume in FiatThis indicator shows volume in Fiat. You will get wierd numbers if you use it on non BTC-FIAT pairs.

BFXLS - BitFinex Long/Shorts
Small improvement upon the above script - all credit should really go to pigloo
Auto-detects ticker and automatically loads the long/shorts for it - so works on more than just BTC
Note - only works on BitFinex and only works for tickers which have long and short data available!
Green area = Longs
Red area = Shorts
Lighter area = Longs - Shorts

Volume in BTC v2I made this indicator to display the volume in BTC in the top left. I find it useful to quickly get the idea of how much BTC is being traded in each pair. It also showing the 7 candle moving average volume in BTC. This is configurable tho.
Please note, this is my first script, and after activating it you will get two annoying lines on your chart. You will have to open the indicators setting and disable those lines manually until i figure out how to do it in the script. Anyway, its a minor issue. I hope you will still enjoy the indicator. Have a nice day.

Volume in BTCThis is an experimental script i made for tracking volume in BTC on poloniex pairs. I am not a developer, i hardly even know how to code, so im sure there is a better way! I shared the script on request from someone else. I made the line 100% transparant because i only want the number in the top left. Have a nice day.

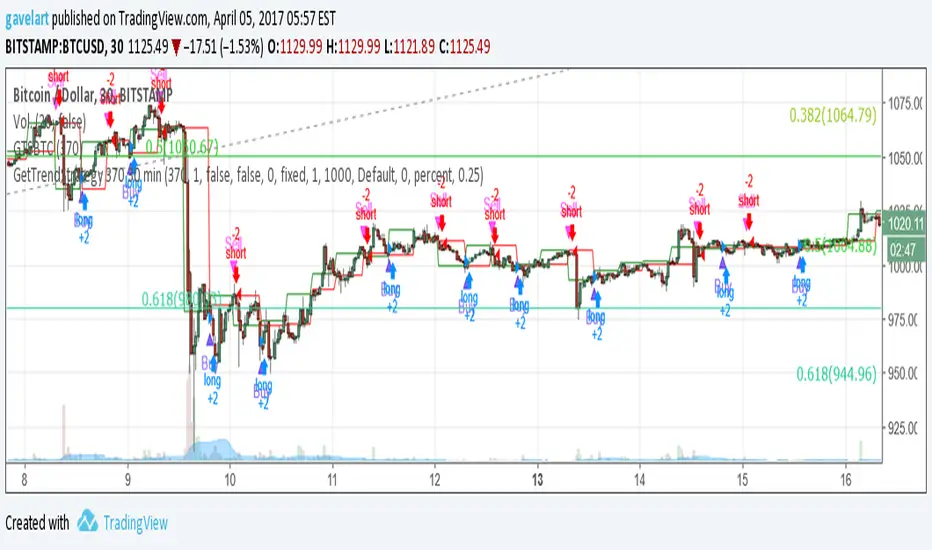
GetTrendStrategy 370 30 minModificación de la estrategia “GetTrendStrategy” optimizada para Bitcoin.
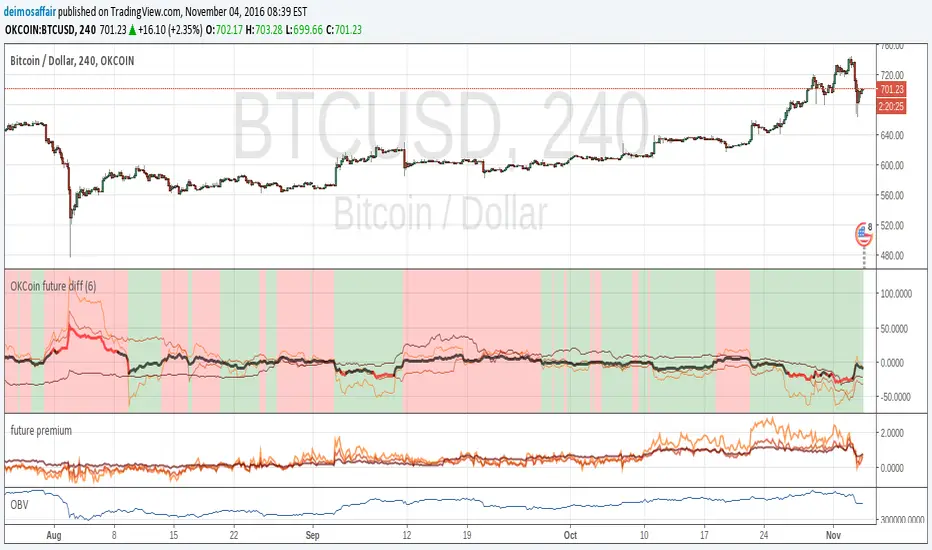
OKCoin future diffThis indicator checks the accuracy of okcoin futures against the current index. Example, check how the 1W future from 7 days ago matches the current spot value. The matches are on the 1W, 2W, 3M futures
The indicator bundles them together, makes a weighted average and shows it all.
the thin lines are the futures deltas for each of the futures(check the code to see the color of each).
the thick line is the compound indicator, the line is red when the value is too far off the spot price, black when it's <5%
background is green on "bullish", red for "bearish", take it as you want with many grains of salt :)
there is an input value (default = 1) to adjust time scales. the value is a multiplier for the number of periods in a day.
Example:
1D chart, input = 1
4h chart, input = 4h * 6 = 24h
using the incorrect adjustment for the wrong time scale, makes the indicator (even more) meaningless ;)
@ausbitbank 's experimSteemUSD + SBDUSD multi-exchange indicatorPlease see source code for basic instruction on usage
Send your appreciation / feedback to steemit.com

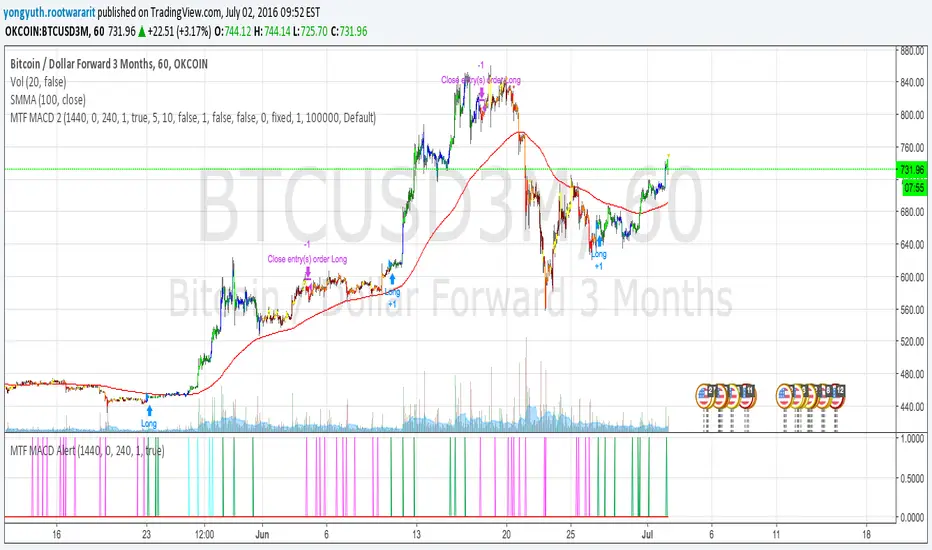
MTF MACD 2 By YuthavithiIf you want a good strategy without repaint. This one might be for you. Excellent profitable for BTCUSD3M for OKCoin.
It uses multiple time frame MACD for trading decision. To avoid repaint, set the delay period = 1 for both long term and midterm.
The idea is that, if long term, mid term and current time frame all agree on traidng direction, the trade will take place.
I also uses it in my automated trading bot with good result.
www.tradingview.com
(CRISIS) aggregateBTCvol v0.2.4Aggregate multiple exchange volumes into single indicator
This update adds:
*Moving Average
*Add/change/disable to up 6 securities without touching code.
*Monochrome mode for dark themes.

MACDouble + RSI (rec. 15min-2hr intrv) Uses two sets of MACD plus an RSI to either long or short. All three indicators trigger buy/sell as one (ie it's not 'IF MACD1 OR MACD2 OR RSI > 1 = buy", its more like "IF 1 AND 2 AND RSI=buy", all 3 match required for trigger)
The MACD inputs should be tweaked depending on timeframe and what you are trading. If you are doing 1, 3, 5 min or real frequent trading then 21/44/20 and 32/66/29 or other high value MACDs should be considered. If you are doing longer intervals like 2, 3, 4hr then consider 9/19/9 and 21/44/20 for MACDs (experiment! I picked these example #s randomly).
Ideal usage for the MACD sets is to have MACD2 inputs at around 1.5x, 2x, or 3x MACD1's inputs.
Other settings to consider: try having fastlength1=macdlength1 and then (fastlength2 = macdlength2 - 2). Like 10/26/10 and 23/48/20. This seems to increase net profit since it is more likely to trigger before major price moves, but may decrease profitable trade %. Conversely, consider FL1=MCDL1 and FL2 = MCDL2 + (FL2 * 0.5). Example: 10/26/10 and 22/48/30 this can increase profitable trade %, though may cost some net profit.
Feel free to message me with suggestions or questions.

altcoin index oscillatorUse
Compare alt coins to the "altcoin index", an average of a selection of alt coins.
Above zero means the coin you are viewing is worth more than the index, indicating the possibility of overbought.
Below zero indicating the opposite, a possibility of oversold.
Press the cog icon to select which alt coins you want included in the index.
Notes
The coins in the index are ALTBTC, meaning their value against BTC. Due to this the indicator is useless when viewing BTC only charts.

(CRISIS) Aggregate BTC Volume V0.1Agreggate volume from 3 exchanges into one indicator.
Securities can be changed in settings -> inputs

(CRISIS) BTC money flow oscilator V0.1Modified version of Ricado Santos' money flow oscilator.
now featuring 3 oscilators. Makes it easier to obseerve when dumps/pumps are targeting OKC futures contracts or just looking for divergences.
1x Aggregate of OKcoin:BTCCNY, Houbi:BTCCNY & Bitfinex:BTCUSD (Orange)
1X OKcoin 1 Week futures (pink)
1x OKcoin 3 Month futures (purple)
MACD, backtest 2015+ only, cut in half and doubledThis is only a slight modification to the existing "MACD Strategy" strategy plugin!
found the default MACD strategy to be lacking, although impressive for its simplicity. I added "year>2014" to the IF buy/sell conditions so it will only backtest from 2015 and beyond ** .
I also had a problem with the standard MACD trading late, per se. To that end I modified the inputs for fast/slow/signal to double. Example: my defaults are 10, 21, 10 so I put 20, 42, 20 in. This has the effect of making a 30min interval the same as 1 hour at 10,21,10. So if you want to backtest at 4hr, you would set your time interval to 2hr on the main chart. This is a handy way to make shorter time periods more useful even regardless of strategy/testing, since you can view 15min with alot less noise but a better response.
Used on BTCCNY OKcoin, with the chart set at 45 min (so really 90min in the strategy) this gave me a percent profitable of 42% and a profit factor of 1.998 on 189 trades.
Personally, I like to set the length/signals to 30,63,30. Meaning you need to triple the time, it allows for much better use of shorter time periods and the backtests are remarkably profitable. (i.e. 15min chart view = 45min on script, 30min= 1.5hr on script)
** If you want more specific time periods you need to try plugging in different bar values: replace "year" with "n" and "2014" with "5500". The bars are based on unix time I believe so you will need to play around with the number for n, with n being the numbers of bars.