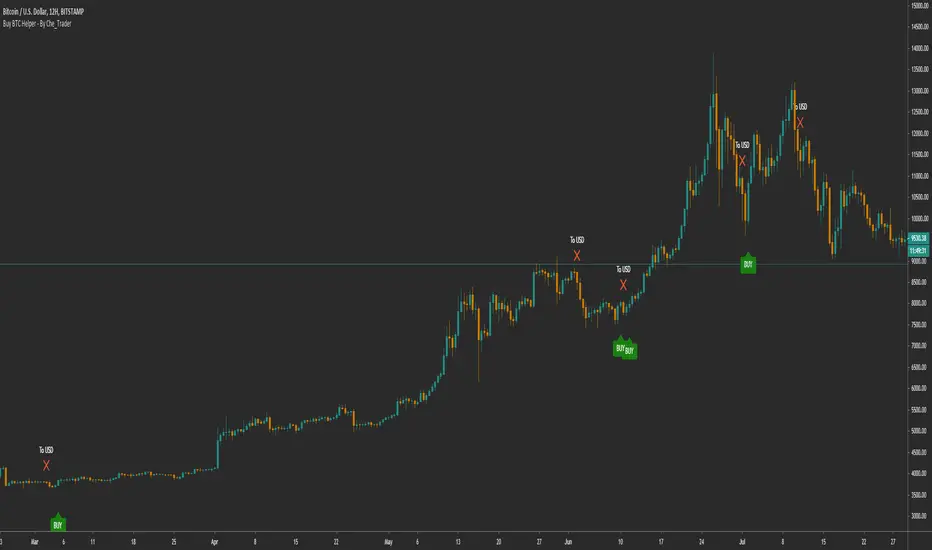
Buy BTC Helper - Buy SPOT, sell to USD (BTC-ETH) - By Che_TraderBuy BTC Helper - Buy SPOT, sell to USD (BTC-ETH) - By Che_Trader
The Buy Helper is specially designed for users who want to invest in BTC in the long term.
Usually you will make about 20-25 trades per year in spot trading.
You do not need a margin account or understand anything about trading.
Just follow the "BUY" and "To usd" signals to make sure you are on trend when BTC goes up but also take profit when BTC starts going down.
This simple tool has beaten the HOLD in all the years tested, also in bull trend or bear trend.
We'll develop this better.
*****************************************************************************************************************************************************************************
General stats from 2017 to 2020 are in the bottom, These are:
(**All data include 0.15% fees+slippage what is more than double the normal fees**)
- 8462% Gains (compound)
- 72 transactions
- 3.238 Profit Factor
- 18.58% Max drawdown
*****************************************************************************************************************************************************************************
The year-by-year analysis is very interesting:
*****************************************************************************************************************************************************************************
2017 HOLD result
+1254%
Buy helper 2017 results:
- +1214.5 % Gains
- 19 transactions
- 11% max drawdown
The 2017 profits are very similar, so you can expect similar win in next bull run.
This is something you'd expect, but it's hard to get in a bot.
*****************************************************************************************************************************************************************************
*****************************************************************************************************************************************************************************
2018 Hold Result
-71%
Buy helper 2018 results:
- +59% Gains
- 21 transactions
- 13.53% max drawdown
These results are particularly impressive. In a year in which BTC declined 72% and with a strategy of only LONG,
that is, without being able to take profit from the crashes,
we were able to finish the year with more than 59% of the money we made on the 2017 bull run.
*****************************************************************************************************************************************************************************
*****************************************************************************************************************************************************************************
2019 Hold Result
+94%
Buy helper 2019 results:
- +202% Gains
- 20 transactions
- 10.4% max drawdown
In 2019 with the buy helper you gained +100% the performance of hold BTC
*****************************************************************************************************************************************************************************
*****************************************************************************************************************************************************************************
2020 Hold Result (up to 04 may 2020)
+24.5%
Buy helper 2020 results:
- +39% Gains
- 11 transactions
- 15.43% max drawdown
In 2020 with the buy helper you gained +50% the performance of hold BTC
*****************************************************************************************************************************************************************************
*****************************************************************************************************************************************************************************
To get access, you can send me a PM here or at a link in the tradingview profile.
*****************************************************************************************************************************************************************************
Btc!
Gap Trading Strategy: CME BitcoinI created a strategy which finds gaps on CME Futures market for Bitcoin, BTC1! and opens a long or short position on the crypto exchange depending on what kind of gap was found (up or down) on CME.
Up gap: today open price > previous day high price
Down gap: today open price < previous day low price
Two lines below the main chart show when gaps appear. The green line represents the size of up gaps, when it crosses zero it gives a long signal. The red line - represents the size of down gaps, when it crosses zero - short signal.
Instead of having to look between multiple charts, this simply overlays the past weeks open and close should a gap appear.
Usage:
Strategy flips long / short depending of indicator signals. It could cut the position by stop loss or take profit.
Features:
ability to set stop loss and take profit in %
ability to set delta for gaps (if you want to filter small ones)
ability to choose strategy type. Standart: Long Up/Short Down || Inverse: Short Up/Long Down.
Backtesting:
Backtested on BTCPERP ( FTX ) and XBTUSD (Bitmex).
It shows a low drawdown, a small number of trades and 50% of profit for the 2020.
For example, I set high delta for down gaps to filter small ones
Strategy doesn't repaint.

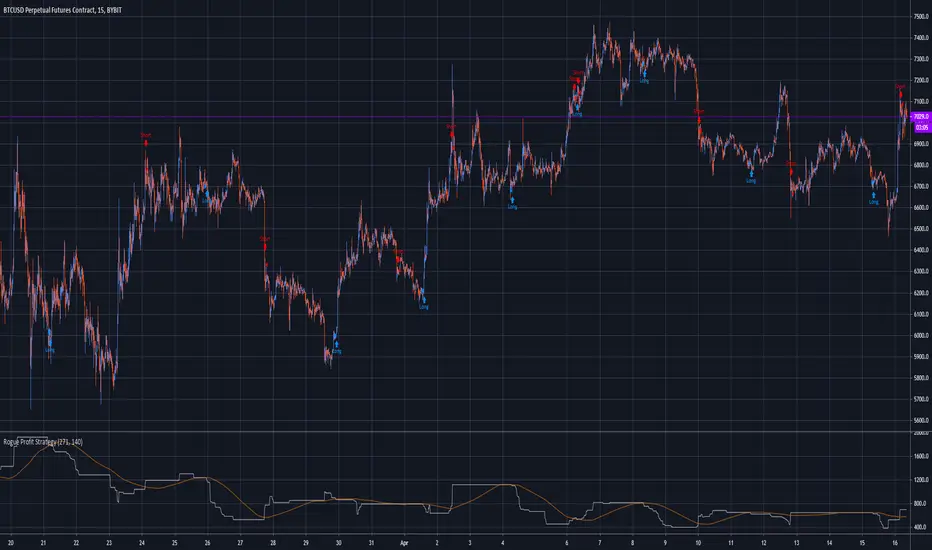
Rogue Profit StrategyThis is a complex script developed to measure specific volatility parameters and enter trades based on predetermined rules which are proprietary and will not be released, so don't ask for specific strategy settings.
The strategy keeps you in the market at all times either long or short. Parameters can be changed to better suit the asset your are trading, time frame and your particular trading style but the overall volatility rules for entering and exiting remain the same. It can be used to trade any asset but be aware the parameters you use for one asset, lets say Bitcoin, will not work with another asset like Forex. If the asset is on TradingView, you can use this indicator to trade it.
It is meant to trade pure price action candlesticks so do not use anything but a typical candlestick chart. You are going to have to put in some work and play around with the input parameters to make this strategy the most profitable for your trading style. Trading is hard but hopefully this strategy will help flatten the learning curve. This strategy is accompanied by an indicator study named "Rogue Profit Alert Indicator" that will work with setting alerts for manual or automated trading.
This strategy does NOT repaint.
This is a very powerful and profitable script that will simplify your trading and has been in development and tested for three years. Message for details on how to obtain access. Please allow up to 24 hours for a response.
eha Moving Averages StrategyMoving Average based strategies are very popular ones among both long-term investors and short-term traders as they can be tailored to any time frame. One of the main moving average strategies are crossovers. The very simple type is a price crossover , which is when the price crosses above or below a moving average to signal a potential change in trend.
Another strategy is to apply two moving averages to a chart: one longer (or slow) and one shorter (or fast). When the shorter-term MA crosses above the longer-term MA, it's a buy signal, as it indicates that the trend is shifting up (also known as “ Golden Cross ”). Meanwhile, when the shorter-term MA crosses below the longer-term MA, it's a sell signal, as it indicates that the trend is shifting down (which is also known as “ Dead/Death Cross ”).
This is a study to find a suitable trading strategy for 4-6 hour time frames. As you can see the performance is currently very poor. It has just generated almost 90 trades in a very long period from January 2017 to the time of publishing the study for the first time.
Moving averages work quite well in strong trending conditions but poorly in choppy or ranging conditions. Adjusting the time frame can correct this problem temporarily, although, at some point, these issues are likely to occur regardless of the time frame chosen for the moving average(s).
I am working on this basic strategy to make its performance better and I will update the post in the future. So keep in touch by following the post.
Why have I republished my study?
It sounds like TradingView stores and indexes scripts based on the title of the post rather than the actual title of the scripts and if one chose general terms as the title of the post, the TradingView script search engine may be unable to find it. So I decided to repost the strategy with a more searchable and unique prefix of " eha ".
Please provide me with your precious feedback.

Gekko DEMA StrategyThis script is based upon the Gekko trading strategy.
This strategy uses Exponential Moving Average crossovers to determine the current trend the market is in. Using this information it will suggest to ride the trend. Note that this is not MACD because it just checks whether the longEMA and shortEMA are % removed from each other.
* short is the short EMA that moves closer to the real market (including noise)
* long is the long EMA that lags behind the market more but is also more resistant to noise.
* the down threshold and the up threshold tell Gekko how big the difference in the lines needs to be for it to be considered a trend. If you set these to 0 each line cross would trigger new advice.
The base strategy has had money management logic added and has been tested for best results. Once you have access, you can modify these settings to find what works best for you.
Access to this strategy is FREE! Message me for more information on how to get access.

BlackPika TrendTrader StrategyIntroducing the Trend Trader
This strategy uses moving averages as its base and it can be effective for trading ALT/BTC pairs on higher timeframes (4H to D)
It is intended to give you a direction of the trend of the market. I personally use it to gauge the trend and trade major pairs.
The backtester has 0.1% commision set and a slippage of 1 tick.
Some more custom options are available as following
Fixed TP
Fixed SL
Trailing TP
Trailing SL
Nothing above constitutes as a financial advise. If you have any question, please feel free to ask !
Good luck in your trading.

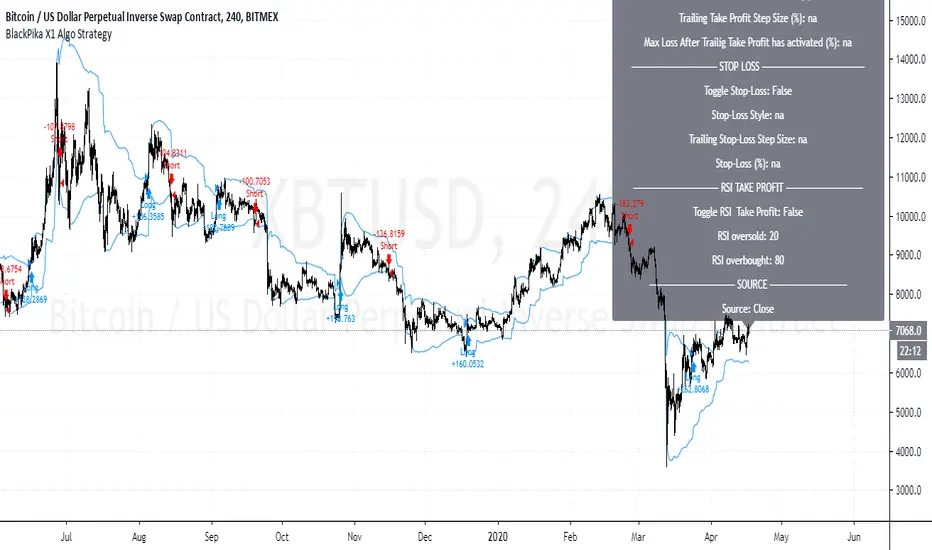
BlackPika X1 Algo StrategyBlackPika X1 Algo is a successor to the original BlackPika Algo.
It uses the following main elements:
RSI
ATR
ADX
Volume
Chopiness Filter
Trailing Profit
Fixed Profit
Trailing Stop loss
Fixed Stop Loss
Donchian channels and some more...
The backtest you see includes a commision of 1% and slippage of 1 tick. and the start date is from 2015
All the above mentioned settings are customisable, and can be adapted to your liking, timeframe and Asset.
Hit me up if you have any questions. This is only a backtest version.
All the best in your trading.
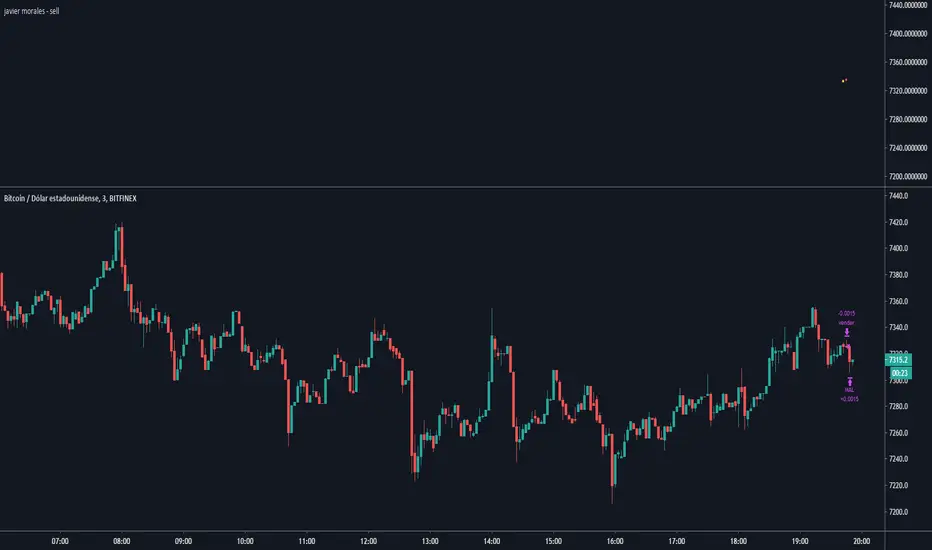
Javier Morales - sellEste script, creado por mi, opera sobre la gráfica BTC/USDT aunque puede ser utilizado en cualquier otra gráfica. Trabaja a la baja, en corto, aplicando una de las técnicas mas simples del trading, siempre que el precio de apertura de la vela anterior sea mayor que el precio de apertura de la vela posterior invierte una cantidad X, al final de la vela actual tanto si el precio ha subido como bajado cerrará la posición, pero si ha subido duplicará la inversión hasta que o bien se acabe el capital inicial o bien obtenga ganancias mayores que cero.
This script, created by me, operates on the BTC / USDT chart although it can be used on any other chart. Work downwards, in short, applying one of the simplest trading techniques, provided that the opening price of the previous candle is greater than the opening price of the subsequent candle invests an amount X, at the end of the current candle both if the price has risen or fallen, it will close the position, but if it has risen, it will double the investment until either the initial capital runs out or it makes profits greater than zero.
Javier Morales.
Cracking Cryptocurrency - Bottom Feeder Strategy TesterBottom Feeder - Strategy Tester
The Bottom Feeder is designed to algorithmically detect significantly oversold conditions in price that represent profitable buying opportunities. Combining this with it’s unique Stop and Target System, the Bottom Feeder is designed to return consistent return with minimal draw down. Whether used as a Market Bottom Detector or as a system for executing safe, profitable mean reversion trades, the Bottom Feeder is a powerful tool in any trader’s arsenal.
Bottom Feeder was designed to be used on BTCUSD, however it is also effective on other USD/USDT pairs. One will have to check the individual pair they wish to trade with the Strategy Tester to simulate performance.
Strategy displayed is from 2018-2021 on **Conservative Mode** with Percent of Equity (30%) enabled.
Options
Let’s go through the input options one by one, so that you are able to comfortably navigate all that this indicator has to offer. The link below will display a picture of the layout of the settings for your convenience.
For the sake of simplicity, let’s note now that all settings marked **Conservative Mode** will not work in Aggressive Mode.
Mode : Determines how aggressively Bottom Feeder generates a buy signal. In Conservative Mode, trades can only be opened once per candle and the stop and target will update as new signals appear. In Aggressive Mode, a separate trade is opened each time Bottom Feeder signals, which may be multiple times within one Daily candle.
Position Sizing Strategy : Determines what Risk Management system you will deploy when trading Bottom Feeder. Your options are “Percent of Equity” and “Distance to Stop Loss”. If Percent of Equity is selected, a trade size will be equal to a percentage of your equity, pursuant to the value in the ‘Percent of Equity’ box. If Distance to Stop Loss is selected, then your Position Size will be determined based off the distance to your stop loss and the value in the ‘Risk Percentage’ box.
Percent Of Equity : Determines what percentage of your equity will be allocated to each trade when ‘Position Sizing Strategy’ is enabled.
Risk Percentage : Determines the size of each trade if ‘Distance to Stop Loss’ strategy is enabled. This value reflects what percent of your account you will lose per trade if the trade hits your stop loss.
Plot Target and Stop Loss : Toggles on/off the visualized take profit and stop losses on the chart.
**Conservative Mode** TP Multiplier : This is an input box, it requires a float value. That is, it can accept either a whole number integer or a number with a decimal. This number will determine your Take Profit target. It will take whatever number is entered into this box and multiply the Average True Range against it to determine your Take Profit.
**Conservative Mode** SL Multiplier : See above - this will modify your Stop Loss Value.
**Conservative Mode** Average or Median True Range : This is a drop-down option, the two options are Average True Range or Median True Range. If Average True Range is selected, then this indicator will use the Average True Range calculation, that is, the average of a historical set of True Range values to determine the Average True Range value for Target and Stop Loss calculation. If Median True Range is selected, it will not take an average and will instead take the Median value of your historical look back period.
**Conservative Mode** True Range Length : This is an input that requires an integer. This will represent your historical lookback period for Average/Median True Range calculation.
**Conservative Mode** True Range Smoothing : This is a drop-down with the following options: Exponential Moving Average ( EMA ), Simple Moving Average ( SMA ), Weighted Moving Average ( WMA ), Relative Moving Average (RMA). This will determine the smoothing type for calculating the Average True Range if it is selected. Note: if Median True Range is selected above, this option will not have any effect as there is no smoothing for a Median value.
**Conservative Mode** Custom True Range Value? : This is a true/false option that is false by default. If enabled, it will override the Average/Median True Range calculation in favor of a users custom True Range value to be input below.
**Conservative Mode** Custom True Range Value : This is an input box that requires a float value. If Custom True Range is enabled this is where a user will input their desired custom True Range value for Target and Stop Loss calculation.
From Month/Day/Year to Month/Day/Year : This sets the Time Frame of your backtest for the Bottom Feeder Strategy. It will run FROM the date selected TO the date selected.
Stop and Target Description
Because Bottom Feeder is designed only to scalp the various market bottoms that can appear over time in the market and not to identify trends or to trade ranges, it’s imperative that the indicator notify us not just to when to enter our trades, but when to exit! In the service of that, CC Bottom Feeder has a built in Stop and Target system that tracks and displays the stop loss and take profit levels of each individual open trade, whether in Aggressive or Conservative Mode.
Conservative Mode Targeting: In Conservative Mode, Bottom Feeder signals are aggregated into a compound trade. The signal will appear as a green label pointing up below a candle, and will appear upon a candle close. If Bottom Feeder then generates another signal the stop loss and target price will be updated. The process will continue until the aggregated trade completes in either direction. On a trade with multiple signals, a larger position is slowly entered into upon each buy signal.
Aggressive Mode Targeting: In Aggressive Mode, Bottom Feeder signals are individually displayed as they are generated, regardless of how many signals are generated on any single candle. If Bottom Feeder continues to signal, each individual open trade will have their own stop loss and target that will be displayed on the chart until the individual trade completes in either direction. As opposed to a large compound position, aggressive mode represents a higher number of independent signals with their own stop and target levels.
Stop losses and targets are designed to be hard, not soft. That is, they are intended to be stop market orders, not mental stop losses. If price wicks through the target or stop, it will activate.

MONEY WORKERThe settings are only for bitfinex exchange btcusd.
Tested against a 5 minute time interval. The settings on it are for a 5 minute time frame.
Different settings may be required for different exchanges, parities and time periods.
Note that different parities and exchanges require new settings.
In non-pro free accounts, the profit results may differ as the time frame is deleted after a certain period of time.
Please note that you have to make different settings for different parities.
If you have questions and suggestions, you can send me a private message.
Note: I cannot recommend using Heikin ashi because this misleads you. It also includes a rule violation by house rules. And MOD PineCoders hides the strategy.

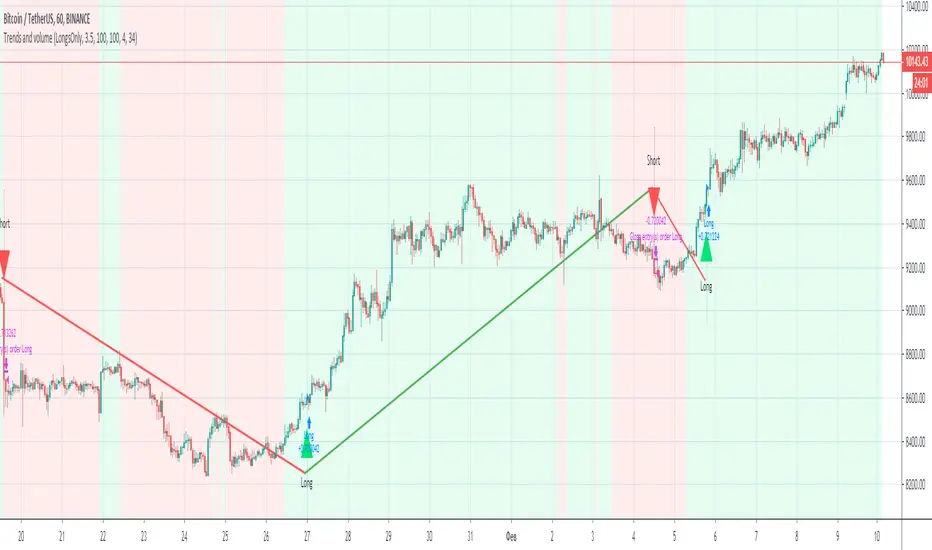
Trends and volume“Trends and volume” is a pair of ZigZag and Volume indicators. If in the ZigZag indicator a trend has changed from descending to ascending, and in the Volume indicator the volume of purchases (accumulation) exceeds the volume of sales (distribution), a signal to open a long position occurs.
Accordingly, the opening of a short position occurs with opposite indicators of trend and volume. The strategy has Volume smoothing settings and a ZigZag filter for selecting optimal settings on other instruments.
With default settings, the strategy allows you to make 2-4 successful trades per month, ideally shows the direction of the trades on the BINANCE:BTCUSDT , timeframe 1 hour.
Together with the “Trends and volume” backtest, you get the “Trends and volume alerts” indicator in which the alert function is built-in, you can set an alert for events: long entry and short entry.
Pay attention when you set alerts in the tradingview in the indicator, the true signal comes at the close of the hourly candle.
I can open demo access to the Trends and volume strategy for 15 days, for this write me.
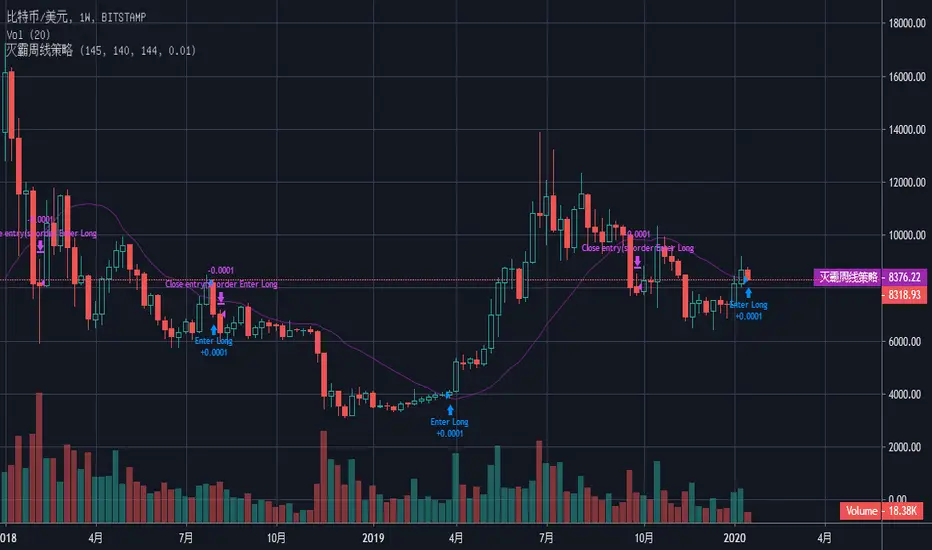
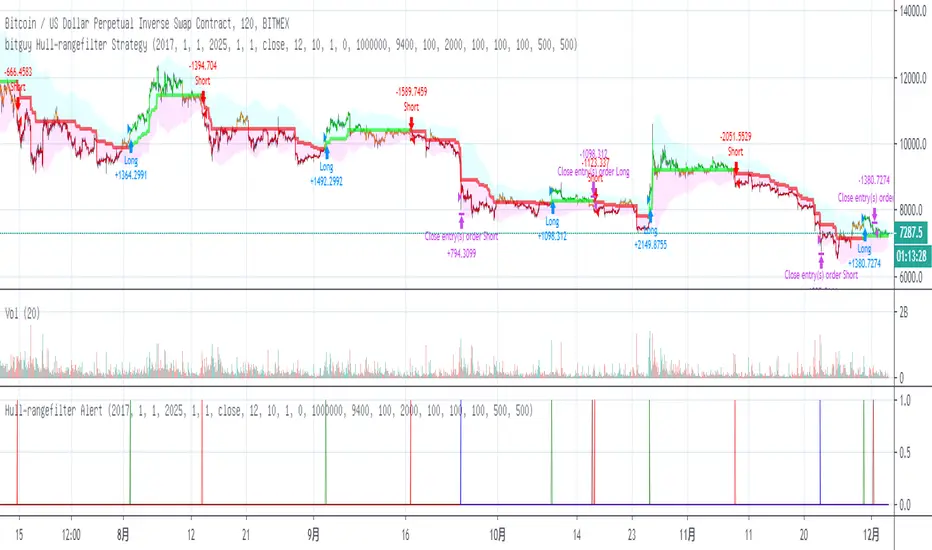
Bithanos Weekly Trend strategy 灭霸比特币BITSTAMP:BTCUSD
Just for bitcoin weekly trend strategy. It is mainly used for helping to decide buy and sell spot bitcoin.
"enter long" on chart meas the price may go up trend in future weeks.
"close the enter long order " on chart meas the price may not go up trend in future weeks.The indeterminacy of future may be go down trend or Shock market.
Recommended the "position%" to be "1".
推荐用bitstamp BTCUSD 交易对。
仅用于比特币周线趋势策略。主要用于帮助判断现货比特币的买卖。
“enter long ” 周线看涨
“close enter long” 周线止看涨,说明后面不确定,可能是震荡,也可能是下跌。
推荐设置 “position%参数”为“1” .
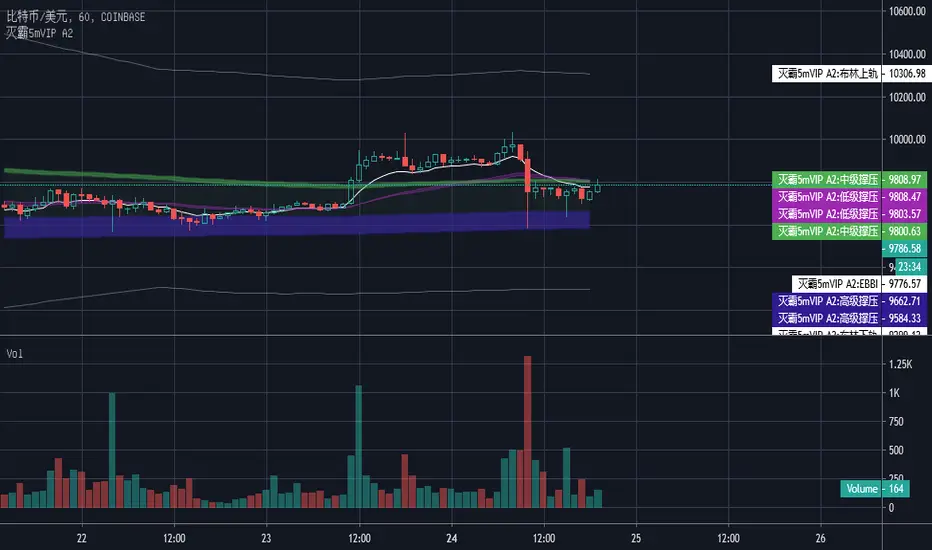
Bithanos 5m Strategy VIP 灭霸比特币灭霸比特币 5分钟策略 VIP版
Bithanos 5m Strategy VIP
COINBASE:BTCUSD
price should be coinbase BTCUSD.
1.Cointain boll band.
"L涨" means long,
"close entry L涨" means close the long order.
"S跌" means short,
"close entry S跌" means close the short order.
Just for bitcoin 5m timeframe .
价格选择:建议COINBASE BTCUSD.
1.包含 boll 带.
"L涨" 后市看涨,
"close entry L涨" 后市不看涨.
"S跌" 后市看跌,
"close entry S跌" 后市不看跌.
仅适用于比特币5分钟级别。
止损分享:0.25%-1% 幅度酌情根据杠杆止损,或者红色线最终止损。
Bithanos Daily Trend Strategy 灭霸比特币
BITSTAMP:BTCUSD
Ma cross up and down,make the "enter long" or "close order" symbol out the chart.
Modify the function of Ma by math as to reduce the mistake symbol.
"enter long" on chart meas the price may go up trend in next days.
"close the enter long order " on chart meas the price may not go up trend in next days.
the parameter can be changed,you can try the length89 the fastlength16,the position% 1.
Recommended parameter setting is 89 16 1
“enter long ” 日线看涨
“close enter long” 日线停止看涨
推荐参数设置依次是89 16 1

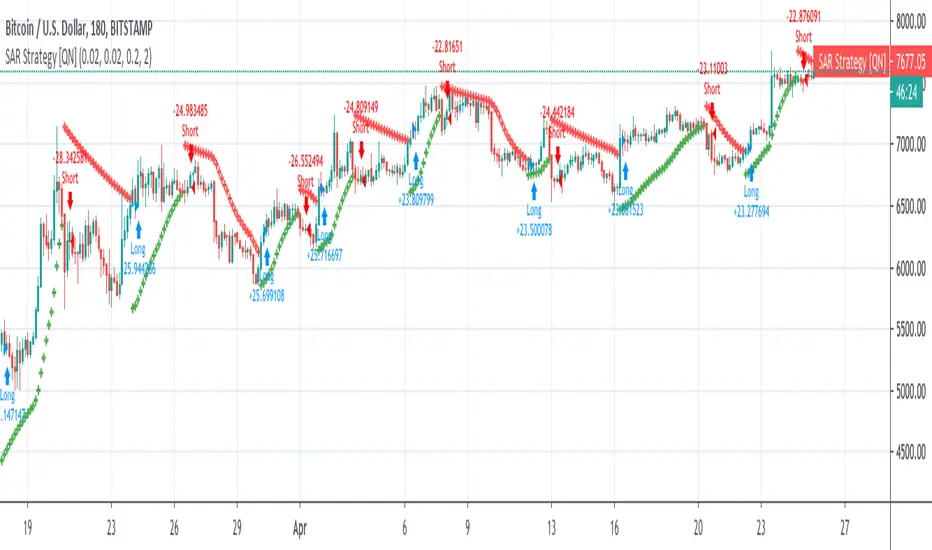
Parabolic SAR Strategy (on close) [QuantNomad]Created a Parabolic SAR strategy where price has to close under/above the level before for it to reverse. This way it should be a bit more stable and protect you from false breakouts.
It was impossible to adjust the built-in "sar" function so I implemented PSAR from scratch. So if you're interested in how it's work inside you can check the code and probably adjust to your need if you have a custom modification of PSAR in your mind.
Leverage Strategy and a few words on risk/opportunityHello traders,
I started this script as a joke for someone... finally appears it could be used for educational content
Let's talk about leverage and margin call
Margin Call
A margin call is the broker's demand that an investor deposit additional money or securities so that the account is brought up to the minimum value, known as the maintenance margin.
A margin call usually means that one or more of the securities held in the margin account has decreased in value below a certain point.
Leverage
A leverage is a system which allows the trader to open positions much larger than his own capital. ... “Leverage” usually refers to the ratio between the position value and the investment needed,
Strat
The strategy simulates long/short positions on a 4h high/low breakout based on the chart candle close.
The panel below shows the strategy equity curve. Activating the margin call option will show when the account would be margin called giving the settings
Casino
I'm not doing any financial recommendation here.
I made this strategy so that people include more risk management metrics into their strategy.
From the code, we see it's fairly easy to calculate a leveraged position size and a margin call flag - when that flag is hit, the system stops trading.
I simplified things to the extreme here but my point is that the leverage is a double-edge sword gift.
Assuming we always take the same position sizing, increasing the leverage speed up how fast a margin could be ..... called. (bad joke? feel free to tell me). Not saying it will, saying it introduces more risk by design.
Then one could say "I'll just turn off that stupid margin call option". And that's when someone starts backtesting with unrealistic market conditions.
Finally...
When I backtest I always assume the worst in every scenario possible (because I'm French), I always try to minimize the risk first (also because I'm French), keeping as close from 0 as possible (French again)
Then I add the "opportunity" component, looking to catch the maximum of opportunity while keeping the risk low.
It's like a Rubix cube puzzle - decreasing the risk is one side of the equation but whenever I try to catch more opportunity... my risks increases.
Then I update my risk... and now the opportunity decreases... (#wut #wen #simple)
Completely removing the risk from a trading strategy isn't something I wouldn't dare doing.
Trading involves risk. Being obsessed by decreasing the risk is what I do BEST :)
Dave

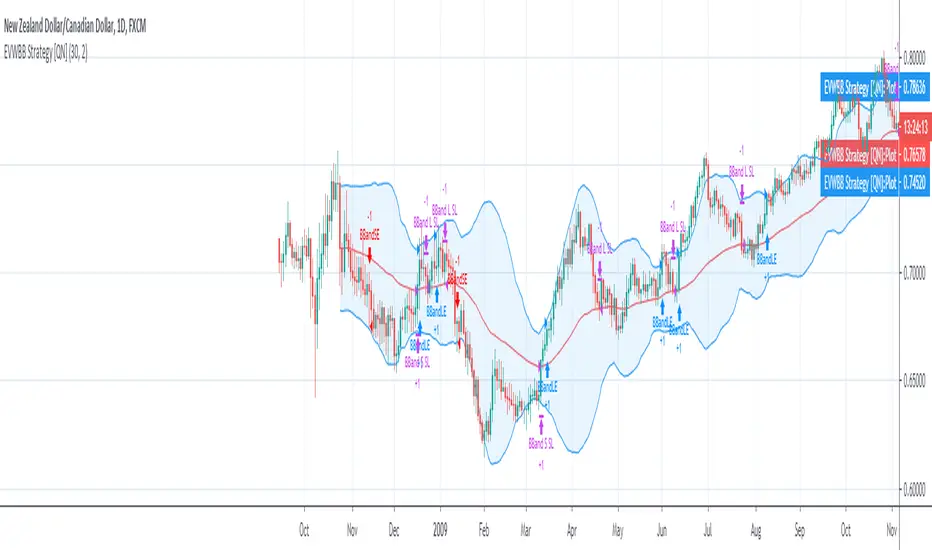
EVWBB Strategy [QuantNomad]It's my new strategy using EVWMA (Elastic Volume Weighted Moving Average).
Now I created a Bollinger Bands strategy where basis level is EVWMA.
It looks pretty interesting but you have to be careful with the entries/exits on the same bar, I'm using stop orders, so on big moves it happens pretty often.
In the next version, I will try to eliminate these issues.
Entry for this strategy happens when price crossover upper for long and lower for short. I exit both short and long on basis level.
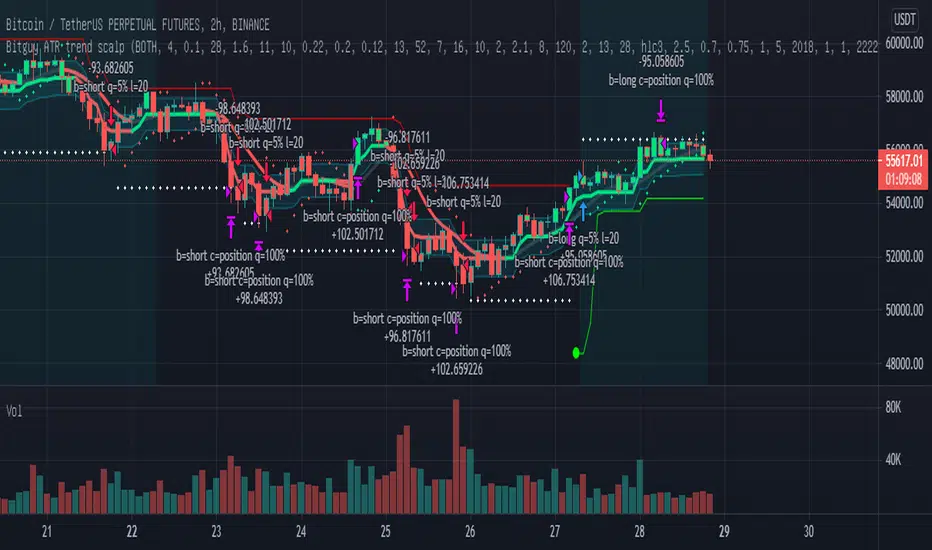
BITMEX Bybit binance HUOBI OKCOIN BTC DMI ATR DPO TREND strategyBITMEX Bybit binance HUOBI OKCOIN BTC DMI ATR DPO TREND strategy
This is a very effective trend strategy.
Strategy principle
HOW TO USE
set long position when a green arrow appears in the chart.
set short position when a red arrow appears in the chart.
For the long position and the short direction, you can set the stop profit & stop loss or trailing profit stop & trailing stop loss respectively.
When a purple arrow appears to close a position, an aggressive trader can go in the opposite direction when it is purple.
Strategy applicability
The default setting is for bitmex perpetual swap contract XBTUSD , bybit BTCUSD perpetual futures contract ,binance btcusdt Spot,Bitfinex BTCUSD Spot,bitflyer BTCJPY Spot,bithumb BTCKRW Spot,bitso BTCMXN Spot, bitstamp BTCUSD Spot,bittrex BTCUSDT Spot,Coinbase BTCUSD spot, deribit BTCPERP perpetual futures contract,gemini BTCUSD Spot,Hitbit BTCUSDT Spot,huobi BTCUSDT Spot KRAKEN XBTUSD spot,OKCOIN OKEX BTCUSD3M BTCUSD BTCUSD2W,Poloniex BTCUSDT Spot etc btc symbol with 30 minutes timeframe.
This indicator has broad applicability and can be applied to multiple different symbols.
This indicator also applies to the ETHUSD symbol etc, just adjust the default configuration.
Using the alert of the indicator, it can work well on the trading robot like Gunbot,autoview, without repaint false signals.
这是非常有效的趋势策略。
如何使用
在图表中出现绿色箭头就做多。
在图表中出现红色箭头就做空。
对于多头头寸和空头方向,您可以分别设置止损和止损或尾随利润止损和尾随止损;当出现紫色箭头时平仓,激进的交易者,可以在紫色时就做反方向。
策略适用性
默认设置是针对bitmex交易所 XBTUSD永久掉期合约,BYBIT交易所 BTCUSD永续期货合约,binance币安交易所 btcusdt现货,Bitfinex交易所 BTCUSD现货,bitflyer交易所 BTCJPY现货,bithumb交易所 BTCKRW现货,bitso交易所 BTCMXN现货,bitstamp交易所 BTCUSD现货,bittrex交易所 BTCUSDT现货,Coinbase交易所 BTCUSD现货,deribit交易所 BTCPERP永续期货合约,gemini双子星交易所 BTCUSD现货,Hitbit交易所 BTCUSDT现货,huobi火币交易所 BTCUSDT现货,KRAKEN交易所 XBTUSD现货,OKCOIN OKEX交易所 BTCUSD3M OK BTC季度合约 BTCUSD BTCUSD2W OK BTC次周合约,Poloniex BTCUSDT现货等2小时区间的btc交易。
Bitmex XBTUSD 30分钟 比特币期货 30 minutes Futures
这个指标具有广泛的适用性,可以适用多个不同交易品种。
该指标还适用于ETHUSD,ETHBTC,ADABTC,TRXBTC,XRPBTC交易品种等,只需调整默认配置即可。
Bitmex ETHUSD 30分钟 以太币期货 30 minutes Futures
使用该指标的警报设置,它可以在自动交易机器人上很好地工作,而无重绘错误的信号。
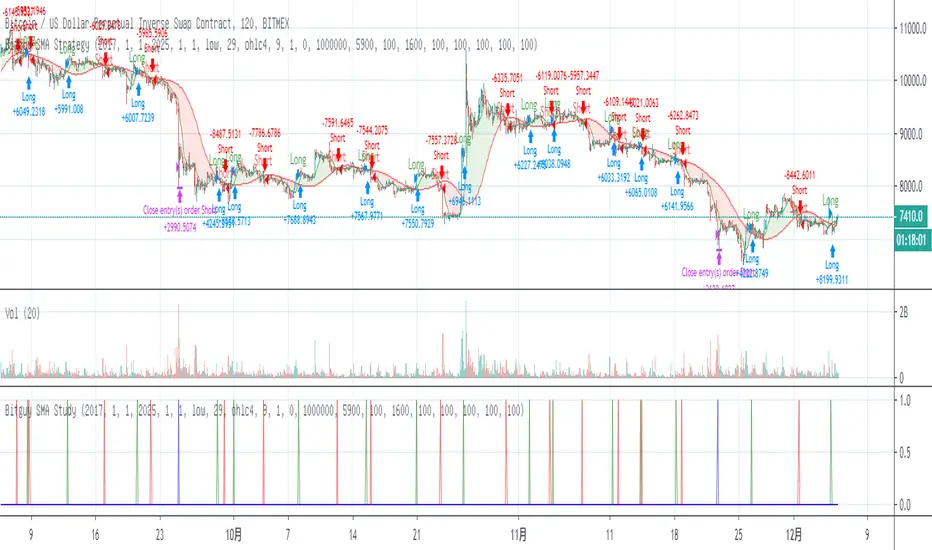
BITMEX Bybit binance Bitfinex OKCOIN BTC SMA TREND strategy BITMEX Bybit binance Bitfinex Coinbase OKCOIN BTC SMA TREND strategy
This is a very effective trend strategy.
BITMEX Bybit binance Bitfinex BTC SMA TREND strategy
Strategy principle
HOW TO USE
set long position when a green arrow appears in the chart.
set short position when a red arrow appears in the chart.
For the long position and the short direction, you can set the stop profit & stop loss or trailing profit stop & trailing stop loss respectively.
When a purple arrow appears to close a position, an aggressive trader can go in the opposite direction when it is purple.
Strategy applicability
The default setting is for bitmex perpetual swap contract XBTUSD , bybit BTCUSD perpetual futures contract ,binance btcusdt Spot,Bitfinex BTCUSD Spot,bitflyer BTCJPY Spot,bithumb BTCKRW Spot,bitso BTCMXN Spot, bitstamp BTCUSD Spot,bittrex BTCUSDT Spot,Coinbase BTCUSD spot, deribit BTCPERP perpetual futures contract,gemini BTCUSD Spot,Hitbit BTCUSDT Spot,huobi BTCUSDT Spot KRAKEN XBTUSD spot,OKCOIN OKEX BTCUSD3M BTCUSD BTCUSD2W,Poloniex BTCUSDT Spot etc btc symbol with 30 minutes timeframe.
This indicator has broad applicability and can be applied to multiple different symbols.
This indicator also applies to the ETHUSD symbol etc, just adjust the default configuration.
Using the alert of the indicator, it can work well on the trading robot like Gunbot,autoview, without repaint false signals.
这是非常有效的趋势策略。
如何使用
在图表中出现绿色线就做多。
在图表中出现红色线就做空。
对于多头头寸和空头方向,您可以分别设置止损和止损或尾随利润止损和尾随止损;当出现紫色箭头时平仓,激进的交易者,可以在紫色时就做反方向。
策略适用性
默认设置是针对bitmex交易所 XBTUSD永久掉期合约,BYBIT交易所 BTCUSD永续期货合约,binance币安交易所 btcusdt现货,Bitfinex交易所 BTCUSD现货,bitflyer交易所 BTCJPY现货,bithumb交易所 BTCKRW现货,bitso交易所 BTCMXN现货,bitstamp交易所 BTCUSD现货,bittrex交易所 BTCUSDT现货,Coinbase交易所 BTCUSD现货,deribit交易所 BTCPERP永续期货合约,gemini双子星交易所 BTCUSD现货,Hitbit交易所 BTCUSDT现货,huobi火币交易所 BTCUSDT现货,KRAKEN交易所 XBTUSD现货,OKCOIN OKEX交易所 BTCUSD3M OK BTC季度合约 BTCUSD BTCUSD2W OK BTC次周合约,Poloniex BTCUSDT现货等2小时区间的btc交易。
Bitmex XBTUSD 2H 比特币期货 2 hours Bitcoin Futures
Binance BTCUSDT 2H 比特币期货 2 hours Bitcoin spot
这个指标具有广泛的适用性,可以适用多个不同交易品种。
该指标还适用于ETHUSD交易品种等,只需调整默认配置即可。
Bitmex EOSBTC 30分钟 EOS合约 30分钟 ETHUSD Futures
Bitmex XRPBTC 30分钟 XRP合约 30分钟 ETHUSD Futures
使用该指标的警报设置,它可以在自动交易机器人上很好地工作,而无重绘错误的信号。
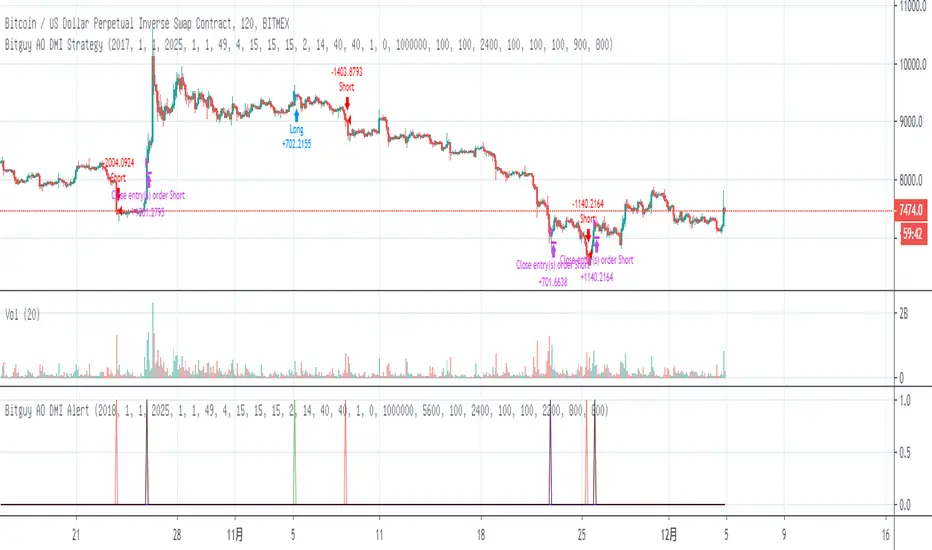
BITMEX Bybit binance Bitfinex BTC ETH AO DMI TREND strategyBITMEX Bybit binance Bitfinex Coinbase OKCOIN BTC ETH AO DMI TREND strategy
This is a very effective trend strategy.
Strategy principle
HOW TO USE
set long position when a green arrow appears in the chart.
set short position when a red arrow appears in the chart.
For the long position and the short direction, you can set the stop profit & stop loss or trailing profit stop & trailing stop loss respectively.
When a purple arrow appears to close a position, an aggressive trader can go in the opposite direction when it is purple.
Strategy applicability
The default setting is for bitmex perpetual swap contract XBTUSD , bybit BTCUSD perpetual futures contract ,binance btcusdt Spot,Bitfinex BTCUSD Spot,bitflyer BTCJPY Spot,bithumb BTCKRW Spot,bitso BTCMXN Spot, bitstamp BTCUSD Spot,bittrex BTCUSDT Spot,Coinbase BTCUSD spot, deribit BTCPERP perpetual futures contract,gemini BTCUSD Spot,Hitbit BTCUSDT Spot,huobi BTCUSDT Spot KRAKEN XBTUSD spot,OKCOIN OKEX BTCUSD3M BTCUSD BTCUSD2W,Poloniex BTCUSDT Spot etc btc symbol with 30 minutes timeframe.
This indicator has broad applicability and can be applied to multiple different symbols.
This indicator also applies to the ETHUSD symbol etc, just adjust the default configuration.
Using the alert of the indicator, it can work well on the trading robot like Gunbot,autoview, without repaint false signals.
这是非常有效的趋势策略。
如何使用
在图表中出现绿色线就做多。
在图表中出现红色线就做空。
对于多头头寸和空头方向,您可以分别设置止损和止损或尾随利润止损和尾随止损;当出现紫色箭头时平仓,激进的交易者,可以在紫色时就做反方向。
策略适用性
默认设置是针对bitmex交易所 XBTUSD永久掉期合约,BYBIT交易所 BTCUSD永续期货合约,binance币安交易所 btcusdt现货,Bitfinex交易所 BTCUSD现货,bitflyer交易所 BTCJPY现货,bithumb交易所 BTCKRW现货,bitso交易所 BTCMXN现货,bitstamp交易所 BTCUSD现货,bittrex交易所 BTCUSDT现货,Coinbase交易所 BTCUSD现货,deribit交易所 BTCPERP永续期货合约,gemini双子星交易所 BTCUSD现货,Hitbit交易所 BTCUSDT现货,huobi火币交易所 BTCUSDT现货,KRAKEN交易所 XBTUSD现货,OKCOIN OKEX交易所 BTCUSD3M OK BTC季度合约 BTCUSD BTCUSD2W OK BTC次周合约,Poloniex BTCUSDT现货等2小时区间的btc交易。
Bitmex XBTUSD 2H 比特币期货 2 hours Bitcoin Futures
Bitmex XBTUSD 30分钟 比特币期货 30 minutes Bitcoin Futures
这个指标具有广泛的适用性,可以适用多个不同交易品种。
该指标还适用于ETHUSD交易品种等,只需调整默认配置即可。
Bybit ETHUSD 30分钟 以太币合约 30分钟 ETHUSD Futures
使用该指标的警报设置,它可以在自动交易机器人上很好地工作,而无重绘错误的信号。
BITMEX Bybit binance BTC ETH HR TREND strategyBITMEX Bybit binance Bitfinex Coinbase OKCOIN BTC ETH HR TREND strategy
This is a very effective trend strategy.
Strategy principle
HOW TO USE
set long position when a green arrow appears in the chart.
set short position when a red arrow appears in the chart.
For the long position and the short direction, you can set the stop profit & stop loss or trailing profit stop & trailing stop loss respectively.
When a purple arrow appears to close a position, an aggressive trader can go in the opposite direction when it is purple.
Strategy applicability
The default setting is for bitmex perpetual swap contract XBTUSD , bybit BTCUSD perpetual futures contract ,binance btcusdt Spot,Bitfinex BTCUSD Spot,bitflyer BTCJPY Spot,bithumb BTCKRW Spot,bitso BTCMXN Spot, bitstamp BTCUSD Spot,bittrex BTCUSDT Spot,Coinbase BTCUSD spot, deribit BTCPERP perpetual futures contract,gemini BTCUSD Spot,Hitbit BTCUSDT Spot,huobi BTCUSDT Spot KRAKEN XBTUSD spot,OKCOIN OKEX BTCUSD3M BTCUSD BTCUSD2W,Poloniex BTCUSDT Spot etc btc symbol with 30 minutes timeframe.
This indicator has broad applicability and can be applied to multiple different symbols.
This indicator also applies to the ETHUSD symbol etc, just adjust the default configuration.
Using the alert of the indicator, it can work well on the trading robot like Gunbot,autoview, without repaint false signals.
这是非常有效的趋势策略。
如何使用
在图表中出现绿色线就做多。
在图表中出现红色线就做空。
对于多头头寸和空头方向,您可以分别设置止损和止损或尾随利润止损和尾随止损;当出现紫色箭头时平仓,激进的交易者,可以在紫色时就做反方向。
策略适用性
默认设置是针对bitmex交易所 XBTUSD永久掉期合约,BYBIT交易所 BTCUSD永续期货合约,binance币安交易所 btcusdt现货,Bitfinex交易所 BTCUSD现货,bitflyer交易所 BTCJPY现货,bithumb交易所 BTCKRW现货,bitso交易所 BTCMXN现货,bitstamp交易所 BTCUSD现货,bittrex交易所 BTCUSDT现货,Coinbase交易所 BTCUSD现货,deribit交易所 BTCPERP永续期货合约,gemini双子星交易所 BTCUSD现货,Hitbit交易所 BTCUSDT现货,huobi火币交易所 BTCUSDT现货,KRAKEN交易所 XBTUSD现货,OKCOIN OKEX交易所 BTCUSD3M OK BTC季度合约 BTCUSD BTCUSD2W OK BTC次周合约,Poloniex BTCUSDT现货等2小时区间的btc交易。
Bitmex XBTUSD 89分钟 比特币期货 89 minutes Bitcoin Futures
Bitmex XBTUSD 2H 比特币现货 2 hours Bitcoin Futures
Bitmex XBTUSD 1小时 比特币期货 1 hour Bitcoin Futures
Bybit BTCUSD 1小时 比特币合约 1 hour Bitcoin Futures
binance BTCUSDT 1H 比特币现货 1 hours Bitcoin Spot
这个指标具有广泛的适用性,可以适用多个不同交易品种。
该指标还适用于ETHUSD交易品种等,只需调整默认配置即可。
Bitmex ETHUSD 1小时 以太币合约 1H ETHUSD Futures
Binance ETHUSD 1小时 以太币现货 1H ETHUSD Spot
Bybit ETHUSD 1小时 以太币合约 1H ETHUSD Futures
使用该指标的警报设置,它可以在自动交易机器人上很好地工作,而无重绘错误的信号。
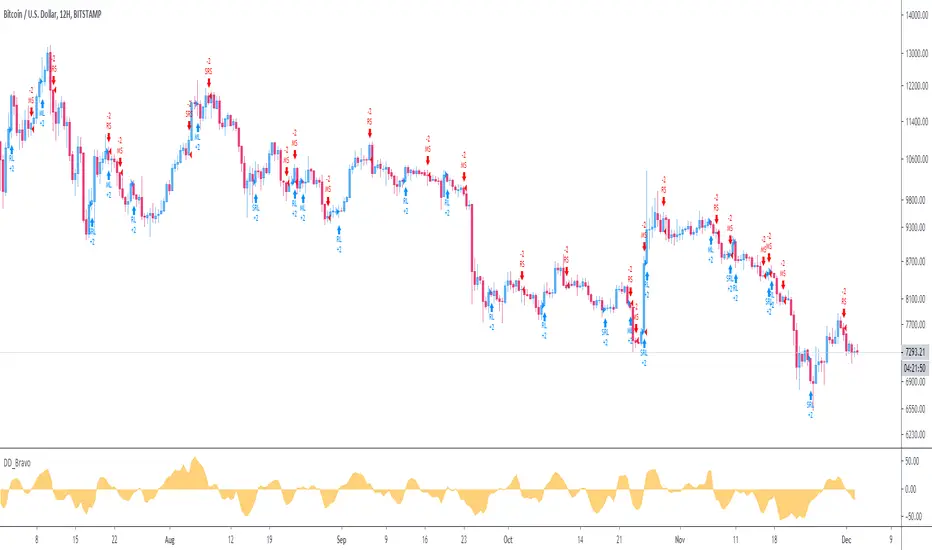
DD_Bravo_StrategyThe DD_Bravo_Strategy is a mean reversal strategy that captures oversold or overbought levels, and accordingly goes long or short. It is based on price difference between successive candles and normalization of this difference. It works best on 12H timeframe for BTCUSD.
DM me for details for access.
BITMEX Bybit binance bitstamp Coinbase HUOBI BTC ETH TRENDBITMEX Bybit binance bitstamp Coinbase HUOBI BTC ETH TREND
This is a very effective trend strategy.
Strategy principle
Constructs the trailing ATR stop above or below the price, and switches directions when the source price breaks the ATR stop.
Uses the Average Directional Index (ADX) to switch between ATR multipliers. The higher multiplier is used when the ADX is rising, and the lower ATR multiplier is used with the ADX is falling.
This ADX criteria further widens the gap between the source price and the trailing ATR stop when the price is trending,and lessens the gap between the ATR and the price when then price is not trending.
The ATR-ADX stop is effectively a double adapative stop that trails the price,by both adapting to the true range of the price, and the average directional change.
HOW TO USE
set long position when a green arrow appears in the chart.
When the stop is below the price (long trade) the value never decreases until the price intersects the stop, and it reverses to being above the price (short trade)。
set short position when a red arrow appears in the chart.
When the stop is above the price it will never increase until it is intersected by the price. As the true range and ADX change, the stop will move more quickly or more slowly.
For the long position and the short direction, you can set the stop profit & stop loss or trailing profit stop & trailing stop loss respectively.
When a purple arrow appears to close a position, an aggressive trader can go in the opposite direction when it is purple.
Strategy applicability
The default setting is for bitmex perpetual swap contract XBTUSD , bybit BTCUSD perpetual futures contract ,binance btcusdt Spot,Bitfinex BTCUSD Spot,bitflyer BTCJPY Spot,bithumb BTCKRW Spot,bitso BTCMXN Spot, bitstamp BTCUSD Spot,bittrex BTCUSDT Spot,Coinbase BTCUSD spot, deribit BTCPERP perpetual futures contract,gemini BTCUSD Spot,Hitbit BTCUSDT Spot,huobi BTCUSDT Spot KRAKEN XBTUSD spot,OKCOIN OKEX BTCUSD3M BTCUSD BTCUSD2W,Poloniex BTCUSDT Spot etc btc symbol with 2 hour timeframe.
This indicator has broad applicability and can be applied to multiple different symbols.
This indicator also applies to the ETHUSD ETHBTC EOSBTC BNBBTC symbol etc, just adjust the default configuration.
Using the alert of the indicator, it can work well on the trading robot like Gunbot,autoview, without repaint false signals.
这是非常有效的趋势策略。
策略原理
在价格之上或之下构造追踪的支撑压力位并在源价格突破压力位时的切换操作方向,使用平均趋向指数(ADX)与ATR系数之间切换。
当ADX上升时使用上升的ATR系数,而ADX时下降时使用下降的ATR系数。
当价格趋势变化时,ADX参数在价格趋向变大时使源价格止损点与后续ATR进一步扩大,并在价格趋向平缓时减小了ATR与价格之间的差距。
如何使用
ATR-ADX压力线通过适应价格的真实波动范围和平均趋向变动达到跟随价格的双适应性止损目的。当做多时,止损线低于价格,并随价格升高,直到止损线与价格相交,然后反转至高于价格,此时启动空头交易;
在图表中出现绿色箭头就做多。
当做空时,止损线高于价格,并随价格降低,直到止损线与价格相交,然后反转至低于价格,此时启动多头交易;在图表中出现红色箭头就做空。随着真实波动和ADX的变化,止损线将移动得更快或更慢。
对于多头头寸和空头方向,您可以分别设置止损和止损或尾随利润止损和尾随止损;当出现紫色箭头时平仓,激进的交易者,可以在紫色时就做反方向。
策略适用性
默认设置是针对bitmex交易所 XBTUSD永久掉期合约,BYBIT交易所 BTCUSD永续期货合约,binance币安交易所 btcusdt现货,Bitfinex交易所 BTCUSD现货,bitflyer交易所 BTCJPY现货,bithumb交易所 BTCKRW现货,bitso交易所 BTCMXN现货,bitstamp交易所 BTCUSD现货,bittrex交易所 BTCUSDT现货,Coinbase交易所 BTCUSD现货,deribit交易所 BTCPERP永续期货合约,gemini双子星交易所 BTCUSD现货,Hitbit交易所 BTCUSDT现货,huobi火币交易所 BTCUSDT现货,KRAKEN交易所 XBTUSD现货,OKCOIN OKEX交易所 BTCUSD3M OK BTC季度合约 BTCUSD BTCUSD2W OK BTC次周合约,Poloniex BTCUSDT现货等2小时区间的btc交易。
Bitmex XBTUSD 2H 比特币合约
Binance币安 BTCUSDT 2H 比特币现货
Bitfinex BTCUSD 2H 比特币现货
Bitstamp BTCUSD 2H 比特币现货
COINBASE BTCUSD 2H 比特币现货
HUOBI火币 BTCUSDT 2H 比特币现货
OKEX BTCUSD3M 2H 比特币季度合约
Bybit BTCUSD 2H 比特币合约
这个指标具有广泛的适用性,可以适用多个不同交易品种。
该指标还适用于ETHUSD ETHBTC EOSBTC BNBBTC交易品种等,只需调整默认配置即可。
bitmex ETHUSD 2H期货
binance ETHUSDT 2H现货
Bybit ETHUSD 2H合约
HUOBI火币 ETHUSDT 2H现货
OKCOIN ETHUSD1W 2H期货
binance币安EOSBTC 2H
Binance币安 ETHBTC 2H
使用该指标的警报设置,它可以在自动交易机器人上很好地工作,而无重绘错误的信号。
