bitFlyer DeviationbitFlyer price deviation percent between FXBTCJPY and BTCJPY.
bitFlyerのBTCFXとBTC現物の価格乖離(%)を表示します。
Btc!

weekend rally bloody mondayTracks the gain-loss of the price on Mondays and the range gain-loss from Monday (configurable) to Sunday. Then, it identifies Sunday's pumps that end with a Monday dump.

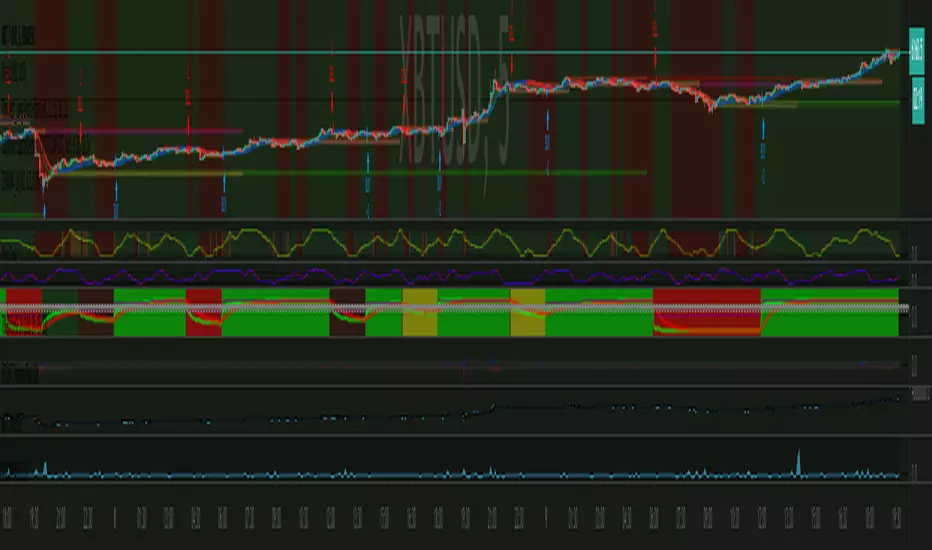
What is ProfitableBTC, BNB or your favorite Alt Coin? This indicator shows what is profitable at the moment. Red bars are alt days, green bars are BTC days. Otherwise, it is a BNB day.
Hmm, most of the time it is a BNB day!

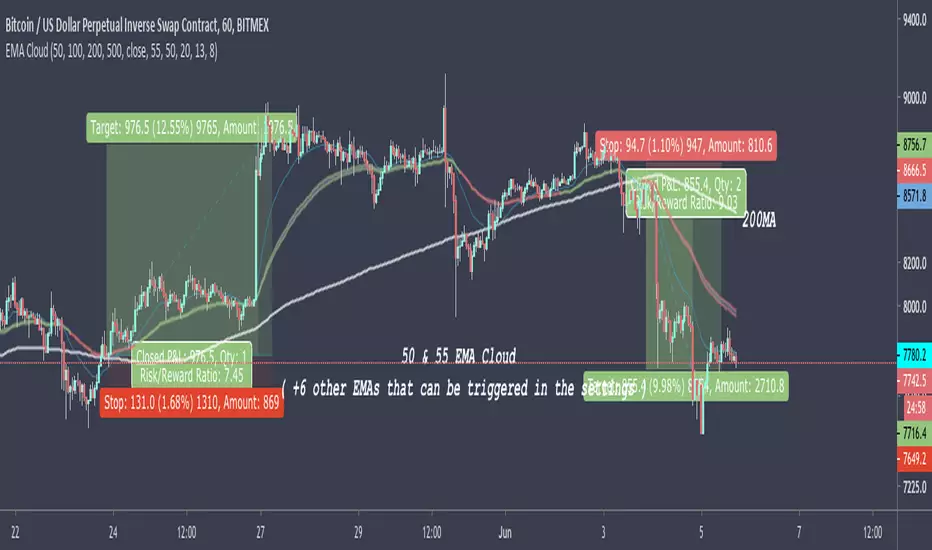
50 & 55 EMA CloudAfter testing thousands of indicators over the years, this simple EMA cloud indicator that I built is still my main weapon. It's always the first one I add to a blank charts and that is not going to change anytime soon.
I find EMAs and MAs are such underrated tools, By observing the price action surrounding these, I can see straight away if it's a good time to get into a trade or not.
As seen here, I also use the 200MA along with the 50/55EMA cloud to find extra strong support and resistances. If price starts to reject both the cloud and the 200MA at the same time/level, then it's a very good indication the price is going to make a big move in that direction as seen here in this chart.
[ssabu] Auto S/R Indicator - Beta Ver✅ Auto S/R Indicator - Beta Ver
리페인팅 없이 자동으로 지지저항을 그려주는 보조지표 입니다.
캔들 데이터를 불러오는 것이 한계가 있어서 하얀배경에만 지지저항을 출력 할 수 있습니다.
본 지표는 수평매물대를 참고하는데 도움을 주는 지표이며 신뢰도가 더 높은 버전으로 재업로드 될 예정입니다.
It is a supplementary index that automatically draws the support resistance without re-painting.
Since the ability to load the candle data is limited, it is possible to output the support resistance only to the white background.
This indicator is an indicator to help you refer to your level of residence and will be re-uploaded with a more reliable version.
✅ 비트일봉 예시
✅ 비트 12시간봉 예시
✅ 비트 4시간봉 예시
✅ 비트 1시간봉 예시

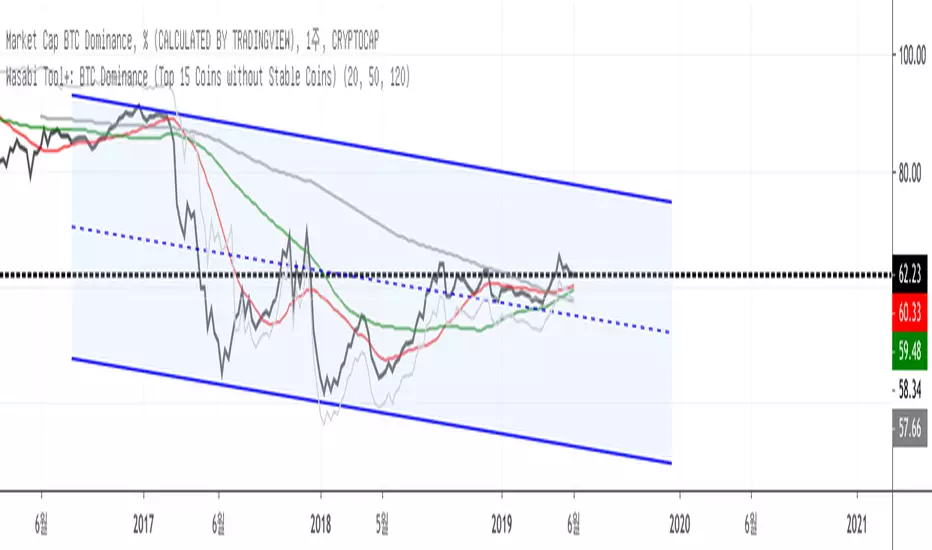
Wasabi Tool+: BTC Dominance (Top 15 Coins without Stable Coins)Wasabi Tool+: BTC Dominance (Top 15 Coins without Stable Coins)
This indicator is to show the valid and correct bitcoin dominance among the top 15 coins except stable coins.
The line in orange is the original BTC dominance provided by TradingView whereas the line in black is what this indicator illustrates as a correct and valid BTC dominance.
As of now, it looks like the TradingView's BTC dominance is showing some strange and invalid bars probably due to TOTAL2 with some corrupted bars.
This indicator will provide a vital information for investors to assess the current market situation.
Here's the list of all top 15 coins included in the calculation:
BTC
ETH
XRP
BCH
EOS
LTC
BNB
BSV
XLM
ADA
TRX
XMR
DASH
IOT
XTZ
"Korean"
현 지표는 스테이블 코인을 제외한 시총순위로 15개의 코인을 선별해서, 비트코인의 도미넌스를 정확하게 계산해서 보여주는 지표 입니다.
위의 차트상에 오렌지색선은 트레이딩뷰 제공 비트코인 도미넌스이고, 검은색선이 이 지표가 제공하는 정확한 비트코인 도미넌스 입니다.
현재, 트레이딩뷰의 비트코인 도미넌스는 TOTAL2의 왜곡된 값에 의해 도미넌스 정보도 왜곡된 값을 보여 주고 있는 것 같습니다.
현 지표는 현재 마켓 상황을 판단하는데 도움을 주는 중요한 정보를 정확하게 제공합니다.
총 시총에 포함된 15개 탑 코인은 아래와 같습니다.
BTC
ETH
XRP
BCH
EOS
LTC
BNB
BSV
XLM
ADA
TRX
XMR
DASH
IOT
XTZ
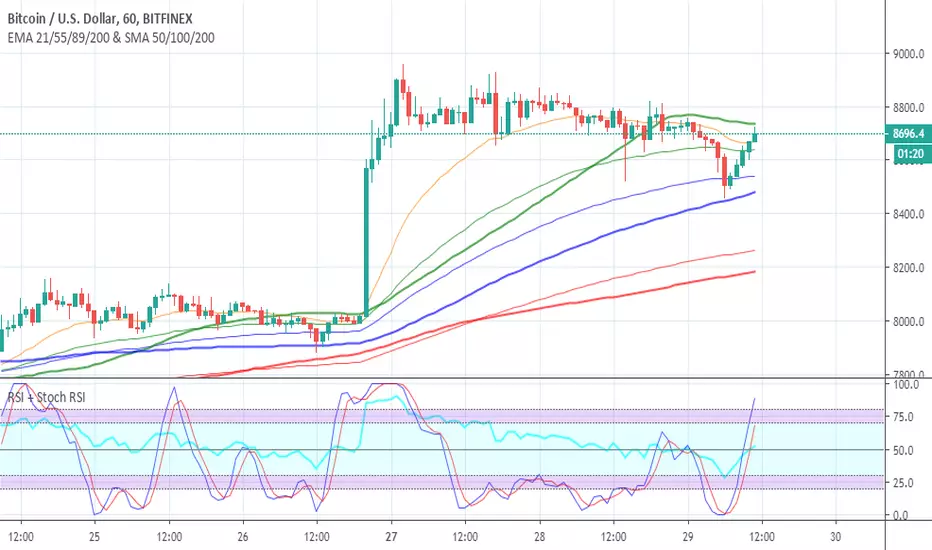
EMA 21/55/89/200 & SMA 50/100/200Free to use indicator combining all important time periods for two of the most valuable trading tools: EMAs and SMAs . As you can see on the chart and previous time periods, BTC often bounces off these, giving you an insight into possible future price movement. Add to your favourite scripts now at the bottom of this page and stay ahead of the game.
Switching off all except the most important periods in the indicator settings (21 & 55 EMA + 100 & 200 MA) can help keep a nice clean trading chart, if that is your preference.
SIMPLE MOVING AVERAGE
Smooths out the price across each period to reveal short, medium and long term trends and potential areas of support or resistance.
50, 100 and 200 are three of the most commonly used/respected moving averages.
The 200MA in particular provides very strong support/resistance on longer time frames.
EXPONENTIAL MOVING AVERAGE
A slightly more sophisticated version of the moving average, the EMA gives more weight to recent price action (i.e. a recent big move up/down will be reflection sooner... "the trend is your friend").
21, 55, 89 and 200 are four of the most commonly used/respected exponential moving averages.
The 21 and 55 EMA are undoubtedly the most powerful, and somewhat a self-fulfilling prophecy since so many people follow them.
Just so you know...
Green = 55/50, blue = 89/100, red = 200/200
EMAs are shown with thinner lines (as they change direction faster, think light and quick)
SMAs are shown with thicker lines (as they change direction slower, think heavier and more respected)
My free Combined RSI and Stochastic RSI Indicator , is also shown on the chart above and will save you valuable space on your trading screen, since you are strictly limited to the number of indicators you can use at one time. Give it a try and you'll wonder why you ever had separate indicators for RSI and Stoch RSI clogging up both your screen and indicator allowance.
These tools are for educational purposes only and not a recommendation to buy or sell. Always do your own research before trading.
Bitcoin On-Chain OBVThe Bitcoin On-Chain OBV is a port of the classical volume oscillator that reflects the accumulation registered through the On-Chain Transactions.
It also allows to source through the aggregated combined exchange volumes.
The indicator can show the value either in BTC or USD.

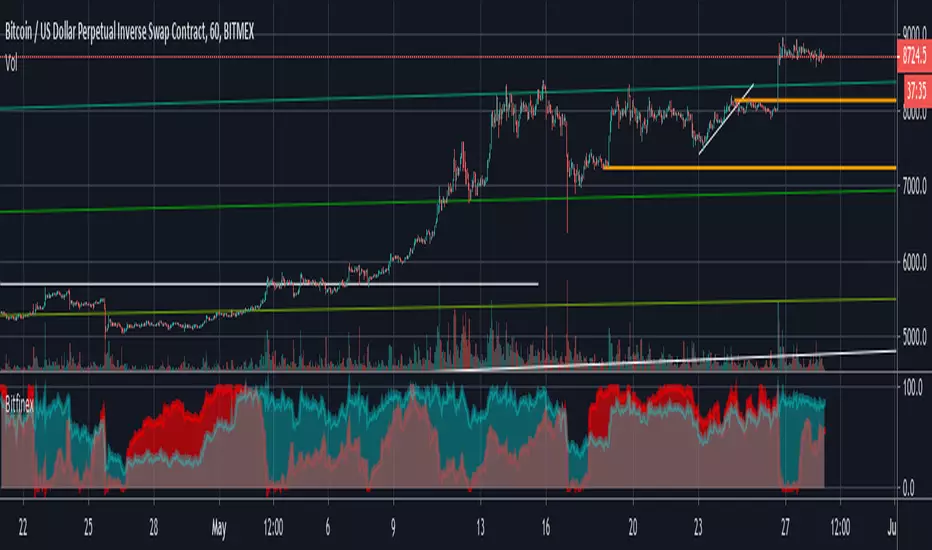
stress Birfinex and BitmexThis script identifies stress points in the major exchanges, recommended use in 1h.
BTC SKVPrivate indicator,
I don't sell/rent indicators, i do it for myself and to share with the people I work with.
This indicator is a clone of @everget so i can't make it open source.
If you would like to get it, you can buy it =>
Trust me it can take many hours/days to make a indicator, this one in particulary will need some update in the futur, paid indicators with support can save you time & money.
Thanks to @everget for his idea, and aslo for all the free code that he share.
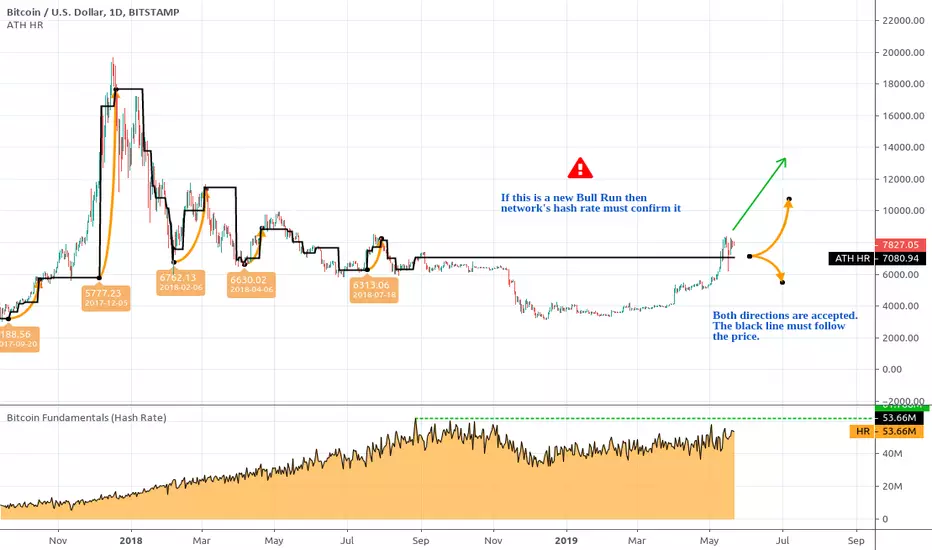
Bitcoin All-Time High (ATH) Hash Rate Level An experimental Bitcoin TotheMoon confirmation tool. Represents a mapping of Bitcoin's All-Time Hash Rate to the corresponding Bitcoin's price on the chart.
As always, you can support the author with donations via PayPal or crypto.
Bitcoin PatienceThis indicator shows how long every Bitcoin buyer ever had to wait to be in profit. Best to use this on the daily chart. At the time of publishing this indicator (May 2019), 1250 days of patience means gains for every BTC buyer ever. Can also be used for other assets of course.
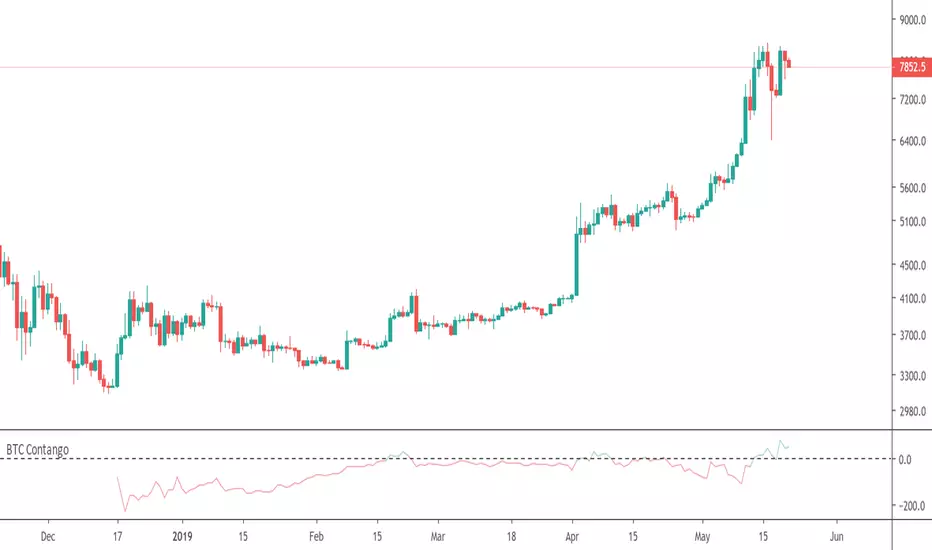
BTC Contango indicatorThis is a Bitcoin contango indicator, which tells you the difference in price between the price of the specified BTC futures contract and the current spot price. A viable strategy is to sell when "contango" occurs, which means the futures price is greater than the spot price (green line, above 0), and buy when it is below.
If you found this indicator useful, please feel free to tip so that I can continue making more free indicators!
BTC: 1JkcVwaPZfvpqxGio4iz2aENa2gj8oowxi
ETH: 0x71d509eeb9f86296c3f55bb7e882d9e69e393b2a
EOS: 0x71d509eeb9f86296c3f55bb7e882d9e69e393b2a
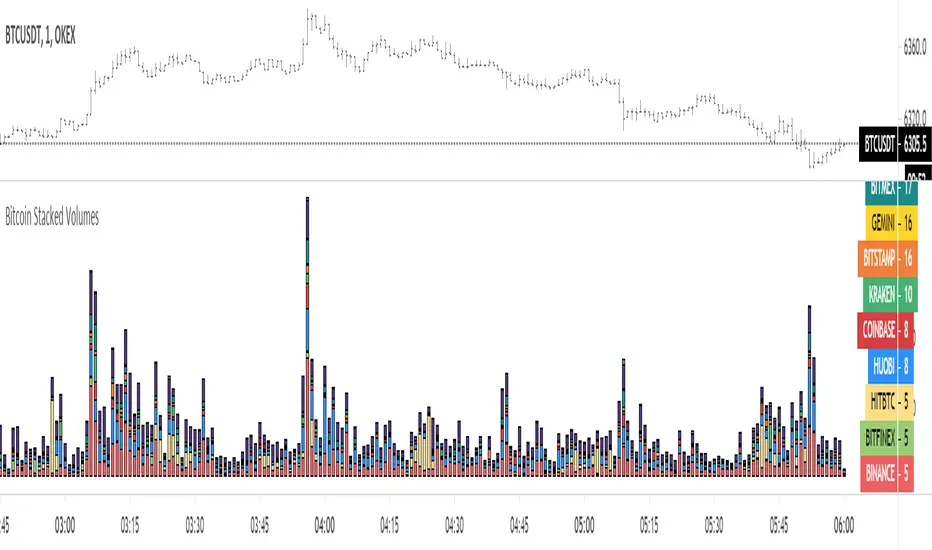
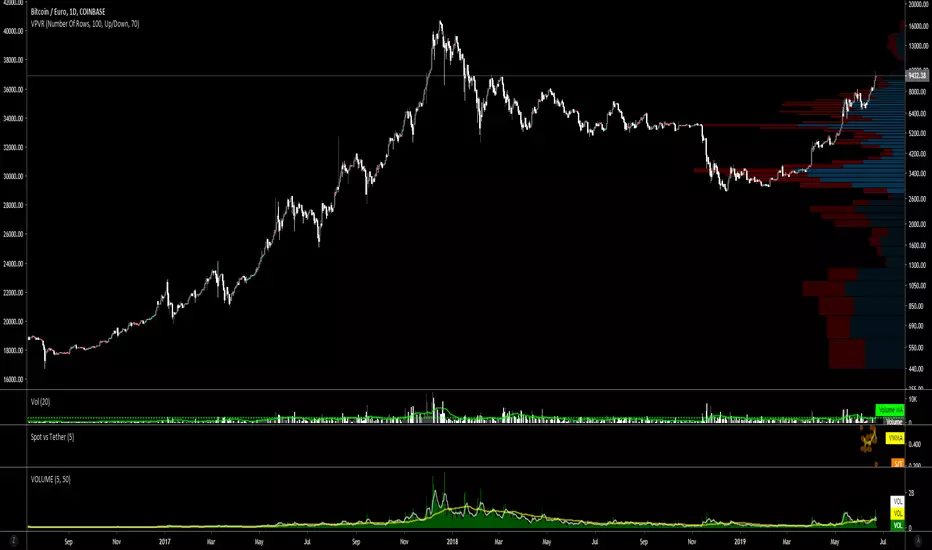
BTC Spot vs Tether Volumespot_volume / tether_volume
spot = Coinbase + bitFlyer + Kraken + Bitstamp
tether = Bitfinex + binance + Huobi + HitBTC

Crypto Indicators #u9tusA set of low timeframe (LTF), medium timeframe (MTF), and high timeframe (HTF) indicators for use in crypto currencies / bitcoin.
Traditionally the 10, 20, 50, 100, and 200 SMAs are used in TA. With cryptos, I've found that the 8 EMA, 21, 55, and 128 SMAs backtest better, while no change in length was necessary for the 200. I wanted to combine all these into one indicator to easily add them to a chart layout, hence this script.
You can customize the length of each MA to your liking in the settings, or accept the defaults.
LTF Indicators:
8 EMA in blue hues, medium line stroke.
MTF Indicators:
21, 55 SMA in purple hues, medium line stroke.
HTF Indicators:
128, 200 SMA in yellow hues, thick line stroke.
Defaults are for daily timeframes and lower; suggest changing up the intervals for weekly and monthly to:
21 -> 30
55 -> 50
128 -> 100
$BTC, $ETH, #ALTS
twitter.com
(c) @jhaurawachsman 20190515


BTC Average Volume (Multi Exchange)Multi-Exchange BTC Volume: Bitfinex, Bitmex, Bitstamp, Binance, and Coinbase are included for now.

Bitcoin Number of TransactionsThe Bitcoin Number of Transactions plots the amount of transactions registered on-chain on a daily basis.

Bitcoin On-Chain VolumeThe Bitcoin On-Chain Volume is a reflection of the transactional volume registered in the blockchain.
The indicator can show the value either in BTC or USD.

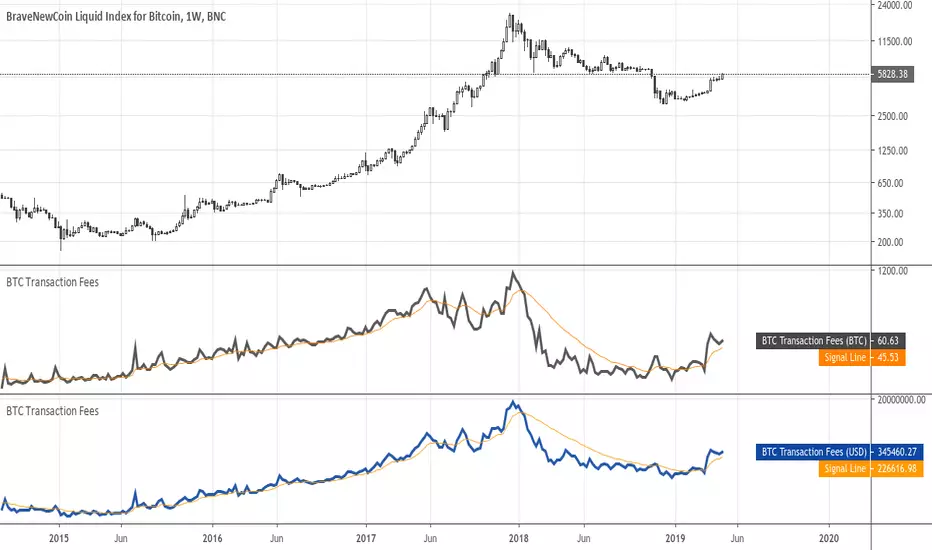
Bitcoin Transaction FeesThe Bitcoin Transaction Fees is the fee value that miners earn on a daily basis.
The indicator can show the value either in BTC or USD.
Bitcoin Cost of Transaction (%)The Bitcoin Relative Cost of Transaction shows the miners' revenue as a percentage of the transaction volume registered in the block.
