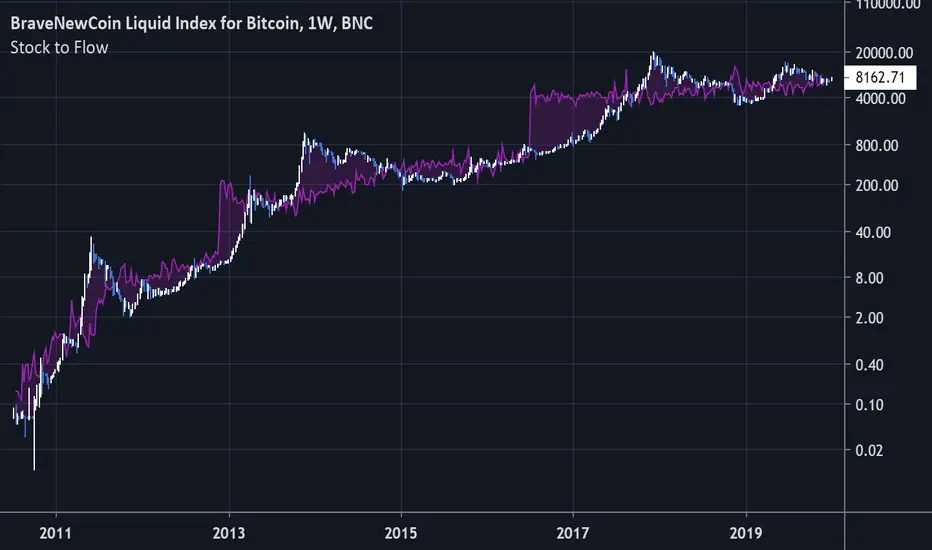
Bitcoin Stock to FlowModeling Bitcoin's Value With Scarcity
The Stock to Flow model for Bitcoin suggests that Bitcoin price is driven by scarcity over time.
Bitcoin is the first scarce digital object the world has ever seen. It is scarce like silver & gold, and can be sent over the internet, radio, satellite etc. Bitcoin includes a mathematical mechanism to restrict its supply over time making it more rare as time goes on. Digital Scarcity.
In 2017 BTC exceeded the market capitalization of Silver. After the next halving in 2024, Bitcoin will become the hardest asset the world has ever seen, rarer than Gold.
There is only enough Bitcoin in the world for each person to own .0023 BTC. Because of this, Bitcoin's value should continue to rise over time.
Btc-e
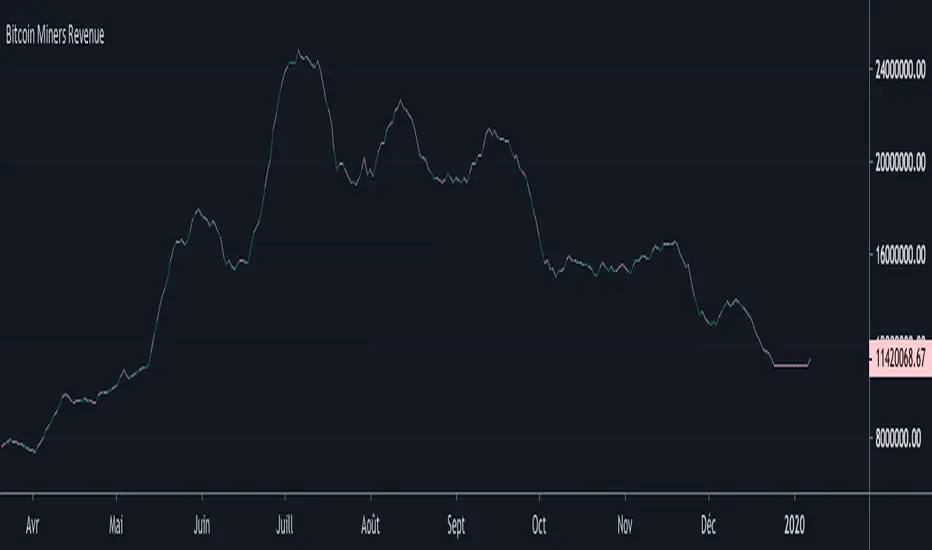
Bitcoin Miners RevenueHello everyone,
Bitcoin Miners Revenue Indicator :
Historical data showing (number of bitcoins mined per day + transaction fees) * market price.
Total value of coinbase block rewards and transaction fees paid to miner
Bitcoin Cost Per TransactionHello,
An indicator for Bitcoin, to have the cost per transaction, on a 10 days average.

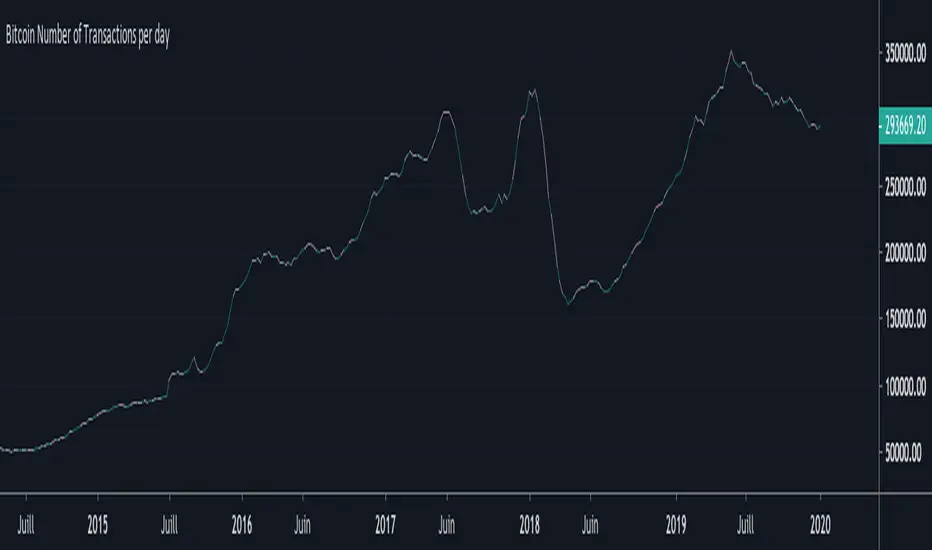
Bitcoin Number of Transactions per dayHello everyone,
Again an indicator for Bitcoin : the Number of Transactions / day.
Total number of unique bitcoin transactions per day
Precision : 10 DAYS AVERAGE
Bitcoin DifficultyHello everyone,
An other indicator for bitcoin : the difficulty
What is difficulty?
Difficulty is a measure of how difficult it is to find a hash below a given target.
The Bitcoin network has a global block difficulty. Valid blocks must have a hash below this target.
Mining pools also have a pool-specific share difficulty setting a lower limit for shares.

Bitcoin Hash RateHello everyone,
An interesting indicator for Bitcoin : the hash rate.
What is the Hash Rate ?
The estimated number of tera hashes per second (trillions of hashes per second) the Bitcoin network is performing.

BTC-Trend
BTC-Trend
BTC-Trend is a technique that shows how much BTC is dominating the market and it's effect over the whole Crypto Market.
*** Features
* Color grading to show you the Increase of domination effect (Green).
* Color grading to show you the Decrease of domination effect (Red) .
* Better understanding to the market ,and that will help you with a very good timed trades at the best trading times .
/////////////////////////////////////////////
*Note
Special thanks for Lazybear for his momentum algorithm .

GMA BTC1D-BYBIT-SignalA specialised Moving Average Cross Strategy script
This script allows you to set up your own alerts for automated trading. Make sure to only trigger alerts on candle close
After having spent hours on backtesting various settings for the classic MA cross strategy, I have identified a highly efficient combination for the slow and fast MA length.
This particular indicator is is tailored to trade Bitcoin 1D on Bybit and I've simplified it by removing the option to change MA lengths.
As a reminder, the MA cross strategy produces the following signals:
- BUY when the Fast MA is crossing above the Slow MA
- SELL when the Fast MA is crossing below the Slow MA

BTC Transaction/On-Chain Volume (Basic)Description:
Whale: Whale utilizing discounted prices (increasing on-chain volume & decreasing price)
Recovering: Positive momentum in price after potential whale activity
Cycle Volume Support: The transaction volume support during a cycle
What’s the best time to invest?
After institutions make up their mind at low price levels.
How’s on-chain volume related to whales or institutional money?
On-chain volume is contributed not only by using BTC as payment methods, but more importantly by large custodians using the BTC chain to settle internal whale trades. When OTC volume is estimated 2-3 times of exchange volume, and when total on-chain volume is only a small fraction of the exchange volume, the OTC settlement plays a big factor in moving the on-chain volume around.
Why does the price drop further after spotting whale money?
Does new money equal higher true value? Yes.
Does new money equal higher price? No.
Whales could not only ladder in when they see the price on discount, but also push the price further down to accumulate at better price levels. However, either route chosen, it’s most likely for the price to rise to a higher level compared to the level when the whales enter. Whales are here to make money after all.

Exponential Least Squares Moving AverageModified LSMA (Least Squares Moving Average) to use exponential rates of growth instead of linear regression. Inputting a number into the confidence interval allows the user to have set percentage of statistical guarantee based on past movement. To set this percentage of guarantee (Default set to 97.5%), refer to the input values below:
0.000 = 50%
0.255 = 60%
0.525 = 70%
0.835 = 80%
1.040 = 85%
1.285 = 90%
1.645 = 95%
1.960 = 97.5%
2.330 = 99%

ANN BTC MTF CM Sling Shot SystemHi all, this script was created as a result of ANN training in all time frames of bitcoin data.
Trained data is built on Chris Moody's Sling Shot system.
CM Sling Shot System :
This system automatically generates the ANN output for all time periods.
Therefore, it has multi-time-frame feature.
Artificial Neural Networks training details:
Average Errors
1 minute = 0.005570
3 minutes = 0.006674
5 minutes = 0.007067
15 minutes = 0.010000
30 minutes = 0.009398
45 minutes = 0.010000
1 Hour = 0.006848
2 Hours = 0.006901
3 Hours = 0.009608
4 Hours = 0.009774
1 Day = 0.010000
1 Week = 0.010000
The results look good (All Average Error <= 0.01 ), the Sling Shot Method is also good, but you can also refer to historically slower period averages to filter these arrows a bit more. I leave the decision to you.
Best regards.

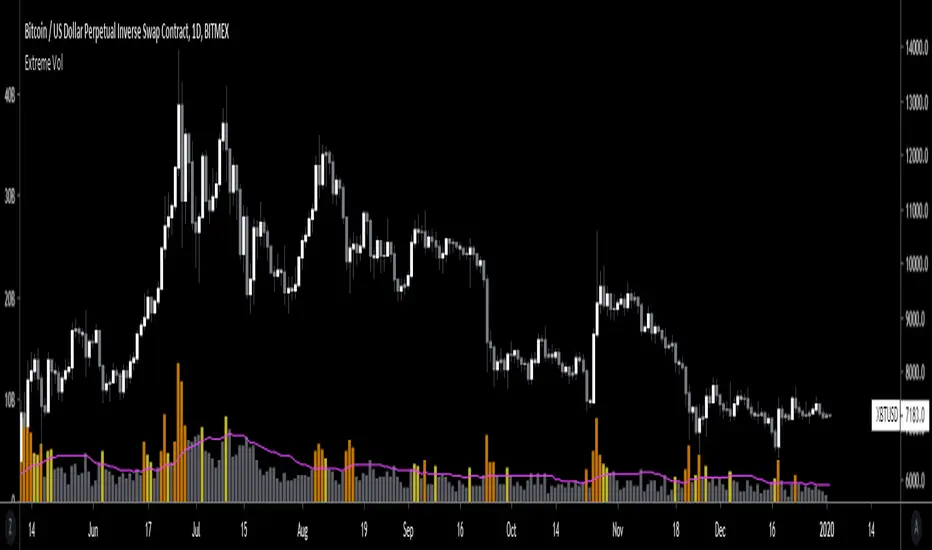
Extreme VolumeThis indicator colors volume bars that are significantly higher volume than the vol moving average ( SMA ). Utilizes two multiplier that can be adjusted by user. Defaults are that the indicator colors volume bars yellow if 20% higher than average, and orange if over 50% higher than average.
Reason why i created this indicator is i typically don't care about volume unless it is significantly higher than average. I find extreme volume useful for confirmation of a breakout, etc. This is why the rest of the volume bars are gray, they are still available for reference, but I dont pay much attention until volume is higher than average.
Also, when you load this indicator it will be in its own pane below the chart. To try and figure out how to add it to same pane as the chart was a huge pain in the ass. Once you figure it out it is pretty easy. I'll try to explain below...
Next to the indicator name you have the following options ... Hide, Settings, Show Source Code{}, Delete(X), and More (3 dots)
1) Click on "More" (3 dots)
2) Click on "Move To" then chose "Existing Pane Above"
3) Volume will likely be too large. Volume scale should be on left side, use your mouse to adjust volume smaller
4) Volume will likely be in the middle of your chart, click on it and drag it down.
Deribit Contango Calculator v3Same as XBT Contango Calc V3, however built specifically for Deribit Futures . See link to XBT Contango Calc V3 for full description.
Above is capture of how this indicator performed on December Futures Contract BTC27Z19, since I assume I will loose this as the main chart when I update to June contract
Current (Dec. 2019) futures contracts are as follows:
Blue = BTC26M20
Orange = BTC27H20

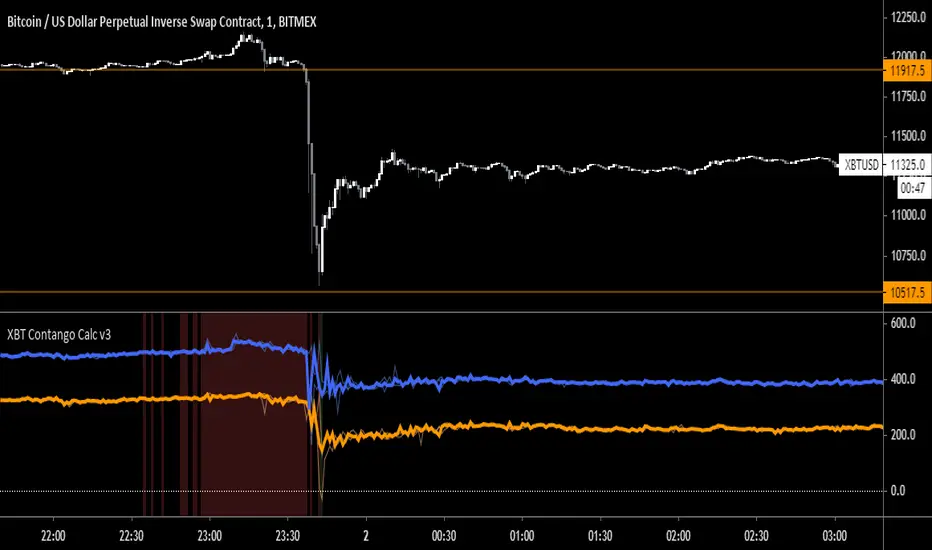
XBT Contango Calculator v3Since creating the first version of the XBT Contango Calculator, I found that the first version is good a calculating contango and backwardation in real time, however does not do a good job of capturing historical data of brief moves. Since backwardation moves are often brief, and since the first version Contango Calc was based on candlestick closes, it did not do a good job of recording the move after it occurred.
It took me a couple versions to try and fix this an eventually settled on version 3 which I have been using on my own for the last few months. You can see in the comparison chart above it does a much better job of capturing backwardation moves and extreme contango. Below is a comparison of how it performed vs. Version 1 during December futures XBTZ19
In addition I have added high/low lines that can be used to understand the amount that futures premium/discount has moved in a specific time frame. For example, the big drop Bitcoin had on September 24th, XBTZ19 went from +$273 contango to -$247 backwardation = $520 move! This move was in addition to the spot price move which was almost -$1,700 from high to low and -$1,100 from open to close. See below:
The high/low lines can also be removed from the chart by unchecking a box in the input tab.
The last update is the ability to lock the spot price to be XBT (index) no matter what chart you pull up. This can be useful if evaluation XBT futures correlation to other bitcoin derivatives such as GBTC or CME futures. You can also disable this feature in the input tab, which will then just calculate based on the current chart you are viewing.
Current Contracts (December 2019)
Blue = XBTM20
Orange = XBTH20
Bitcoin Energy Value OscillatorBitcoin Energy Value as an oscillator against price.
Calculated as: (Bitcoin Price / Bitcoin Energy Value - 1) * 100


Bitcoin CoP - Overlay V1A good estimate of what it would cost in electricity to mine 1 whole bitcoin with your preferred mining equipment. The cost of production overlay allows to change a few ASIC related variables like hash rate, device wattage, and electrical cost by KW/h. Defaults are set for the Antminer S17 Pro, which hashes at 53 Th/s and consumes 2.1 KW at 7.5 cents a KW/h. The overlay also considers halvings and plots CoP in those events.
This overlay can include other business related costs via "Other Costs" as a percentage of electrical cost USD/KW.h. Keep that value to 0 if you don't want to include it in your overlay.
The bubbles in the chart example is when mining devices came online. Pretty interesting to see difficulty adjust as new hashrate is added to the network.

Bitcoin Production Cost OscillatorFor Trav,
Oscillator version of "Bitcoin Production Cost".
Based on raw data from CBECI.
Follow me to read more about the calculation logic.

Bitcoin Production CostBitcoin's Production Cost
Based on raw data from CBECI.
Follow me to read more about the calculation logic.

BTC Mining Cost - IndicatorBTC Mining Cost Indicator
- Adjust the Emission Rate after each halving, currently it's 12.5
- Current settings are for the Antminer S17 with an average cost of 12 cents per kWh
As you can see, a bounce usually follows when the price hits the cost of mining 1 BTC .
I would love to hear your feedback, and if you like it please gimme a thumbs up ❤️
Happy Trading!

ZoneBand (@Mido_yuiya)Bollinger band is converted to EMA , and support and resistance bands are made into regions

BEST Mayer MultipleHello traders
I'm not a HODLer by any means. I know when to sell (or I think I know....) when an asset starts going against me too much.
Even if it's a "long-term" investment.
My mentor used to telling me this: "If a short-term trade becomes a long-term investment, then you're in for a hell of a ride".
I have no clue if Bitcoin/BTC will go back up or not - I don't even care because I'm an intraday trader.
What if BTC was actually a way to accumulate more fiat? Satoshi fooled us
I coded this Mayer Multiple according to the specifications below. By the way, I'm a big fan of Willy Woo. I've been monitoring all his work since I learned about crypto (10 minutes ago.... it's a joke come on)
charts.woobull.com
Scaling
To respect the Mayer's multiple model, I recommend to select the Logarithmic scaling as shown below
imgur.com
What Mayer's model says
Using the reference below, the model says we're in the oversold zone. But, we can be in that zone for months/years...
When a model says an asset could bounce in a 1000-7000 USD range... well... I don't know how I would be able to perform optimally with that insight. This is very subjective and not a recommendation.
Mayer's Multiple model reference
All the BEST
Dave

Heiken Ashi Triangles at the Top and Bottom of ScreenHeiken Ashi Triangles at the Top and Bottom of Screen
The image below shows the comparison to actual Heiken Ashi candles
(Though changing from candles to Heiken Ashi tends to smooth the triangles a little)
