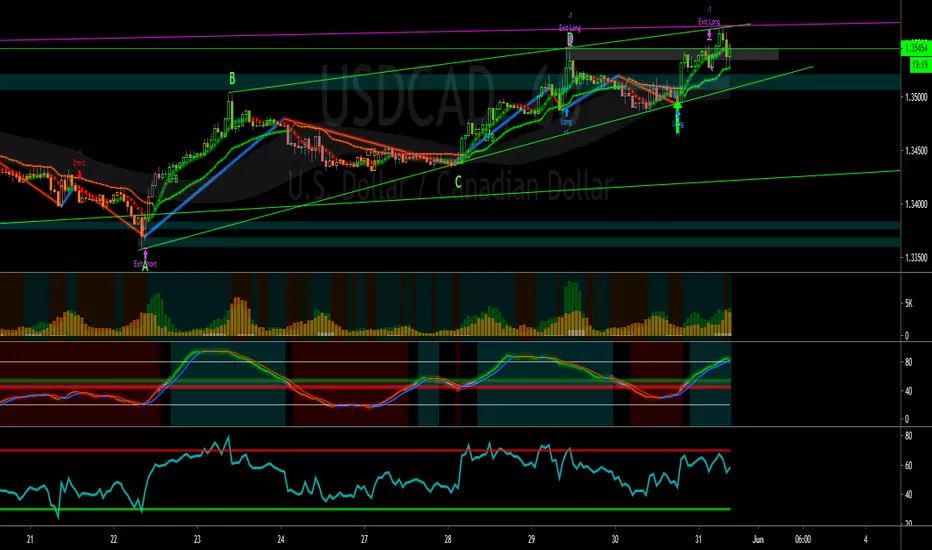
デイトレーダー・FXBTCのための「常時1時間足の100EMA(指数平滑移動平均線)を表示するインジケーター」デイトレーダーにとって、
とりわけFXBTCトレーダーにとって、
1時間の100EMA(指数平滑移動平均線)はとても大事なツールです。
なぜなら、ビットコインの相場では
1時間足の100EMAが必ずといっていいほど意識されているからです。
「だからどんな時間足を見ている時でも、この移動平均線だけは注視していたい!」
そんな方にオススメしたいEMAが、この 「『1時間100EMA』インジ」 です。
このインジケーターは、1分足から最大12時間足まで、
どの時間足を開いていても、常に1時間足の100EMAが表示されます。
つまり、
どの時間足に注目しようが、常に1時間足の100EMAを意識できるのです。
シンプルですが、
かゆいところに手が届くインジケーターなのです\(^o^)/
ぜひ、お気に入りインジケーターの1つとして使ってみてください。
それでは、また!
BTCUSD

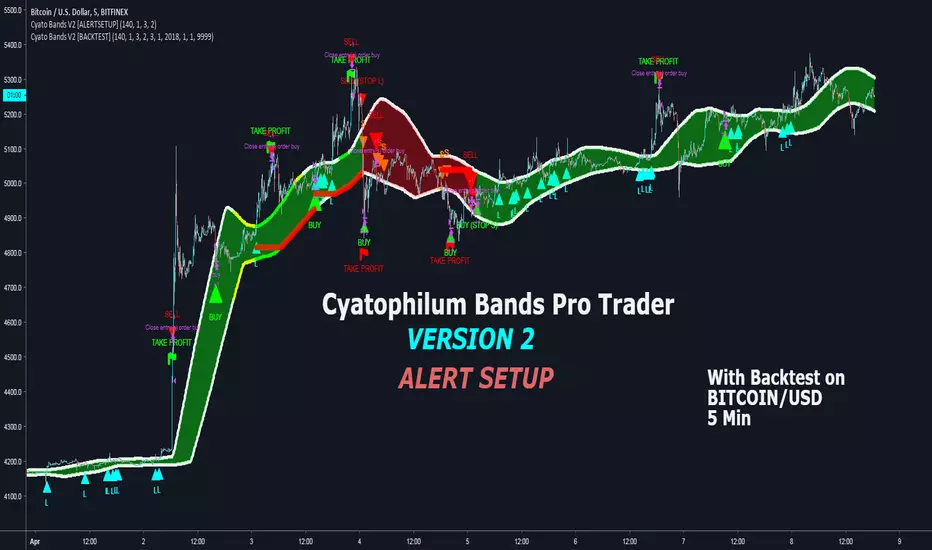
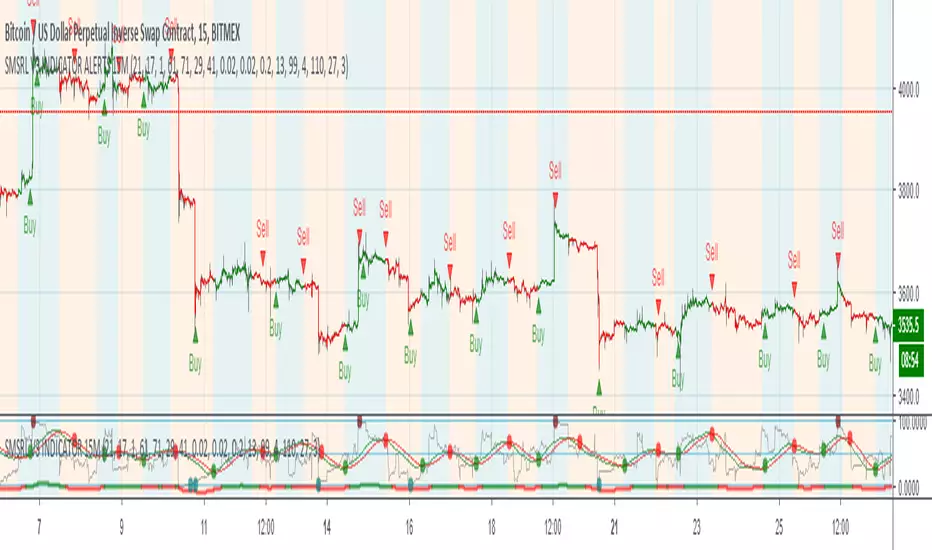
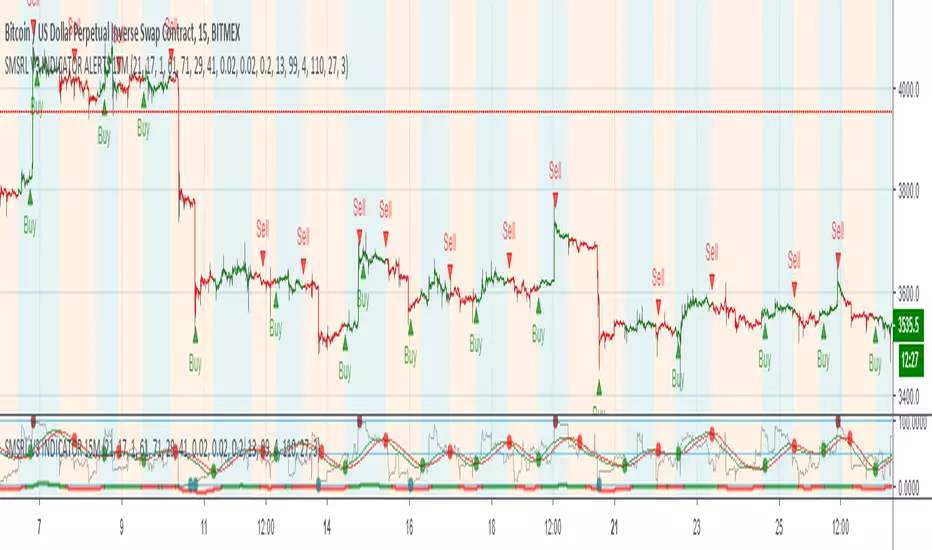
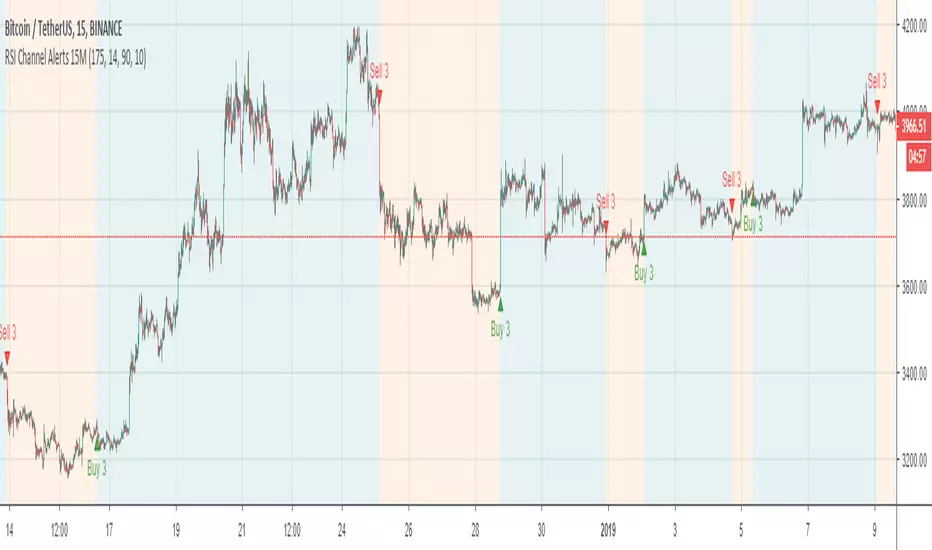
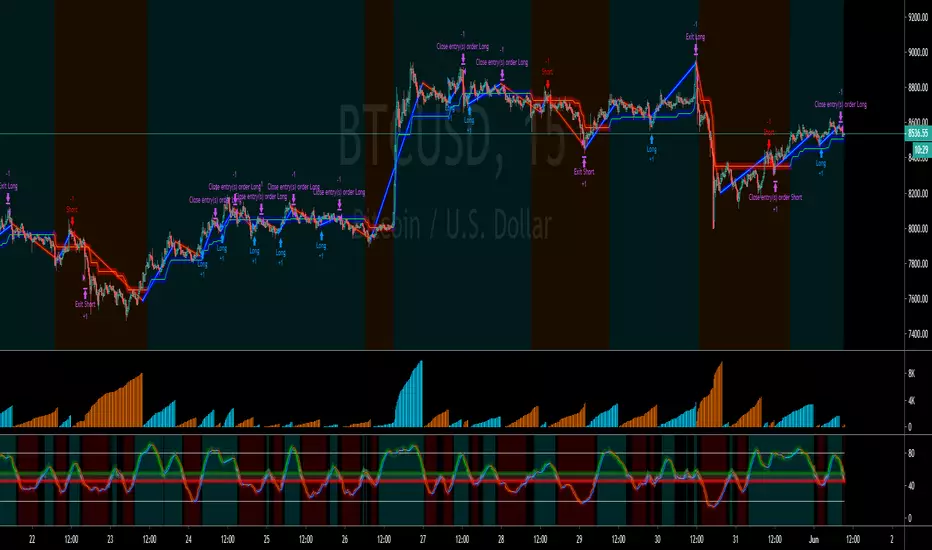
Cyatophilum Bands Pro Trader V2 [ALERTSETUP]An Original Automated Strategy that can be used for Manual or Bot Trading, on any timeframe and market.
Presentation page with video
How it works
The Cyatophilum Bands behave as either Trend Lines during a bear or bull market, or Support and Resistance during a Flat Market. Buy and Sell signals trigger upon Trend Reversal Breakouts.
Stop Loss System
An integrated Stop Loss System. Helps reducing risk by creating buy and sell signals when the price breaks through the red line.
Trailing Stop
Transform your Stop Loss into a Trailing Stop Loss. The red line will increase/decrease to secure profits.
Take Profit
Secure your profits using this new feature! When a flag appears, a buy/sell signal will trigger.
Re-Entries
A feature that can be helpful when using Take Profit or for manual trading in case you missed a trade.
Use it literally Anywhere
This indicator can be used on any timeframe and market (not only cryptocurrencies).
Backtest Below
Note: can be easily automated with Autoview
Get the indicator today!
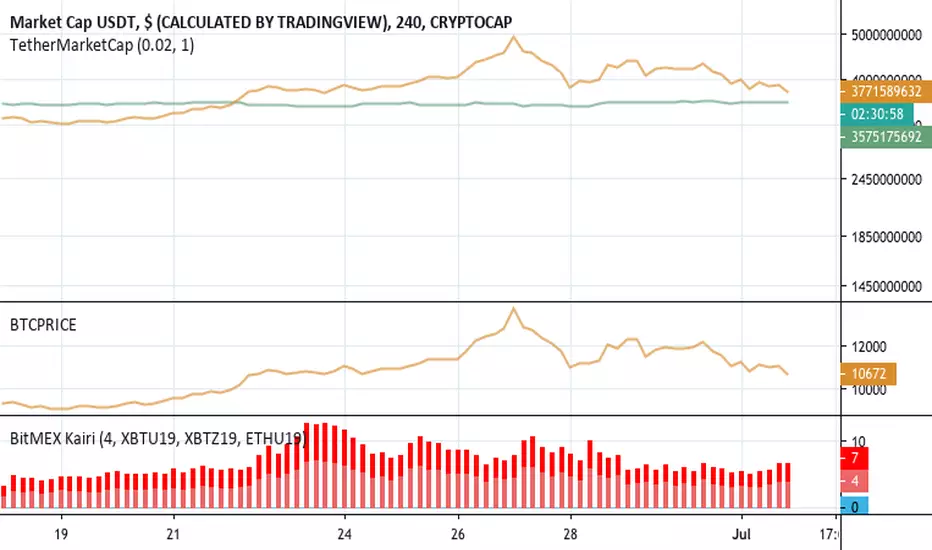
BitMEX KairiBitMEX Kairi
# Abstract
This script shows the divergence between BTC futures price and BTC actuals price of bitFlyer FX and BitMEX in percentage.
Usually, when people bought it or sold it too much on futures , the divergence between actuals and futures are getting expanding.
I believe this is really useful to find when the conversion of the trend happens.
Also supports USDT divergence too. If you wish to enable USDT mode, please check "Show only USDT divergence (Poloniex)" on the settings menu.
Enjoy :)
# Supports:
- BitMEX BTC Futures 3mo (orange)
- BitMEX BTC Futures 6mo (red)
- bitFlyer FX (blue)
- USDTUSD (Poloniex)
# Disclaimer:
This is a free script. Feedbacks are welcome! But I don't have any responsibility when this script has broken or something went wrong.
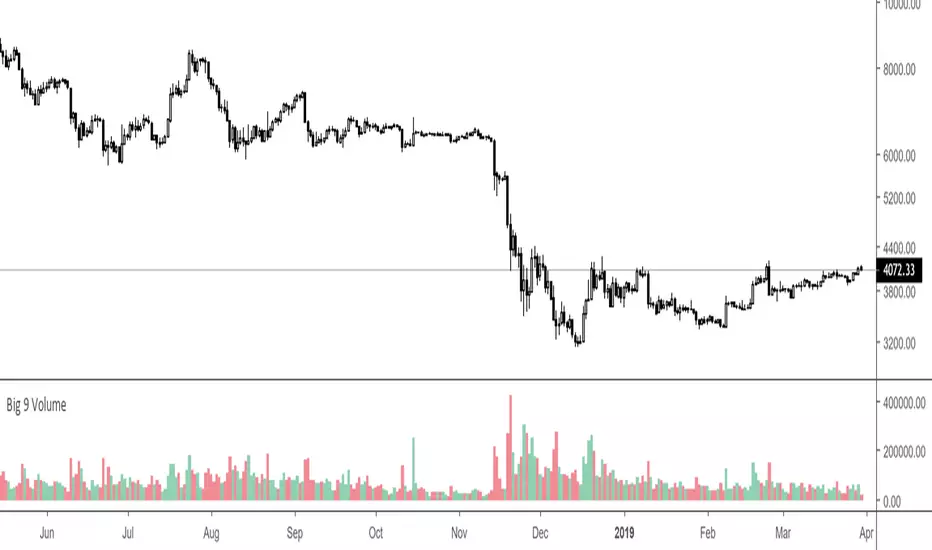
Big 9 Volume - Volume indicator from exchanges with real volumeHere is a very basic indicator combining the volumes of the 9 biggest exchanges trading BTC/USD or BTC/USDT. These 9 exchanges were chosen based on the report by Bitwise Invest stating that 95% of the volume on CoinMarketCap is fake. On these 9 exchanges, however, volume data appears to be reliable. Please note BitFlyer was not included because it does not trade in USD. Please note also that data on all 9 exchanges is only available from June 2018.
Anyone is welcome to modify this and make it more elegant, this was just a quick implementation.
Bitcoin Stacked VolumesThe idea was to keep Bitcoin trading volumes on the different exchanges under control using only one chart and only one indicator. It works on ANY timeframe.
Settings
Lookback for SMA of volume from each exchange (default: 21 )
Option to include or not volumes that traded in stablecoin pairs (default: true )
Customizable volume quotas for alerts
Alerts
It has 30 different alerts which can be divided into 4 types:
Total Quota Exceeded
Total Volume/SMA Crossover
Quota Exceeded
Volume/SMA Crossover
Here are some examples how it helps to be aware the situation on 1-minute resolution:

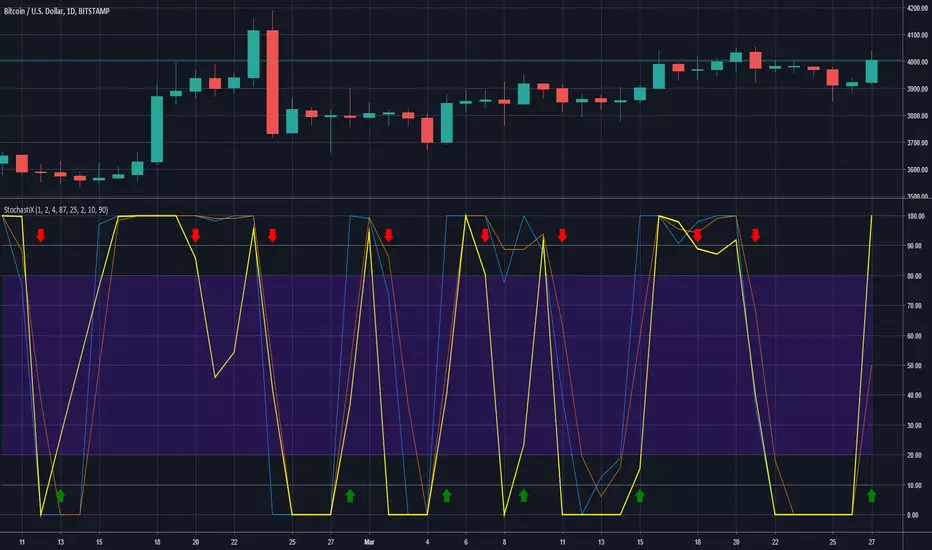
StochastiXThere ya go!!! You actually came to the best indicator there is out there. I hope you enjoy it. If you have any questions just hit me on the chat and i will answer you the best i can. Have a good one ;)
Bitwise Spot Volume Index (@BTC_JackSparrow) [v2019-03-23]Following Bitwise's research on the legitimacy of volume on spot exchanges, they reported 95% of the Bitcoin market volume is fake.
According to the report 10 exchanges showed trustworthy regulated spot volume. Having accurate reporting of volume is important and therefore I have made this indicator that combines all 23 pairs listed on the exchanges mentioned by Bitwise that are available on TradingView.
The volume listed in this indicator could be used as a reference for true volume and therefore is an important addition to your trading toolkit and should more or less represent the data found on this page, released by Bitwise: www.bitcointradevolume.com
If you like this, give me a follow on TradingView and Twitter (@BTC_JackSparrow : twitter.com).
NOTE: as this indicator needs to pull a lot of data, it might take a moment to load!
How To Read?!
Volume is printed as the sum of all Bitcoins traded on the listed exchanges.
Trade safely!

SMA Serial for Crypto Day Trade Fixed Length SSCDTENCrypto market is different from other financial markets
This indicator plot SMA series that fits Crypto, esp BTCUSD, XBTUSD
Good for 5m - 1H time period for Day Trading.
Specific SMA can be toggle on/off
---------- Française ----------
Le marché de la crypto-monnaie est différent des autres marchés financiers
Cet indicateur série SMA qui correspond à Crypto-monnaie, en particulier BTCUSD, XBTUSD
Bon pour 5m - 1H période pour le day trading.
SMA spécifique peut être activé / désactivé
---------- 中文 ----------
加密货币市场与其他金融市场不同
该指标绘制了适合加密货币的SMA系列,特别是BTCUSD,XBTUSD
适合5分钟 - 1小时 日间交易时间段。
特定SMA可以打开/关闭
----------日本語----------
暗号通貨市場は他の金融市場とは異なります
この指標は、暗号通貨、特にBTCUSD、XBTUSD用のSMAシリーズを描画します。
5分から1時間の取引期間に適しています。
特定のSMAをオン/オフにすることができます
---------- Disclaim ----------
Before using this indicator, you acknowledge that you have read and accepted that this indicator is for research purpose only and it does NOT provide any investment nor trading signal.
Users should make their own decisions, carefully assess risks and be responsible for their own investment and trading activities.

Delta longs-shorts. BITFINEX:BTCUSDFor any timeframe. Use for the BTC/USD pair. It is calculated by the formula: longs - shorts. Used data from Bitfinex. To smooth the values, you can use the EMA embedded in the indicator.


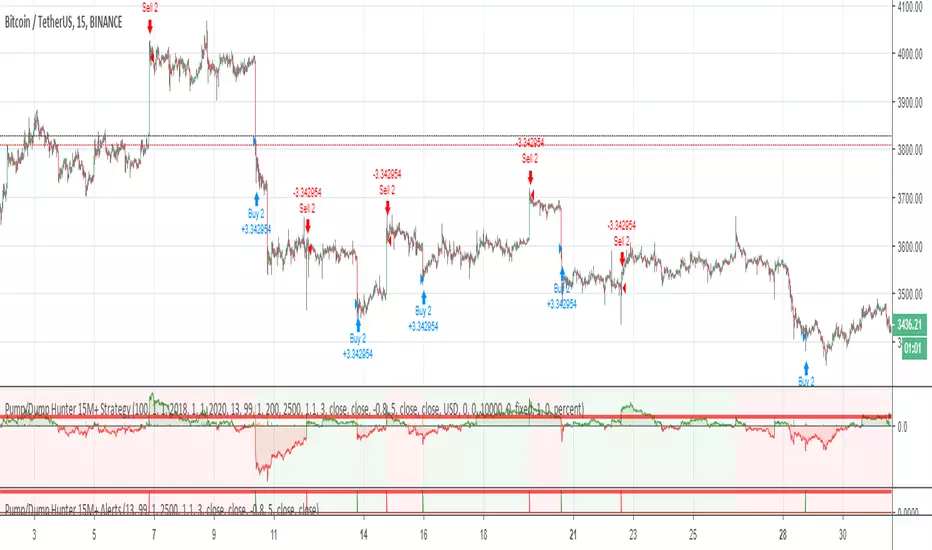
Pump/Dump Hunter 15M+ Alerts//The Alerts is based on the pumps and dumps strategy, as well as a sudden change in market volumes
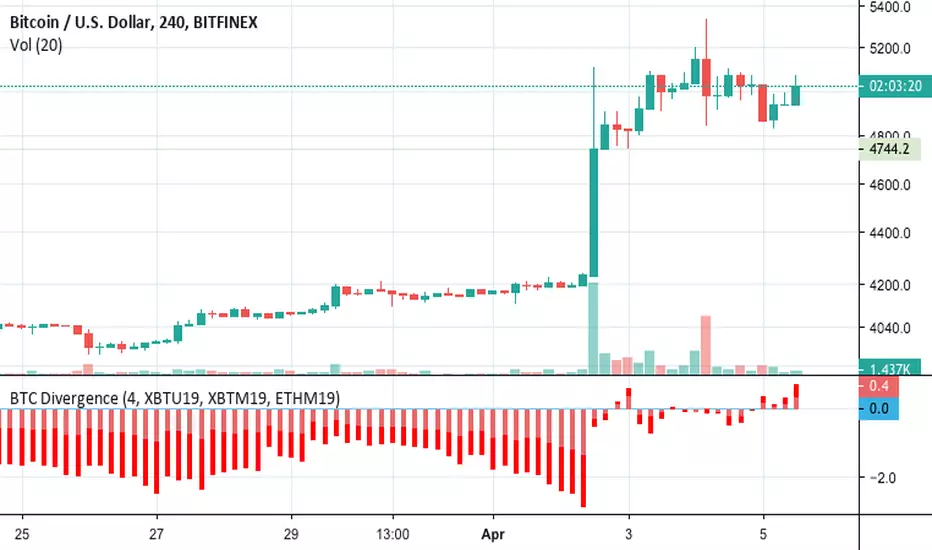
BTC Futures Divergence Monitor 1.0BITFINEX:BTCUSD
BTC Futures Divergence Monitor 1.0
=======
# Abstract
This script shows the divergence between BTC futures price and BTC actuals price of bitFlyer FX and BitMEX in percentage .
Usually, when people bought it or sold it too much on futures, the divergence between actuals and futures are getting expanding.
I believe this is really useful to find when the conversion of the trend happens.
Also supports ETH and USDT divergence too. If you wish to enable USDT mode, please check "Show only USDT divergence (Poloniex)" on the settings menu.
Enjoy :)
# Supports:
- bitFlyer FX (blue)
- BitMEX BTC Futures 3mo (orange)
- BitMEX BTC Futures 6mo (red)
- BitMEX ETH Futures (purple)
- USDTUSD (Poloniex)
# Disclaimer:
This is a free script. Feedbacks are welcome! But I don't have any responsibility when this script has broken or something went wrong.
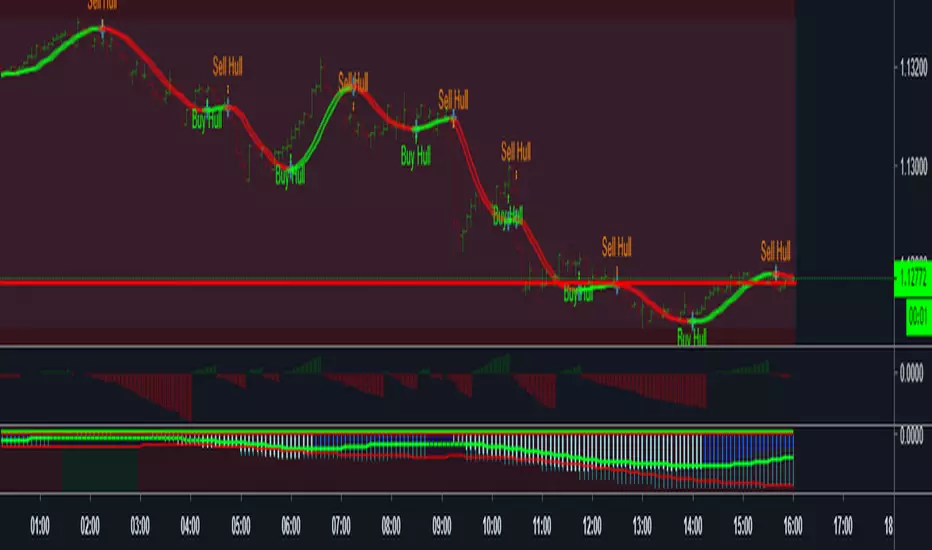
PpSignal Super Trend Smooth Trend Trader StrategySuper trend scalp system, buy when the bar is green and sell when the candle is red.
you can use in all time frame

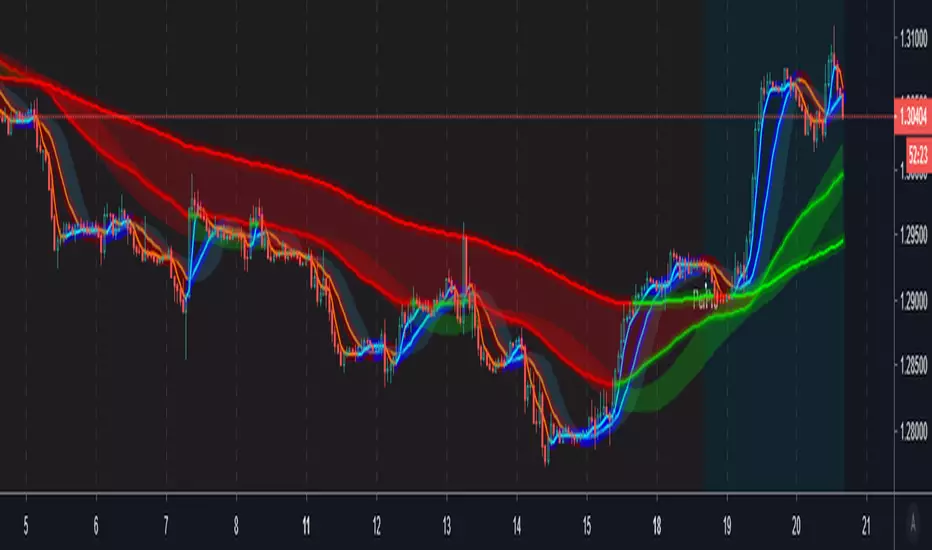
PpSignal SuperTrendPpSignal supertrend channel is calculated with eldher super smooth system.
we added PpSignal CFB move average
PpSignal Golden Cross V2In this version added CFB and move out Vidya, cfd is more and quickly for anticipate the change trend.
BTCUSDSHORT - BTCUSDLONG : balance of powerHello everyone,
I noticed that many people try to compare SHORTS and LONG positions (see: BTCUSDSHORTS and BTCUSDLONGS ), and the available indicators don't sufficiently highlight the balance of power .
That's why I programmed this indicator to answer this need ( which I also have ! ).
His name is : BTCUSDSHORT - BTCUSDLONG crossover indicator
I think you will understand quickly how it works, it's easy :
- If the histogram is negative, the color is red and that means that there are more BTCUSDSHORTs than BTCUSDLONG
- If the histogram is positive, the color is green and that means that there are more BTCUSDLONDS than BTCUSDSHORTS
A small cross (red or green) appears when the power balance is reversed.
Have a good day.
EDIT 03/02 : Title has been changed

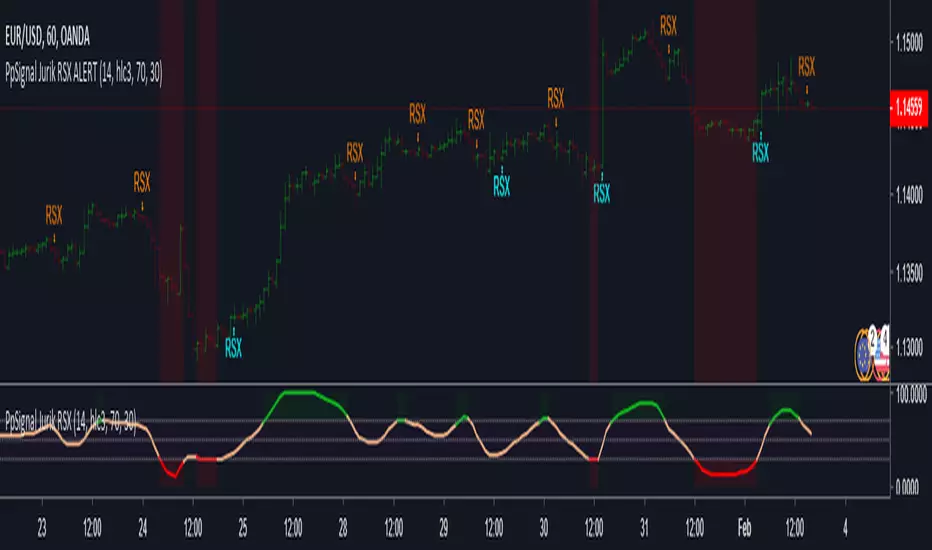
PpSignal Jurik RSXJurik RSX
Mark Jurik is a brilliant engineer and has done amazing work creating smooth, minimum lag indicators. I’ve bought a lot of his indicators and in fact I have used the Jurik Moving Average (JMA) to pre-process (smooth) data for the Better Sine Wave indicator. You can check out his website here.
emini-watch.com
www.jurikres.com