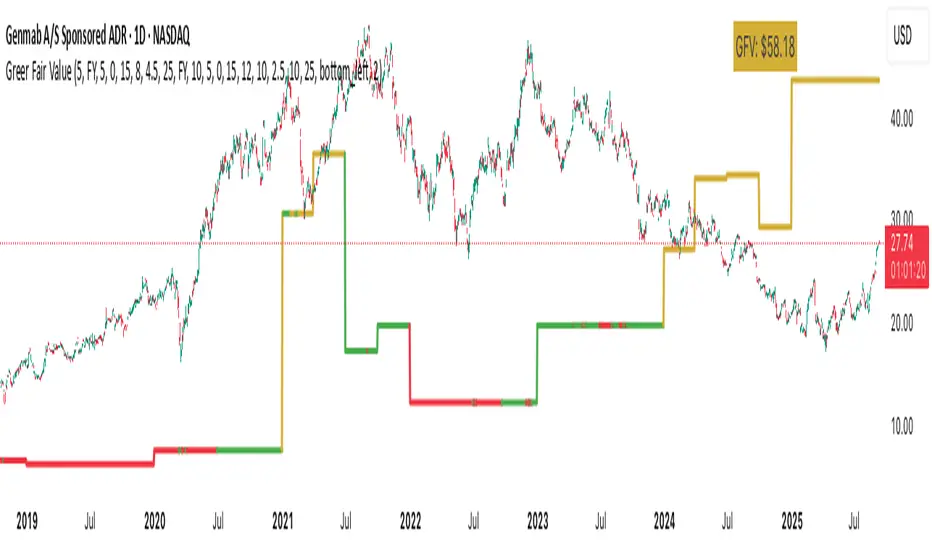
Greer Fair Value✅ Greer Fair Value
Greer Fair Value: Graham intrinsic value + Buffett-style DCF with auto EPS/FCF and auto growth (CAGR of FCF/share), defaulting to a simple GFV badge that color-codes opportunity at a glance.
📜 Full description
Greer Fair Value is inspired by the valuation frameworks of Benjamin Graham and Warren Buffett. It combines Graham’s rate-adjusted intrinsic value with a two-stage, per-share DCF. The script auto-populates EPS (TTM) and Free Cash Flow per share (FY/FQ/TTM) from request.financial(), and can auto-estimate the near-term growth rate (g₁) using the CAGR of FCF/share over a user-selected lookback (with sensible caps). All assumptions remain editable.
Default view: only the GFV badge is shown to keep charts clean.
Badge color logic:
Gold — both DCF and Graham fair values are above the current price
Green — exactly one of them is above the current price
Red — the current price is above both values
Show more detail (optional):
Toggle “Show Graham Lines” and/or “Show DCF Lines” to plot fair values (and optional MoS bands) over time.
Toggle “Show Dashboard” for a compact data table of assumptions and outputs.
Optional summary label can be enabled for a quick on-chart readout.
Inputs you can customize: EPS source/manual fallback, FCF/share source (FY/FQ/TTM), g₁ auto-CAGR lookback & caps, terminal growth gT, discount rate r, MoS levels, step-style plots, table position, and decimals.
Note: TradingView’s UI controls whether “Inputs/Values in Status Line” are shown. If you prefer a clean status line, open the indicator’s settings and uncheck those options, then Save as default.
Disclaimer: For educational/informational purposes only; not financial advice. Markets involve risk—do your own research.
Buffett
Economic Profit (Fixed & Labeled) — Rated + PeersFRAC (Fundamental-Rated-Asset-Calculate)
FRAC is a fundamentals-driven tool designed to measure whether a company is creating or destroying shareholder value. Unlike surface ratios, FRAC uses Economic Profit (ROIC – WACC) as its engine, showing whether a business truly outperforms its cost of capital.
🔹 What FRAC Does
Calculates ROIC (Return on Invested Capital) vs. WACC (Weighted Average Cost of Capital).
Shows whether a company is creating or destroying shareholder value.
Uses tiered color coding for clarity:
🔵 Superior (Aqua Blue) → Top tier; best of the best.
🟣 Elite (Purple) → Strong value creation.
🟢 Positive (Green) → Solid, creating shareholder value.
🟡 Marginal (Yellow) → Barely covering cost of capital.
🔴 Negative (Red) → Value destruction.
🔹 Composite Ranking System (1–4)
FRAC also assigns each company a Composite Rank so you can compare multiple names side by side. The rank works like this:
Rank 1 → Superior (🔵 Aqua Blue)
Best possible rating; wide gap between ROIC and WACC.
Rank 2 → Elite (🟣 Purple)
Strongly positive; above-average capital efficiency.
Rank 3 → Positive (🟢 Green)
Creating value but only moderately; not a top compounder.
Rank 4 → Marginal/Negative (🟡/🔴)
Weak or destructive; either barely covering WACC or losing money on capital.
✅ How to Use the Ranks
When comparing a set of peers (e.g., NVDA, AMD, INTC):
FRAC will display each company’s color rating + composite rank (1–4).
You can instantly see who is strongest vs. weakest in the group.
Best decisions = overweight Rank 1 & 2 companies, avoid Rank 4 names.
🔹 Key Inputs Explained
Risk-Free Asset → Typically the 10-Year US Treasury yield (US10Y).
Corporate Tax Rate → Effective tax rate for the company’s country (e.g., USCTR).
Expected Market Return → Historical average ~8–10%, adjustable.
Beta Lookback Period → Controls how far back Beta is calculated (longer = more stable, shorter = more reactive).
👉 These must be set correctly for FRAC to calculate WACC accurately.
🔹 Example Comparison
NVDA: ROIC 25% – WACC 7% = +18% → 🔵 Superior → Rank 1
AMD: ROIC 17% – WACC 8% = +9% → 🟣 Elite → Rank 2
INTC: ROIC 11% – WACC 9% = +2% → 🟢 Positive → Rank 3
FSLY: ROIC 5% – WACC 10% = –5% → 🔴 Negative → Rank 4
🔹 Why It Matters
Buffett said: “The best businesses are those that can consistently generate returns on capital above their cost of capital.”
FRAC turns that into a visual + numeric rating system (1–4), making comparisons across peers simple and actionable.
🔹 Credit
FRAC was created by Hunter Hammond (Elite x FineFir), inspired by corporate finance models of Economic Profit and Economic Value Added (EVA).
⚠️ Disclaimer: FRAC is a research framework, not financial advice. Always pair with full due diligence.

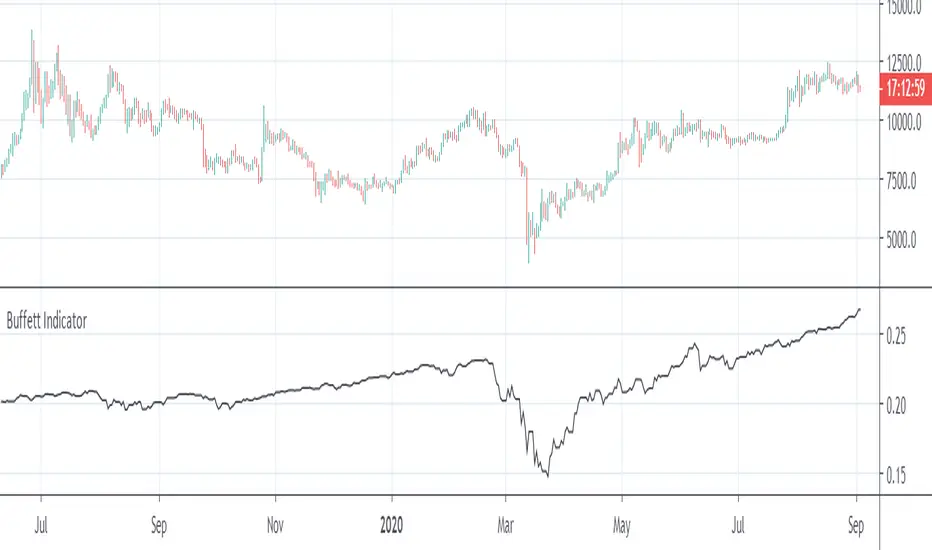
Buffett IndicatorThis is an open-source version of the Buffett indicator. The old version was code-protected and broken, so I created another version.
It's computed simply as the entire SPX 500 capitalization divided by the US GDP. Since TradingView does not have data for the SPX 500 capitalization, I used quarterly values of SPX devisors as a proxy.
I tried to create another version of the Buffett indicator for other countries/indexes, but I can't find the data. If you can help me find data for index divisors, I can add more choices to this indicator.
It's interesting to see how this indicator's behavior has changed in the last few years. Levels that looked crazy are not so crazy anymore.
Disclaimer
Please remember that past performance may not be indicative of future results.
Due to various factors, including changing market conditions, the strategy may no longer perform as well as in historical backtesting.
This post and the script don’t provide any financial advice.

Buffett Indicator: Wilshire 5000 to GDP Ratio [WhaleCrew]Our Implementation of the famous Buffett Indicator a long-term valuation indicator for stocks.
Calculation: Wilshire 5000 Index divided by US GDP (Gross Domestic Product)

Buffett Indicator [Bitcoin Machine]This is the Warren Buffett Indicator, the total market cap relative to the US gross domestic product (GDP). It is also called "Market Cap to GDP Indicator". For the market cap typically the Wilshire 5000 total market cap is used, which is representing the value of all stocks traded in the United States. Tradingview just provides the Wilshire W4500. We can calculate the W5000 by adding the S&P500 to the W4500.
Market Cap to GDP is a long-term valuation indicator and as pointed by Warren Buffett, the indicator is “probably the best single measure of where valuations stand at any given moment.” It used as a broad way of assessing whether the country’s stock market is overvalued or undervalued, compared to a historical average.
Remark: The Wilshire W4500 and the S&P500 are indices and denoted in "index points" (not USD). The Original Buffett Indicator is using market cap in US-Dollar. So the right scale of the indicator is different to the original one.
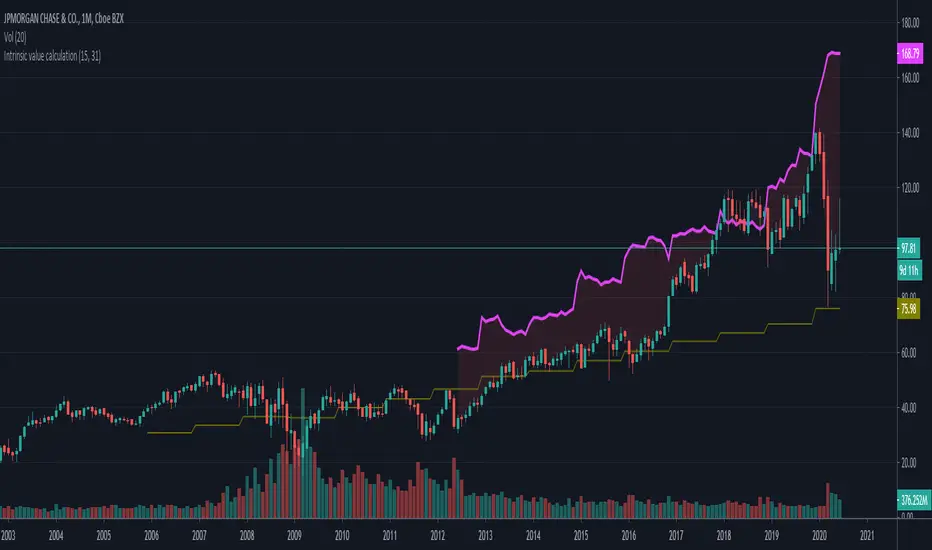
Intrinsic value calculation Intrinsic value calculator based on Warren Buffet's and Ben Graham's work
In value investing determing the true value of a COMPANY instead of a stock price is crucial.
This little indicator shows the "Intrinsic value" of the choosen stock meaning the value of the stock in 10 years time. Calculation is based on historical book value's average annual growth rate and dividends paid.
Since this is about long therm investing, use monthly charts.
"Intrinsic value can be defined simply: It is the discounted value of the cash that can be taken out of a business during its remaining life.”
– Warren Buffett
One way to calculate that is by the growth in per share book value and dividends taken in the forseeable future (10 years) than discount it with the prevailing 10 year note's rate.
In the inputs you have to set 2 variables:
1. How many years back you have the first data for book value per share available?
2. What was the per share book value that year?
(Bookvalue is ploted in olive colour and you can get the oldest one if you move your cursor over the latest data on the left)
CAUTION! You have to reenter it for every stock you analyse as this is stock-specific data!
After setting the input data, you will see the "Intrinsic Value"'s pink curve ploted over the price chart.
If the price is well below the pink line, the company is undervalued and can be a possible applicant for long therm investment.
Margin of safety: when the current price is 50% below the intrinsic value that means a 10% yearly growth potential (100% growth in 10 years) or a 100% margin of safety.
I am a beginer in Pine so please excuse my coding...
If anybody knows hot to extract historical data from 15 years ago, please share it with me, so I can automate the whole calculation without inputs necessary.