• 產品
  • 社群
  • 市場
  • 經紀商
  • 更多
立即開始
  • 社群
  • /指標和策略
  • /Bullcycle

Bullcycle

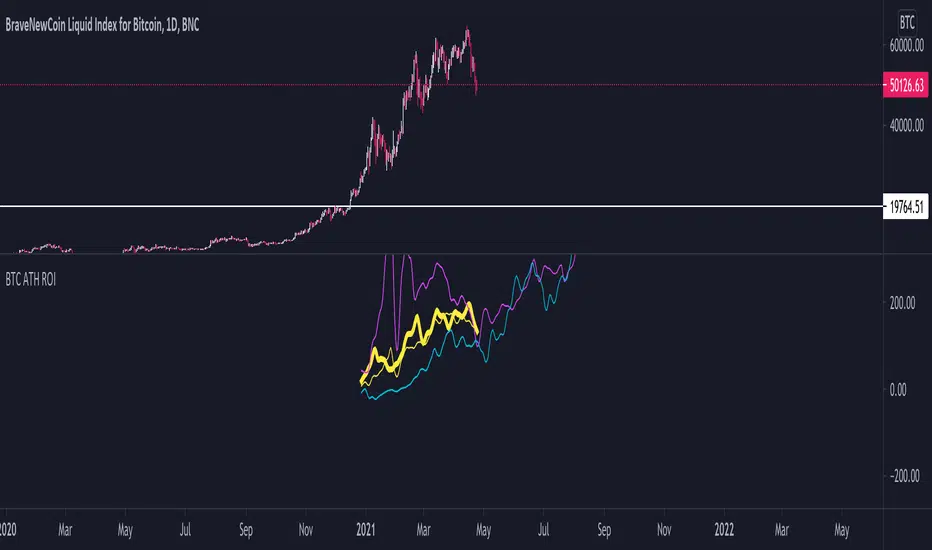
BTC ATH ROIThis indicator shows the ROI % of Bitcoin from when it passed its ATH of the previous bull cycle. I found it interesting that each time it crossed its ATH it took around 260-280 days to peak for each one. This bull run seems to follow between both of the previous bull runs including this recent dip. There are a couple issues I want to fix but can't figure out: 1. You need to completely scroll out and move towards 2013 on the Daily chart for all 3 lines to show up. Would be nice to load all of that data at the start. 2. I can't query the value of the plots after they have been offset. This would be useful to create a prediction bias for the current plot so would could see where btc might go. If you peeps know of a way to load all data or query plot values after offsets, please share. That would be awesome.
Pine Script®指標
由OrionAlgo提供
已更新
22

選擇由ICE Data提供的市場數據。選擇由FactSet提供的參考數據。版權所有©2025FactSet Research Systems Inc.©2025TradingView, Inc.

不僅是產品
  • 超級圖表
篩選器
  • 股票
  • ETF
  • 債券
  • 加密貨幣
  • CEX對
  • DEX對
  • Pine
熱圖
  • 股票
  • ETF
  • 加密貨幣
日曆
  • 經濟
  • 收益
  • 股息
更多產品
  • 殖利率曲線
  • 期權
  • 新聞流
  • Pine Script®
App
  • 行動裝置
  • 電腦版
社群
  • 社交網路
  • 愛心牆
  • 推薦朋友
  • 網站規則
  • 版主
投資想法
  • 交易
  • 教育
  • 編輯精選
Pine腳本
  • 指標與策略
  • 大師
  • 自由開發人員
工具與訂閱
  • 功能特色
  • 價格
  • 市場數據
交易
  • 概要
  • 經紀商
特別優惠
  • CME期貨
  • Eurex期貨
  • 美國股票包
關於公司
  • 我們是誰
  • 宣言
  • 運動員
  • 部落格
  • 職涯
  • 媒體工具包
商品
  • TradingView商店
  • 交易者塔羅牌
  • C63 TradeTime
政策與安全
  • 使用條款
  • 免責聲明
  • 隱私政策
  • Cookies政策
  • 無障礙聲明
  • 安全漏洞
  • 狀態頁面
企業解決方案
  • 小工具
  • 圖表庫
  • Lightweight Charts™
  • 高級圖表
  • 交易平台
成長機會
  • 廣告
  • 經紀商整合
  • 夥伴計畫
  • 教育計劃
社群
  • 社交網路
  • 愛心牆
  • 推薦朋友
  • 網站規則
  • 版主
投資想法
  • 交易
  • 教育
  • 編輯精選
Pine腳本
  • 指標與策略
  • 大師
  • 自由開發人員
企業解決方案
  • 小工具
  • 圖表庫
  • Lightweight Charts™
  • 高級圖表
  • 交易平台
成長機會
  • 廣告
  • 經紀商整合
  • 夥伴計畫
  • 教育計劃
Look FirstLook First