Enhanced KLSE Banker Flow Oscillator# Enhanced KLSE Banker Flow Oscillator
## Description
The Enhanced KLSE Banker Flow Oscillator is a sophisticated technical analysis tool designed specifically for the Malaysian stock market (KLSE). This indicator analyzes price and volume relationships to identify potential smart money movements, providing early signals for market reversals and continuation patterns.
The oscillator measures the buying and selling pressure in the market with a focus on detecting institutional activity. By combining money flow calculations with volume filters and price action analysis, it helps traders identify high-probability trading opportunities with reduced noise.
## Key Features
- Dual-Timeframe Analysis: Combines long-term money flow trends with short-term momentum shifts for more accurate signals
- Adaptive Volume Filtering: Automatically adjusts volume thresholds based on recent market conditions
- Advanced Divergence Detection: Identifies potential trend reversals through price-flow divergences
- Early Signal Detection: Provides anticipatory signals before major price movements occur
- Multiple Signal Types: Offers both early alerts and strong confirmation signals with clear visual markers
- Volatility Adjustment: Adapts sensitivity based on current market volatility for more reliable signals
- Comprehensive Visual Feedback: Color-coded oscillator, signal markers, and optional text labels
- Customizable Display Options: Toggle momentum histogram, early signals, and zone fills
- Organized Settings Interface: Logically grouped parameters for easier configuration
## Indicator Components
1. Main Oscillator Line: The primary banker flow line that fluctuates above and below zero
2. Early Signal Line: Secondary indicator showing potential emerging signals
3. Momentum Histogram: Visual representation of flow momentum changes
4. Zone Fills: Color-coded background highlighting positive and negative zones
5. Signal Markers: Visual indicators for entry and exit points
6. Reference Lines: Key levels for strong and early signals
7. Signal Labels: Optional text annotations for significant signals
## Signal Types
1. Strong Buy Signal (Green Arrow): Major bullish signal with high probability of success
2. Strong Sell Signal (Red Arrow): Major bearish signal with high probability of success
3. Early Buy Signal (Blue Circle): First indication of potential bullish trend
4. Early Sell Signal (Red Circle): First indication of potential bearish trend
5. Bullish Divergence (Yellow Triangle Up): Price making lower lows while flow makes higher lows
6. Bearish Divergence (Yellow Triangle Down): Price making higher highs while flow makes lower highs
## Parameters Explained
### Core Settings
- MFI Base Length (14): Primary calculation period for money flow index
- Short-term Flow Length (5): Calculation period for early signals
- KLSE Sensitivity (1.8): Multiplier for flow calculations, higher = more sensitive
- Smoothing Length (5): Smoothing period for the main oscillator line
### Volume Filter Settings
- Volume Filter % (65): Minimum volume threshold as percentage of average
- Use Adaptive Volume Filter (true): Dynamically adjusts volume thresholds
### Signal Levels
- Strong Signal Level (15): Threshold for strong buy/sell signals
- Early Signal Level (10): Threshold for early buy/sell signals
- Early Signal Threshold (0.75): Sensitivity factor for early signals
### Advanced Settings
- Divergence Lookback (34): Period for checking price-flow divergences
- Show Signal Labels (true): Toggle text labels for signals
### Visual Settings
- Show Momentum Histogram (true): Toggle the momentum histogram display
- Show Early Signal (true): Toggle the early signal line display
- Show Zone Fills (true): Toggle background color fills
## How to Use This Indicator
### Installation
1. Add the indicator to your TradingView chart
2. Default settings are optimized for KLSE stocks
3. Customize parameters if needed for specific stocks
### Basic Interpretation
- Oscillator Above Zero: Bullish bias, buying pressure dominates
- Oscillator Below Zero: Bearish bias, selling pressure dominates
- Crossing Zero Line: Potential shift in market sentiment
- Extreme Readings: Possible overbought/oversold conditions
### Advanced Interpretation
- Divergences: Early warning of trend exhaustion
- Signal Confluences: Multiple signal types appearing together increase reliability
- Volume Confirmation: Signals with higher volume are more significant
- Momentum Alignment: Histogram should confirm direction of main oscillator
### Trading Strategies
#### Trend Following Strategy
1. Identify market trend direction
2. Wait for pullbacks shown by oscillator moving against trend
3. Enter when oscillator reverses back in trend direction with a Strong signal
4. Place stop loss below/above recent swing low/high
5. Take profit at previous resistance/support levels
#### Counter-Trend Strategy
1. Look for oscillator reaching extreme levels
2. Identify divergence between price and oscillator
3. Wait for oscillator to cross Early signal threshold
4. Enter position against prevailing trend
5. Use tight stop loss (1 ATR from entry)
6. Take profit at first resistance/support level
#### Breakout Confirmation Strategy
1. Identify stock consolidating in a range
2. Wait for price to break out of range
3. Confirm breakout with oscillator crossing zero line in breakout direction
4. Enter position in breakout direction
5. Place stop loss below/above the breakout level
6. Trail stop as price advances
### Signal Hierarchy and Reliability
From highest to lowest reliability:
1. Strong Buy/Sell signals with divergence and high volume
2. Strong Buy/Sell signals with high volume
3. Divergence signals followed by Early signals
4. Strong Buy/Sell signals with normal volume
5. Early Buy/Sell signals with high volume
6. Early Buy/Sell signals with normal volume
## Complete Trading Plan Example
### KLSE Market Trading System
#### Pre-Trading Preparation
1. Review overall market sentiment (bullish, bearish, or neutral)
2. Scan for stocks showing significant banker flow signals
3. Note key support/resistance levels for watchlist stocks
4. Prioritize trade candidates based on signal strength and volume
#### Entry Rules for Long Positions
1. Banker Flow Oscillator above zero line (positive flow environment)
2. One or more of the following signals present:
- Strong Buy signal (green arrow)
- Bullish Divergence signal (yellow triangle up)
- Early Buy signal (blue circle) with confirming price action
3. Entry confirmation requirements:
- Volume above 65% of 20-day average
- Price above short-term moving average (e.g., 20 EMA)
- No immediate resistance within 3% of entry price
4. Entry on the next candle open after signal confirmation
#### Entry Rules for Short Positions
1. Banker Flow Oscillator below zero line (negative flow environment)
2. One or more of the following signals present:
- Strong Sell signal (red arrow)
- Bearish Divergence signal (yellow triangle down)
- Early Sell signal (red circle) with confirming price action
3. Entry confirmation requirements:
- Volume above 65% of 20-day average
- Price below short-term moving average (e.g., 20 EMA)
- No immediate support within 3% of entry price
4. Entry on the next candle open after signal confirmation
#### Position Sizing Rules
1. Base risk per trade: 1% of trading capital
2. Position size calculation: Capital × Risk% ÷ Stop Loss Distance
3. Position size adjustments:
- Increase by 20% for Strong signals with above-average volume
- Decrease by 20% for Early signals without confirming price action
- Standard size for all other valid signals
#### Stop Loss Placement
1. For Long Positions:
- Place stop below the most recent swing low
- Minimum distance: 1.5 × ATR(14)
- Maximum risk: 1% of trading capital
2. For Short Positions:
- Place stop above the most recent swing high
- Minimum distance: 1.5 × ATR(14)
- Maximum risk: 1% of trading capital
#### Take Profit Strategy
1. First Target (33% of position):
- 1.5:1 reward-to-risk ratio
- Move stop to breakeven after reaching first target
2. Second Target (33% of position):
- 2.5:1 reward-to-risk ratio
- Trail stop at previous day's low/high
3. Final Target (34% of position):
- 4:1 reward-to-risk ratio or
- Exit when opposing signal appears (e.g., Strong Sell for long positions)
#### Trade Management Rules
1. After reaching first target:
- Move stop to breakeven
- Consider adding to position if new confirming signal appears
2. After reaching second target:
- Trail stop using banker flow signals
- Exit remaining position when:
- Oscillator crosses zero line in opposite direction
- Opposing signal appears
- Price closes below/above trailing stop level
3. Maximum holding period:
- 20 trading days for trend-following trades
- 10 trading days for counter-trend trades
- Re-evaluate if targets not reached within timeframe
#### Risk Management Safeguards
1. Maximum open positions: 5 trades
2. Maximum sector exposure: 40% of trading capital
3. Maximum daily drawdown limit: 3% of trading capital
4. Mandatory stop trading rules:
- After three consecutive losing trades
- After reaching 5% account drawdown
- Resume after two-day cooling period and strategy review
#### Performance Tracking
1. Track for each trade:
- Signal type that triggered entry
- Oscillator reading at entry and exit
- Volume relative to average
- Price action confirmation patterns
- Holding period
- Reward-to-risk achieved
2. Review performance metrics weekly:
- Win rate by signal type
- Average reward-to-risk ratio
- Profit factor
- Maximum drawdown
3. Adjust strategy parameters based on performance:
- Increase position size for highest performing signals
- Decrease or eliminate trades based on underperforming signals
## Advanced Usage Tips
1. Combine with Support/Resistance:
- Signals are more reliable when they occur at key support/resistance levels
- Look for banker flow divergence at major price levels
2. Multiple Timeframe Analysis:
- Use the oscillator on both daily and weekly timeframes
- Stronger signals when both timeframes align
- Enter on shorter timeframe when confirmed by longer timeframe
3. Sector Rotation Strategy:
- Compare banker flow across different sectors
- Rotate capital to sectors showing strongest positive flow
- Avoid sectors with persistent negative flow
4. Volatility Adjustments:
- During high volatility periods, wait for Strong signals only
- During low volatility periods, Early signals can be more actionable
5. Optimizing Parameters:
- For more volatile stocks: Increase Smoothing Length (6-8)
- For less volatile stocks: Decrease KLSE Sensitivity (1.2-1.5)
- For intraday trading: Reduce all length parameters by 30-50%
## Fine-Tuning for Different Markets
While optimized for KLSE, the indicator can be adapted for other markets:
1. For US Stocks:
- Reduce KLSE Sensitivity to 1.5
- Increase Volume Filter to 75%
- Adjust Strong Signal Level to 18
2. For Forex:
- Increase Smoothing Length to 8
- Reduce Early Signal Threshold to 0.6
- Focus more on divergence signals than crossovers
3. For Cryptocurrencies:
- Increase KLSE Sensitivity to 2.2
- Reduce Signal Levels (Strong: 12, Early: 8)
- Use higher Volume Filter (80%)
By thoroughly understanding and properly implementing the Enhanced KLSE Banker Flow Oscillator, traders can gain a significant edge in identifying institutional money flow and making more informed trading decisions, particularly in the Malaysian stock market.
Bursamalaysia

Bursa Malaysia Index SeriesBursa Malaysia Index Series. The index computation is as follows:-
Current aggregate Market Capitalisation/Base Aggregate Market Capitalisation x 100.
The Bursa Malaysia Index Series is calculated and disseminated on a real-time basis at 60-second intervals during Bursa’s trading hours.
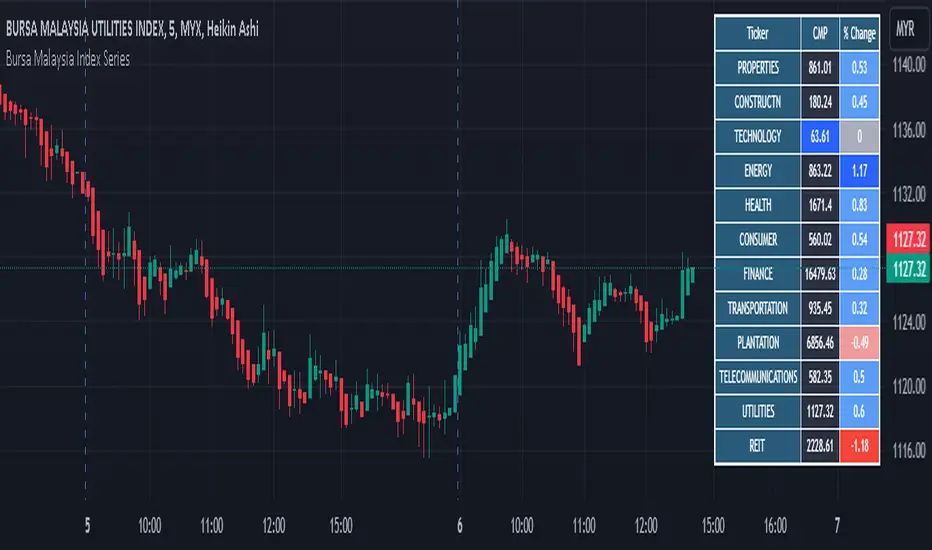
Bursa Malaysia Index SeriesERVIEW
This indicator is intend to display Bursa Malaysia Index Series.
█ FEATURES
1. Choose available sector based on Bursa Malaysia Index.
2. Plot close or OHLC.
3. Color of Closing price plot adapt to chart background color.
4. Font size can be selected.
█ EXAMPLES / USAGES

[LanZhu] - Bursa Index/Sector Trend With PortfolioDescription
Hi all, this is a simple indicator that shows trend of both KLCI and sectors of Bursa . The sector finding is using my Bursa_Sector library. Besides, I have also included portfolio tracker which is by Mohamed3nan in this script.
Usage
Top Trend - Malaysia KLCI Index Trend
Bottom Trend - Any Bursa Sector Trend
Portfolio Table - Copy from Portfolio Tracker by Mohamed3nan

Bursa_SectorLibrary "Bursa_Sector"
: List of stocks classified by sector in Bursa Malaysia (As of Oct 2021)
getSector()
This function will get the sector of current stock that listed in Bursa Malaysia

Shariah & PN17 Bursa MalaysiaDISCLAIMER: This Indicator work only with Bursa Malaysia's Stock
HOW DOES THE INDICATOR WORK
0. This is an overlay type of indicator. (Panel on chart)
1. This indicator list all shariah stock including warrant up to the month & year stated on the panel.
2. User may update the list (delete or adding) accordingly - refer to comment in the code
3. Panel of the indicator may be relocated in the indicator setting - default: TOP RIGHT
4. Panel will indicate Red Color with 'PN17' text for PN17/G3 stock
5. Panel will indicate Green Color with 'S' text for shariah stock
6. Panel will indicate none for non-shariah stock
7. If shariah stock was listed as PN17/GN3 stock, panel will indicate as PN17
Notes : Refer to code's comment for details.

bursamalaysianonshariahLibrary "bursamalaysianonshariah"
List of non-Shariah stock for Bursa Malaysia as of Oct 2021
No parameter required
status() will return 1 if ticker in the list, 0 if ticker not in the list and 2 if ticker not from Bursa Malaysia
Example usage :
//@version=5
indicator("My Script", overlay = true)
import BURSATRENDBANDCHART/bursamalaysianonshariah/1 as b
bgcolor(status() == 1 ? color.new(color.red, 90) : status() == 0 ? color.new(color.green, 90) : color.new(color.blue, 90))
Special thanks to
wmsafwan
RozaniGhani-RG
[HuD] Malaysia COVIC-19This indicator show Covic-19 statistics for Malaysia.
The bar chart indicates :
1) Current Covic case in Malaysia
- Red Bar = if the case is higher than the previous day
- Grey Bar = if case lower or equal than the previous day
2) Red Line = 20 days moving average of daily covic case
Traders can also load Malaysia data from TV using the id as below :
1) CONFIRMED_MY
2) DEATHS_MY
3) RECOVERED_MY
Thanks :)
Note :
Trades can load this indi on any chart, but it only show data
of the previous 2 days since the data from WHO has not yet updated.

[HuD] Yearly High Low1. Indicator will display highest and lowest price level within yearly period.
- Highest Yearly Price = green line
- Lowest Yearly Price = red line
2. User also has an option to display Monthly high and low level.
- Monthly Highest Price = Blue Line
- Monthly Lowest Price = Orange Line

Relative Strength Comparison_FBMSCAPShows the strength of current symbol relative to strength of another symbol, defaulted to Bursa Malaysia broad market index: FBMSCAP. Best viewed in weekly chart.

Indices Sector SigmaSpikes█ OVERVIEW
“The benchmark Dow Jones Industrial Average is off nearly 300 points as of midday today...”
“So what? Is that a lot or a little? Should we care?”
-Adam H Grimes-
This screener aims to provide Bird-Eye view across sector indices, to find which sector is having significant or 'out-of-norm' move in either direction.
The significance of the move is measured based on Sigma Spikes, a method proposed by Adam H. Grimes, where Standard Deviation of returns used as a baseline.
*You can google his blog or read his book, got some gold in there, especially on how he use indicators for trading
█ Understanding Sigma Spikes
As described by Grimes, moves in markets are only meaningful when we consider what “normal” is for that market.
Without that baseline, the daily change number, and even the percent change on the day doesn’t really mean much.
To overcome that problem, Sigma Spikes, as a measure of volatility, attempt to put todays change in price (aka return) in context of the standard deviation of 20 days daily's return.
Refer chart below:
1. The blue bars refer to each days return
2. The orange line is 1 time standard deviation of past 20days daily's return (today not included)
3. The red line is 2 time standard deviation of past 20days daily's return (today not included)
Using the ratio of today's return over the Std Deviation, determining your threshold (1,2,3,etc) will be the key that tells if today's move is significant or not.
*Threshold referring to times standard deviation, and different market may require different threshold.
*20 Days period are based on the Lookback Period, adjustable from user input window.
█ Features
- Scan up to 13 symbols at a time (Bursa (MYX) indices are defaulted, but you may change to any symbols/index from the user input setting)
█ Limitation
- Due to multiple use of security() function required to call other symbols, expect the screener to be slow at certain times
- Custom Timeframe currently accept only Daily and Weekly. I'll try to include lower timeframe in the next update
█ Disclaimer
Past performance is not an indicator of future results.
My opinions and research are my own and do not constitute financial advice in any way whatsoever.
Nothing published by me constitutes an investment recommendation, nor should any data or Content published by me be relied upon for any investment/trading activities.
I strongly recommends that you perform your own independent research and/or speak with a qualified investment professional before making any financial decisions.
Any ideas to further improve this indicator are welcome :)

HuD Bursa Strength IndexHuD Bursa Strength Index
- is a RSI oscilator for Malaysia Index Sector
- it will display RSI of selected Index sector such as Technology and compare it with current counter's chart
The purpose is to see the "relationship" between the counter and selected Index's RSI .
Setting :
- Default setting for RSI is 14, source is close
- Index sector includes :
"FBMKLCI", "TECHNOLOGY","ENERGY","PLANTATION", "PROPERTIES", "CONSUMER", "FINANCE", "CONSTRUCTN", "IND-PROD", "HEALTH", "TRANSPORTATION", "TELECOMMUNICATIONS" dan "UTILITIES"
// BM //
- RSI utk sektor-sektor indeks di Bursa Malaysa
Tujuan indicator :
- untuk bandingkan carta kaunter pilihan dengan RSI indeks berkaitan seperti KLCI, Teknology dan lain-lain
- Boleh lihat "relationship" kaunter dengan indeks
- Mungkin boleh mencari timing yang sesuai untuk entry atau exit bersesuaian dengan kekuatan indeks yang berkaitan
- Trader boleh pilih indeks-indeks dari option setting :
"FBMKLCI", "TECHNOLOGY","ENERGY","PLANTATION", "PROPERTIES", "CONSUMER", "FINANCE", "CONSTRUCTN", "IND-PROD", "HEALTH", "TRANSPORTATION", "TELECOMMUNICATIONS" dan "UTILITIES"

MA 10,20,50,200Indicator consist of moving averages (MA).
This indicator make it easier for me to switch between few MA lines.
1. MA10
- used for intraday.
2. MA50 and Ichimoku
- to analyze swing trend
- display only MA50 and ichimoku cloud
3. MA20, MA50 and MA200
- to analyze the trend
- for swing trade
4. Lines 52 Week High / Low
- display both lines as guide when trading