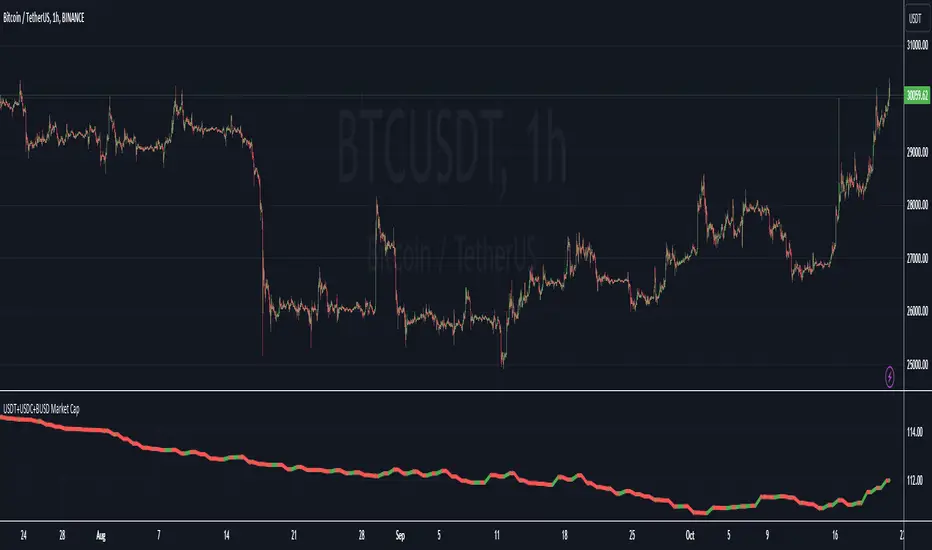
USDT+USDC+BUSD Market CapThis Pine Script indicator visualizes the combined market capitalization of three prominent stablecoins: USDT, USDC, and BUSD, on a daily basis.
It fetches the daily closing market caps of these stablecoins and sums them. The resulting line graph is displayed in its own separate pane below the main price chart.
The line is color-coded: green on days when the market cap is increasing compared to the previous day, and red when it's decreasing.
Busd
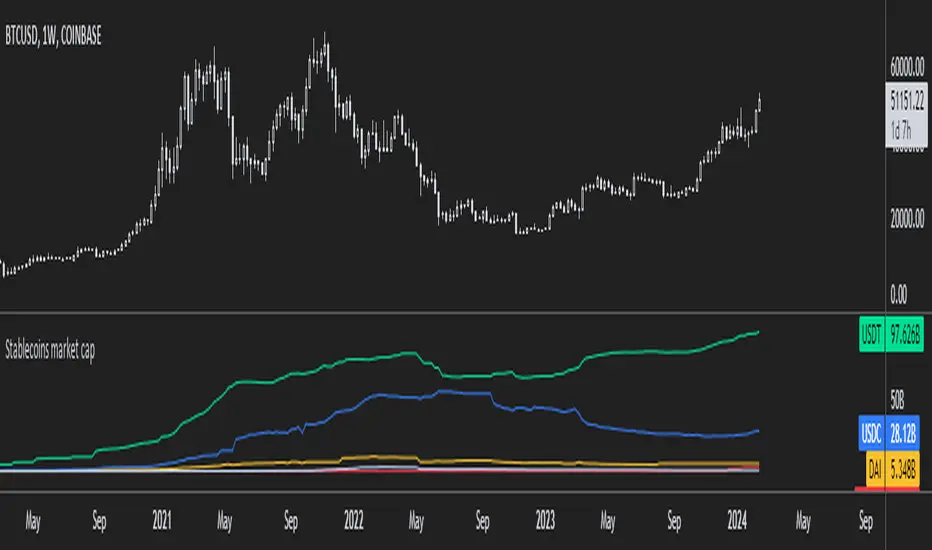
Stablecoins market capA simple indicator that displays either the aggregated market cap of the top five stablecoins, or it displays all coins at once (look in the settings).
Because of limitations with the sourced data the indicator only works on the daily timeframe or higher.
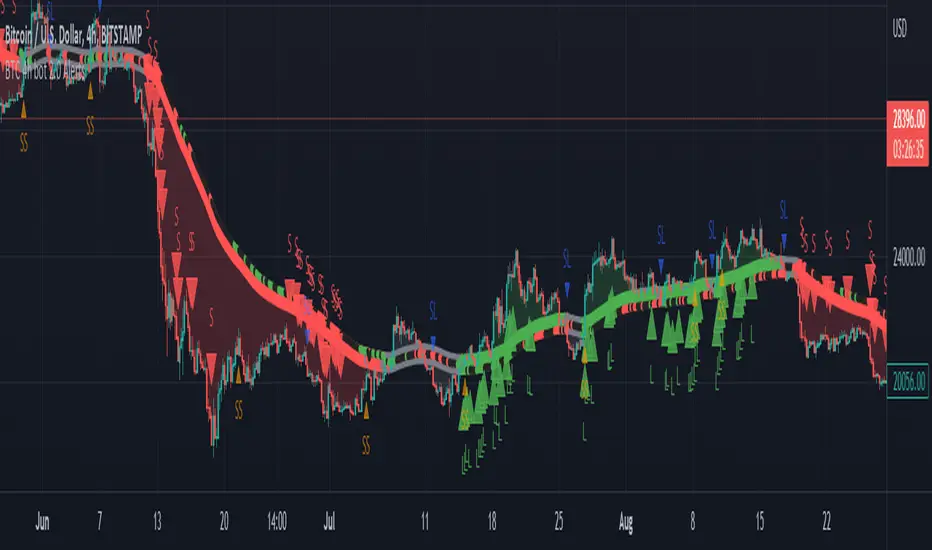
BTC 4h bot 2.0 AlertsThis is Alert version of BTC 4h bot 2.0.
Optimized for pairs BTC vs stablecoins, 4h timeframe.
HOW IT WORKS:
Script is based on the fact that there are certain phases of the market when there is a greater probability that BTC will go to one side or the other. To evaluate which phase we are in, the script uses "Main trend" and "Confirmation signals".
Main trend
- Is composed of a combination of several supertrends and moving averages. A Supertrend is a trend following indicator that helps in identifying whether we are in an uptrend or a downtrend. A higher factor is used to capture the main trend and not just small movements. In case the market goes sideways, the Supertrend does not work well, so it is a combination of multiple supertrends along with moving averages to differentiate a real strong trend from a range.
- It can be seen on the graph as a thick solid line.
- In an uptrend is green, in a downtrend red, gray represents the neutral zone.
Confirmation signals
- Are several script-evaluated indicators such as RSI , MACD , ADX and others, which serve to confirm the trend. In this case, it is the opposite way to the Main trend. Confirmation signals are used here to detect small movements. They are trying to capture bullish and bearish price momentum.
- On the graph they are seen as dashed lines above or below the Main trend (in the gray zone they are in the middle).
- It indicates only two signals, green for buy and red for sell.
HOW TO USE IT:
if the Main trend and Confirmation signals are of the same color, it will send a buy or sell signal, depending on which phase of the trend it is in. If the Main trend is e.g. in an uptrend and the market is going up, Confirmation signals should generate a lot of signals. But if the market starts to go in the opposite direction, Confirmation signals should generate fewer signals or none at all, thus reducing the number of wrong trades. In the gray zone of the Main trend it does not open positions.
To close position is possible to use stop loss and take profit or alternative could be to set very high TP value, thereby letting the script close the positions by itself by Stop Long or Stop Short.
The recommended setting is:
TP: 3.9%
SL: 4.7%.
In this case, it is a Alert version, where can be seen all the signals, which the script generates.
Green triangels indicate open Long.
Red triangels indicate open Short.
Small blue triangels indicate Stop Long position.
Small orange triangels indicate Stop Short position.
Signal is valid after bar is closed, so do not open a position before.
Script works well on Bitstamp, but also other exchanges with pair BTC/USD or BTC/stablecoins.
The script works consistently well over a long period of time, using past probabilities, but this does not guarantee future results.
BTC 4h bot 2.0 StrategyThis is Strategy version of BTC 4h bot 2.0.
Optimized for pairs BTC vs stablecoins, 4h timeframe.
HOW IT WORKS:
Script is based on the fact that there are certain phases of the market when there is a greater probability that BTC will go to one side or the other. To evaluate which phase we are in, the script uses "Main trend" and "Confirmation signals".
Main trend
- Is composed of a combination of several supertrends and moving averages. A Supertrend is a trend following indicator that helps in identifying whether we are in an uptrend or a downtrend. A higher factor is used to capture the main trend and not just small movements. In case the market goes sideways, the Supertrend does not work well, so it is a combination of multiple supertrends along with moving averages to differentiate a real strong trend from a range.
- It can be seen on the graph as a thick solid line.
- In an uptrend is green, in a downtrend red, gray represents the neutral zone.
Confirmation signals
- Are several script-evaluated indicators such as RSI , MACD , ADX and others, which serve to confirm the trend. In this case, it is the opposite way to the Main trend. Confirmation signals are used here to detect small movements. They are trying to capture bullish and bearish price momentum.
- On the graph they are seen as dashed lines above or below the Main trend (in the gray zone they are in the middle).
- It indicates only two signals, green for buy and red for sell.
HOW TO USE IT:
if the Main trend and Confirmation signals are of the same color, it will send a buy or sell signal, depending on which phase of the trend it is in. If the Main trend is e.g. in an uptrend and the market is going up, Confirmation signals should generate a lot of signals. But if the market starts to go in the opposite direction, Confirmation signals should generate fewer signals or none at all, thus reducing the number of wrong trades. In the gray zone of the Main trend it does not open positions.
To close position is possible to use stop loss and take profit or alternative could be to set very high TP value, thereby letting the script close the positions by itself.
The default setting is:
TP: 3.9%
SL: 4.7%.
In this case, it is a strategy to find out how the script worked in the past period. The longest period in which it is possible to test BTCUSD is on the Bitstamp exchange. The script works consistently well over a long period of time, using past probabilities, but this does not guarantee future results.

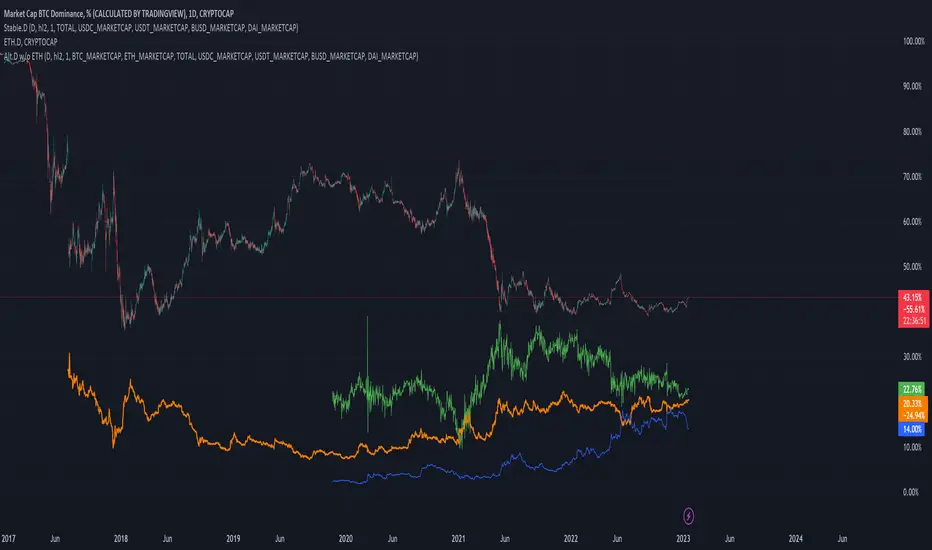
Stablecoins DominanceStablecoins Dominance
The purpose of the script is to show Stablecoin's strength in the crypto markets.
5 Largest Stablecoins divided by Total Market Cap
Stablecoins CorrelationThe indicator shows the correlation between stablecoins and bitcoin by means of liquidity flowing from stables to crypto and back. Where the indicator has highs, the bitcoin is usually the bottom and vice versa.

Stablecoin Bias [Moto]Hello traders,
This script provides a background color for the major stablecoins with directional bias above and below 1.
Generally, it's considered market beneficial if USDT is over one , and generally a market deficit if USDT is under 1. These are of course theoretical and shouldn't be taken solely into account.
Indicator includes biases for:
- USDT
- USDC
- DAI
- BUSD
- Average of two major stables
Warning: Tradingview's background color function seems graphically intensive. I don't recommend more than one or two biases active simultaneously, as it will slow down your chart and create mouse lag.
Cheers
