• 產品
  • 社群
  • 市場
  • 經紀商
  • 更多
立即開始
  • 社群
  • /指標和策略
  • /Buyingselling

Buyingselling

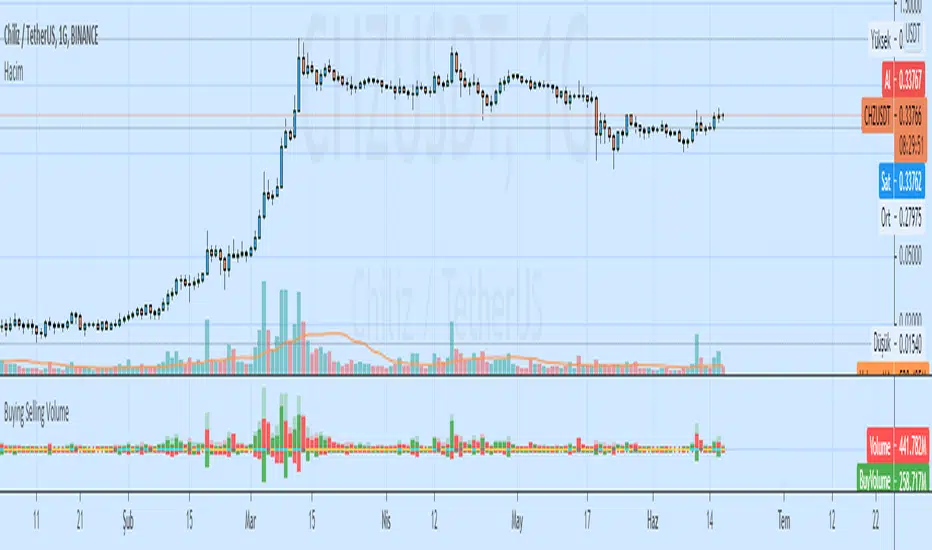
Buying Selling VolumeBuying Selling Volume -Buy Volume -Sell Volume -Buy Volume Percent % -Sell Volume Percent % -Volume Index -Buy Sell Volume- BuyVolume>SellVolume=Blue barcolor SellVolume>BuyVolume=Purple barcolor -Volume Index- VolumeIndex>length and close > open =Cyan barcolor VolumeIndex>length and close < open =Gray barcolor VolumeIndex<=length = Yellow barcolor
Pine Script®指標
由ceyhun提供
已更新
7272
Buying and Selling Smoothed with HistogramBuying and Selling Smoothed with Histogram Smoothed version with version with a red line representing the selling pressure and a green line which represents the Buying pressure. If the green line is above the red line it would mean that the Buying pressure is more and vice versa. The difference between the two is plotted as a Histogram. This is a cumulative value of the buying and selling pressure and provides a easy visual presentation of the dominating pressure.
Pine Script®指標
由ceyhun提供
已更新
88

選擇由ICE Data提供的市場數據。選擇由FactSet提供的參考數據。版權所有©2025FactSet Research Systems Inc.©2025TradingView, Inc.

不僅是產品
  • 超級圖表
篩選器
  • 股票
  • ETF
  • 債券
  • 加密貨幣
  • 加密貨幣對
  • CEX對
  • DEX對
  • Pine
熱圖
  • 股票
  • ETF
  • 加密貨幣
日曆
  • 經濟
  • 收益
  • 股息
更多產品
  • 殖利率曲線
  • 期權
  • 新聞流
  • Pine Script®
  • 精選股
App
  • 行動裝置
  • 電腦版
工具與訂閱
  • 功能特色
  • 價格
  • 市場數據
特別優惠
  • CME期貨
  • Eurex期貨
  • 美國股票包
關於公司
  • 我們是誰
  • 宣言
  • 運動員
  • 部落格
  • 職涯
  • 媒體工具包
商品
  • TradingView商店
  • 交易者塔羅牌
政策與安全
  • 使用條款
  • 免責聲明
  • 隱私政策
  • Cookies政策
  • 無障礙聲明
  • 安全漏洞
  • 狀態頁面
社群
  • 社交網路
  • 愛心牆
  • 推薦朋友
  • 網站規則
  • 版主
投資想法
  • 交易
  • 教育
  • 編輯精選
Pine腳本
  • 指標與策略
  • 大師
  • 自由開發人員
企業解決方案
  • 小工具
  • 圖表庫
  • Lightweight Charts™
  • 高級圖表
  • 交易平台
成長機會
  • 廣告
  • 經紀商整合
  • 夥伴計畫
  • 教育計劃
Look FirstLook First