ATR Gerchik LightAverage True Range ( ATR ) is a technical analysis indicator that measures volatility in the market. ATR is a moving average of the true range over a period of time.
ATR calculation procedure:
1. Determine the true maximum - this is the highest of the current maximum and yesterday's closing price of the day.
2. Determine the true minimum - this is the smallest of the current minimum and yesterday's closing price.
3. Determine the true range - this is the distance between the true maximum and minimum.
4. We exclude extremely large candles (> x2 ATR) and extremely small ones (< 0.5 ATR) from the obtained true ranges.
5. We calculate the average for the selected period based on the remaining range.
6. We calculate the percentage of the current True Range relative to the average ATR value for the previous period.
Description:
If you analyze it yourself, you will see that 75-80% of the time, the instrument moves only 1 ATR per day. You must understand that if an instrument has, for example, moved 80% of its daily range, it is not advisable to purchase it. This is comparable to a car's fuel tank: if the tank is almost empty, the car won't go far. Most indicators that calculate ATR include anomalous candles, which give unreliable results and lead to incorrect decisions. Because of this, many traders prefer to calculate ATR on their own.
However, the Gerchik ATR indicator accounts for anomalous candles and filters out extremely large candles (> 2x ATR) and extremely small ones (< 0.5x ATR). Additionally, this indicator immediately shows the consumed “fuel” of the instrument as a percentage, so you don't have to calculate the distance traveled yourself. This allows you to make quick, informed decisions. If we see that the tank is almost empty, it is logical not to get into that car today. When building any strategy, you must rely on the average movement.
Key Features:
Anomalous Candle Filtering: Excludes extremely large and small candles to provide more reliable ATR values.
Consumed Fuel Indicator: Shows the percentage of the ATR consumed, helping traders quickly assess the remaining potential movement.
Daily Timeframe Focus: Designed specifically for use on daily charts for accurate long-term analysis.
Practical Applications:
Entry and Exit Points: Use the ATR to determine optimal entry and exit points by assessing market volatility and potential price movement.
Stop-Loss Placement: Calculate stop-loss levels based on ATR to ensure they are placed at appropriate distances, accounting for current market volatility.
Trend Confirmation: Use the percentage of ATR consumed to confirm the strength of a trend and decide whether to enter or exit trades.
Examples of Use:
Trend Following: During strong trends, ATR helps identify periods of increased volatility, signaling potential breakouts or reversals.
Range Trading: In ranging markets, ATR can highlight periods of low volatility, indicating consolidation and potential breakout zones.
Note: The indicator is displayed and works only on the daily timeframe!
The indicator was created according to the instructions, description of the functionality, and strategy of Mr. Gerchik. Thank you so much, Chief!
________________________
Average True Range ( ATR , средний истинный диапазон) – это индикатор технического анализа, который измеряет волатильность на рынке. ATR представляет собой скользящее среднее истинного диапазона за определенный период времени.
Порядок расчета ATR:
1. Определяем истинный максимум – это наивысшее из текущего максимума и вчерашней цены закрытия дня.
2. Определяем истинный минимум – это наименьшее из текущего минимума и вчерашней цены закрытия.
3. Определяем истинный диапазон – это расстояние между истинным максимумом и минимумом.
4. Исключаем из полученных истинных диапазонов экстремально большие свечи (> x2 ATR) и экстремально маленькие (< 0.5 ATR).
5. Рассчитываем среднее за выбранный период исходя из оставшегося диапазона.
6 . Рассчитываем процент текущего истинного диапазона (True Range) относительно среднего значения ATR за предыдущий период.
Описание:
Если вы сами проанализируете, то увидите, что 75-80% времени инструмент ходит только 1 ATR. И вы должны понимать, что если инструмент внутри дня прошел, к примеру, 80% своего движения, то этот инструмент больше нельзя покупать. Это можно сравнить с баком машины: если бак почти пустой, машина далеко не уедет. Большинство индикаторов, которые рассчитывают ATR, производят расчет с паранормальными свечами. Это дает недостоверный результат и приводит к неверным решениям. Многие трейдеры из-за этого не используют готовые индикаторы и предпочитают считать ATR самостоятельно. Но индикатор ATR Gerchik учитывает паранормальные свечи и фильтрует экстремально большие свечи (> x2 ATR) и экстремально маленькие (< 0.5 ATR). Также этот индикатор сразу показывает израсходованный "бензин" инструмента в процентах. И вам не надо самостоятельно высчитывать пройденный путь. Вы можете быстро принимать правильные решения. Если мы видим, что бак почти пустой, логично не садиться в эту машину сегодня. Когда вы строите какую-то стратегию, вы должны обязательно полагаться на среднестатистическое движение.
Существует много стратегий, завязанных на ATR, которые учитывают волатильность инструмента, запас хода, точки разворота, места выставления стоп-лоссов (SL) и тейк-профитов (TP) и другие факторы. Я не буду останавливаться на них, так как каждый может найти описание этих стратегий и использовать их на свой выбор.
Индикатор отображается и работает только на дневном таймфрейме!
Индикатор создан по наставлениям, описанию функционала и стратегии господина Герчика. Огромное спасибо, Шеф!
K線分析

ICT Single Candle Order Block (SCOB) [UAlgo]The "ICT Single Candle Order Block (SCOB) " designed for traders who utilize the concept of Order Blocks in their trading strategy. Order Blocks are significant price levels where institutions or smart money have placed their trades, leading to potential future price reactions when these levels are revisited. This indicator focuses on identifying and highlighting Single Candle Order Blocks (SCOBs), allowing traders to visually analyze key price levels on their charts.
🔶 What is Single Candle Order Block (SCOB) ?
A Single Candle Order Block (SCOB) is a specific type of Order Block that is identified based on a single candlestick pattern. These patterns indicate potential areas where significant buying or selling interest has occurred, often leading to a notable price reaction when revisited. In the context of this indicator, a bullish SCOB is identified when a specific bullish candlestick pattern is met, and a bearish SCOB is identified based on a bearish candlestick pattern.
Bullish SCOB: Detected when the open price of two bars ago is higher than its close, the close price of the previous bar is higher than its open, the current close price is higher than the open, the low of the previous bar is lower than the low of two bars ago, and the current close is higher than the high of the previous bar.
Bearish SCOB: Detected when the open price of two bars ago is lower than its close, the close price of the previous bar is lower than its open, the current close price is lower than the open, the high of the previous bar is higher than the high of two bars ago, and the current close is lower than the low of the previous bar.
🔶 Key Features
Show Single Candle Order Block (SCOB): Toggle the visibility of the Single Candle Order Blocks on the chart.
Mitigation Method: Choose between "Close" and "Wick" methods for determining whether a SCOB has been mitigated (price has interacted with the block).
Show Last X SCOBs: Control the number of most recent SCOBs displayed on the chart, allowing you to focus on the most relevant price levels.
Volatility Filter: Enable or disable the volatility filter, which uses the Average True Range (ATR) to filter out less significant SCOBs. When enabled, only SCOBs with an ATR above the mean value of the ATR are displayed.
Customizable Colors: Configure the colors for bullish and bearish SCOBs to enhance visual clarity. The indicator uses cooler RGB values to ensure the blocks are distinct and easily noticeable.
🔶 Disclaimer
The "ICT Single Candle Order Block (SCOB) " indicator is provided for educational and informational purposes only. Trading involves significant risk and may not be suitable for all investors.
Past performance is not indicative of future results. Users should use this indicator in conjunction with their own research and trading strategy.

Candlestick Structure [LuxAlgo]The Candlestick Structure indicator detects major market trends and displays various candlestick patterns aligning with the detected trend, filtering out potentially unwanted patterns as a result. Multiple trend detection methods are included and can be selected by the users.
A dashboard showing the alignment percentage of each individual pattern is also provided.
🔶 USAGE
By distinguishing major and minor trend detection, we can still detect patterns based on minor trends, yet filter out the patterns that do not align with the major trend.
By detecting candlestick patterns that align with a major trend, we can effectively detect the ending points of retracements, potentially providing various entry points of interest within a trend.
Users are able to track the alignment of each candlestick pattern in the dashboard to reveal which patterns typically align with the trend and which may not.
Note: Alignment % only checks if the pattern's direction is the same as the current trend direction. These are only raw readings and not any type of confidence score.
🔶 DETAILS
In this indicator, we are identifying and tracking 16 different Candlestick Patterns.
🔹 Bullish Patterns
Hammer: Identified by a small upper wick (or no upper wick) with a small body, and an elongated lower wick whose length is 2X greater than the candle body’s width.
Inverted Hammer: Identified by a small lower wick (or no lower wick) with a small body, and an elongated upper wick whose length is 2X greater than the candle body’s width.
Bullish Engulfing: A 2 bar pattern identified by a large bullish candle body fully encapsulating (opening lower and closing higher) the previous small (bearish) candle body.
Rising 3: A 5 bar pattern identified by an initial full-bodied bullish candle, followed by 3 bearish candles that trade within the high and low of the initial candle, followed by another full-bodied bullish candle closing above the high of the initial candle.
3 White Soldiers: Identified by 3 full-bodied bullish candles, each opening within the body and closing below the high, of the previous candle.
Morning Star: A 3 bar pattern identified by a full-bodied bearish candle, followed by a small-bodied bearish candle, followed by a full-bodied bullish candle that closes above the halfway point of the first candle.
Bullish Harami: A 2 bar pattern, identified by an initial bearish candle, followed by a small bullish candle whose range is entirely contained within the body of the initial candle.
Tweezer Bottom: A 2 bar pattern identified by an initial bearish candle, followed by a bullish candle, both having equal lows.
🔹 Bearish Patterns
Hanging Man: Identified by a small upper wick (or no upper wick) with a small body, and an elongated lower wick whose length is 2X greater than the candle body’s width.
Shooting Star: Identified by a small lower wick (or no lower wick) with a small body, and an elongated upper wick whose length is 2X greater than the candle body’s width.
Bearish Engulfing: A 2 bar pattern identified by a large bearish candle body fully encapsulating (opening higher and closing lower) the previous small (bullish) candle body.
Falling 3: A 5 bar pattern identified by an initial full-bodied bearish candle, followed by 3 bullish candles that trade within the high and low of the initial candle, followed by another full-bodied bearish candle closing below the low of the initial candle.
3 Black Crows: Identified by 3 full-bodied bearish candles, each open within the body and closing below the low, of the previous candle.
Evening Star: A 3 bar pattern identified by a full-bodied bullish candle, followed by a small-bodied bullish candle, followed by a full-bodied bearish candle that closes below the halfway point of the first candle.
Bearish Harami: A 2 bar pattern, identified by an initial bullish candle, followed by a small bearish candle whose range is entirely contained within the body of the initial candle.
Tweezer Top: A 2 bar pattern identified by an initial bullish candle, followed by a bearish candle, both having equal highs.
🔹 Trend Types
Major trend is displayed at all times, the display will change depending on the trend method selected.
The minor trend can also be visualized; to avoid confusion, the minor trend can optionally be displayed through the candle colors.
Supertrend: Displays Upper and Lower SuperTrend, When we break above the upper, it is considered an Uptrend. When we break below the lower, it is considered a Downtrend.
EMAs: Displays Fast and Slow EMAs, When Fast>Slow, it is considered an Uptrend. When Fast

Hindsight TrendNon-realtime but highly accurate trend analyzer with only one fundamental parameter ( period aka "minimum trend length")
Basically Hindsight Trend is pivot points on steroids (handles many cases much better). Plus it shows the trend line.
Period
I usually like periods of 10, 20 or 30.
The indicator's delay is identical to the chosen period.
You can actually try a low period like 4 or 5 to get something resembling a realtime indicator.
Uptrends are based on candle lows, downtrends are based on candle highs. So it is possible to have an uptrend and a downtrend at the same time.
Triangles
At trend start, a triangle is drawn. (Trendline isn't always there if the trend didn't last that long.)
Triangle size shows how long the high or low that started the trend remained unbroken. E.g. with period 20: Small triangle = 20+ candles, medium triangle = 40+ candles, big triangle = 80+ candles. So a big triangle marks an important reversal point.
How Hindsight Trend works
Whenever a candle completes, its high and low are saved as potentially "notable" points. A high or low is the more notable the longer it stays unbroken (= not touched again by price).
Now we simply take the notable highs and lows (as in, staying unbroken at least for the user-selected period)... and connect them together - if they are close enough to each other (less than "period" candles away). And decorate the first point in each trend with a triangle.
We only know whether a point is notable after "period" more candles have printed, so that's where the indicator's delay comes from.
Finally we divide the period by 2 and look at highs and lows which are unbroken for that shorter time. While they are not fully "notable" as defined above, we'll call them "semi-notable". Those points are only considered at the end of a trend, and help us extend the trend line a bit further.

QuasimodoThis indicator helps traders spot certain patterns on a price chart that might indicate a change in price direction. These patterns are known as "engulfing patterns."
How It Works1.
Bullish Engulfing Patterns:- The current bar (or candle) closes higher than it opens (it's a green or white candle).- The previous bar closed lower than it opened (it was a red or black candle).- The current bar's high is higher than the previous bar's high, and its low is lower than the previous bar's low.- There's another variation where both the current and previous bars are green, but the current bar is still higher and lower than the previous one.
2. Bearish Engulfing Patterns:- The current bar closes lower than it opens (it's a red or black candle).- The previous bar closed higher than it opened (it was a green or white candle).- The current bar's low is lower than the previous bar's low, and its high is higher than the previous bar's high.- There's another variation where both the current and previous bars are red, but the current bar is still higher and lower than the previous one.
What It Shows-
When the indicator spots one of these patterns, it colors the previous candle:-
Yellow for a bullish pattern (price might go up).-
Pink for a bearish pattern (price might go down).
Alerts- The indicator can also send an alert to let you know when it finds one of these patterns, so you don't miss it.

Inside Bar Setup [as]Inside Bar Setup Indicator Description
The **Inside Bar Setup ** indicator is a powerful tool for traders to identify and visualize inside bar patterns on their charts. An inside bar pattern occurs when the current candle's high is lower than the previous candle's high, and the current candle's low is higher than the previous candle's low. This pattern can indicate a potential breakout or a continuation of the existing trend.
Key Features:
1. **Highlight Inside Bar Patterns:**
- The indicator highlights inside bar patterns with distinct colors for bullish and bearish bars. Bullish inside bars are colored with the user-defined bull bar color (default lime), and bearish inside bars are colored with the user-defined bear bar color (default maroon).
2. **Marking Mother Candle High and Low:**
- The high and low of the mother candle (the candle preceding the inside bar) are marked with horizontal lines. The high is marked with a green line, and the low is marked with a red line.
- These levels are labeled as "Range High" and "Range Low" respectively, with the labels displayed a few bars to the right for clarity. The labels have a semi-transparent background for better visibility.
3. **Target Levels:**
- The indicator calculates and plots potential target levels (T1 and T2) for both long and short positions based on user-defined multipliers of the mother candle's range.
- For long positions, T1 and T2 are plotted above the mother candle's high.
- For short positions, T1 and T2 are plotted below the mother candle's low.
- These target levels are optional and can be toggled on or off via the input settings.
4. **Customizable Inputs:**
- **Colors:**
- Bull Bar Color: Customize the color for bullish inside bars.
- Bear Bar Color: Customize the color for bearish inside bars.
- **Long Targets:**
- Show Long T1: Toggle the display of the first long target.
- Show Long T2: Toggle the display of the second long target.
- Long T1: Multiplier for the first long target above the mother candle's high.
- Long T2: Multiplier for the second long target above the mother candle's high.
- **Short Targets:**
- Show Short T1: Toggle the display of the first short target.
- Show Short T2: Toggle the display of the second short target.
- Short T1: Multiplier for the first short target below the mother candle's low.
- Short T2: Multiplier for the second short target below the mother candle's low.
5. **New Day Detection:**
- The indicator detects the start of a new day and clears the inside bar arrays, ensuring that the pattern detection is always current.
#### Usage:
- Add the indicator to your TradingView chart.
- Customize the inputs to match your trading strategy.
- Watch for highlighted inside bars to identify potential breakout opportunities.
- Use the marked range highs and lows, along with the calculated target levels, to plan your trades.
This indicator is ideal for traders looking to capitalize on inside bar patterns and their potential breakouts. It provides clear visual cues and customizable settings to enhance your trading decisions.
Note:
This indicator is based on famous 15 min inside bar strategy shared by Subashish Pani on his youtube channel Power of stocks. Please watch his videos to use this indicator for best results.

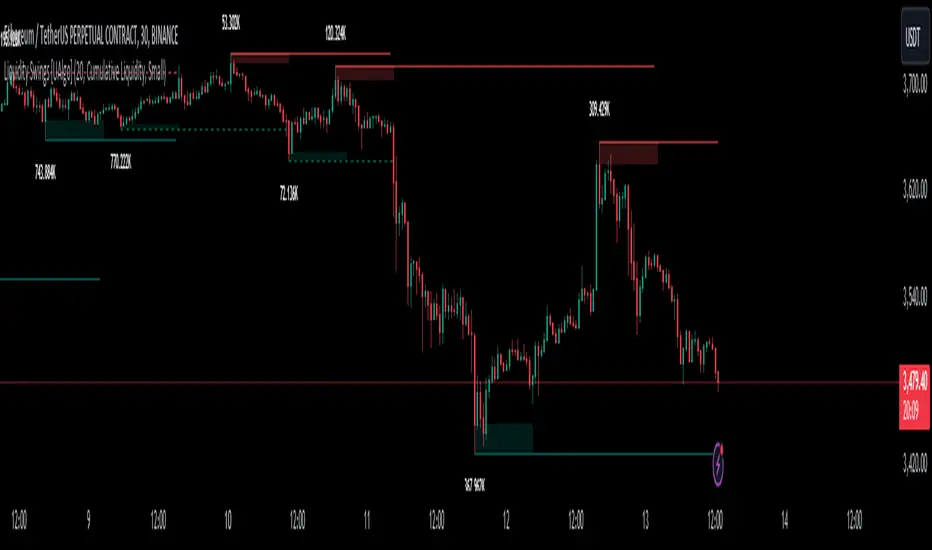
Liquidity Swings [UAlgo]The "Liquidity Swings " indicator is designed to help traders identify liquidity swings within the market. This tool is particularly useful for visualizing areas where liquidity is accumulating and where it is being swept, providing valuable insights for making informed trading decisions. By tracking the pivots in price and associating them with volume, the indicator highlights zones of potential support and resistance, helping traders understand market dynamics more clearly.
🔶 Key Features
Liquidity Swing Sensitivity: Adjustable sensitivity settings to fine-tune the detection of liquidity swings according to market conditions and trader preferences.
Two modes of liquidity calculation:
Cumulative Liquidity: Aggregates unswept liquidity over multiple swings until it is swept, providing a broader view of liquidity accumulation.
Individual Liquidity: Displays the accumulated liquidity for each swing independently, offering a more granular perspective.
Visual Customization: Options to customize the colors and sizes of liquidity lines, areas, and informational text for better visual clarity.
Dynamic Updates: The indicator dynamically updates liquidity zones and labels, adjusting to new market data to keep traders informed in real-time.
🔶 Disclaimer
The "Liquidity Swings " indicator is provided for educational and informational purposes only.
It should not be considered as financial advice or a recommendation to buy or sell any financial instrument.
The use of this indicator involves inherent risks, and users should employ their own judgment and conduct their own research before making any trading decisions. Past performance is not indicative of future results.
🔷 Related Scripts
Liquidity Sweeps
Williams %R Liquidity Sweeps
EngulfScanEngulf Scan
Introduction:
The Engulf Scan indicator helps users identify bullish and bearish engulfing candlestick patterns on their charts. These patterns are often used as signals for trend reversals and are important indicators for traders. Engulf Scan signals are generated when an engulfing pattern is swallowed by another candlestick of the opposite color.The signal of a candle engulfment formation is generated when the 1st candle is engulfed by the 2nd candle and the 2nd candle is engulfed by the 3rd candle.
Features:
Bullish Engulfing Pattern: Indicates the start of an upward trend and typically signals that the market is likely to move higher.
Bearish Engulfing Pattern: Indicates the start of a downward trend and typically signals that the market is likely to move lower.
Color Coding: Users can customize the background colors for bullish and bearish engulfing patterns.
Usage Guide:
Adding the Indicator: Add the "Engulf Scan" indicator to your TradingView chart.
Color Settings: Choose your preferred colors for bullish and bearish engulfing patterns from the indicator settings.
Pattern Detection: View the engulfing patterns on the chart with the specified colors and symbols. These patterns help identify potential trend reversal points.
Parameters and Settings:
Bullish Engulfing Color: Background color for the bullish engulfing pattern.( Green)
Bearish Engulfing Color: Background color for the bearish engulfing pattern. (Red)
Examples:
Bullish Engulfing Example: On the chart below, you can see bullish engulfing patterns highlighted with a green background. (Green)
Bearish Engulfing Example: On the chart below, you can see bearish engulfing patterns highlighted with a red background. (Red)
Frequently Asked Questions (FAQ):
How are engulfing patterns detected?
Engulfing patterns are formed when a candlestick completely engulfs the previous candlestick. For a bullish engulfing pattern, a bullish candlestick follows a bearish one. For a bearish engulfing pattern, a bearish candlestick follows a bullish one.
Which timeframes work best with this indicator?
Engulfing patterns are generally more reliable on daily and higher timeframes, but you can test the indicator on different timeframes to see if it fits your trading strategy.
Can I detect a reversal or trend?
As can be seen in the image, it sometimes appears as a return signal and sometimes as a harbinger of an ongoing trend.But it may be a mistake to use the indicator only for these purposes. However, this indicator may not be sufficient when used alone. It can be combined with different indicators from the Tradingview library.
Updates and Changelog:
v1.0: Initial release. Added detection and color coding for bullish and bearish engulfing patterns.
-Please feel free to write your valuable comments and opinions. I attach importance to your valuable opinions so that I can improve myself.

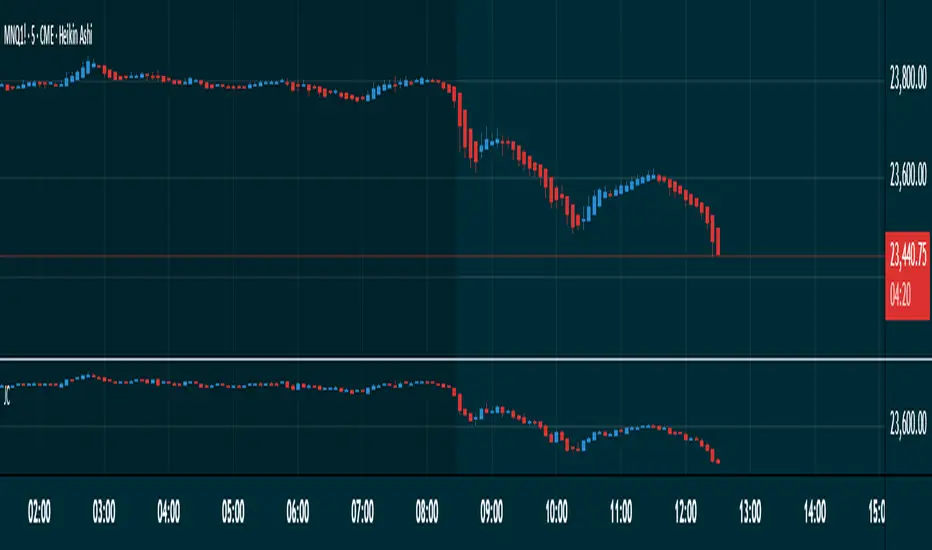
Japanese CandlesSimple script to add standard Japanese candles in a new pane for use when using a non-standard chart (Ex: Heikin Ashi) that doesn't use true OHLC values in it's calculation so that you can still monitor true values and activity without having to take up the screen real estate that using a layout containing a whole new chart would require. This also makes horizontal sync of the main chart to the Japanese candle chart perfect at all times.
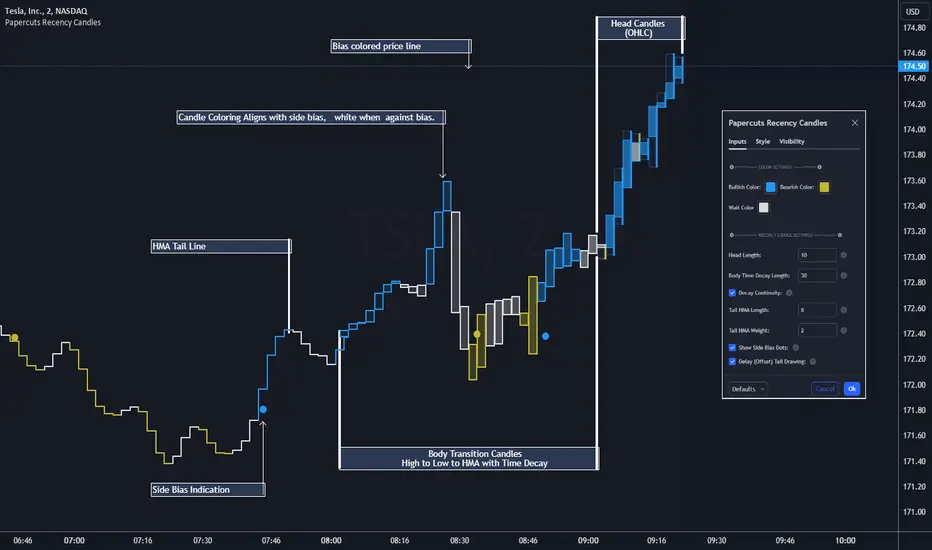
Papercuts Recency CandlesPapercuts Recency Candles
V0.8 by Joel Eckert @PapercutsTrading
***This is currently an experimental visual exploratory concept.***
*** Experimental tools should only be explored by fellow coders and experienced traders.***
DESCRIPTION:
As coders, how can we seamlessly transition between actual and smoothed price data sets as data ages?
This is a visual experiment to see if and how data can be smoothly transitioned from one value to another over a set number of candles. If we visualize a chart in 3 zones, a head, a body, and a tail we can start to understand how this could work. The head zone would represent the first data set of actual asset prices. The body zone would represent the transition period from the first to the to the second data set. Last, the tail zone would represent the second data set made of a Hull Moving Average of the asset.
CONCEPT:
It is conceived that data and position precision constantly shift as they decay or age, therefore making older price levels act more like price regions or zones vs exact price points. This is what I am calling Recency.
This indicator utilizes the concept of "Recency" to explore the possibility of a new style of candle. It aims to maintain accurately on recent prices action but loosen up accuracy on older price action. The very nature of this requires ALTERING HISTORICAL DATA within the body zone or transition candles to achieve the effect. It is similar to trying to merge a line chart type with a candle chart type.
This experiment of using recency for candles was to create candles that stay more accurate near current price but fade away into a simple line as they age out, resulting in a simplified view of the big picture which consists of older price action.
This experimental design theoretically will help you stay focused only on what is currently unfolding and to minimize distractions from older price nuances.
USAGE:
WHO:
This is not recommended for new traders or novices that are unfamiliar with standard tools. Standardized tools should always be used to get grounded and build a foundation.
Active traders who are familiar with trading comfortably should experiment with this to see if they find it interesting or usable.
Pine coders may find this concept interesting enough, and may adapt the idea to other elements of their own scripts if they find it interesting… I just ask they give credit where credit is due.
HOW:
The best way to visualize how this works is to do the following:
Load it on a chart.
Turn off Standard candles in Chart Setting of the current window. I actually just turn off the bodies and borders, and dim the old wicks as I like the way the old wicks look when left alone with these new candles.
Enable chart replay at a faster speed, like 3x, and play back the chart to watch the behavior of the candles.
You’ll be able to see how the head of the candle type preserves OHLC, and indicates direction but as the candle starts to age it progressively flowers into the HMA
While it plays back try adjusting settings to see how they affect behavior.
You can see the data average in real-time which often reveals how unstable actual price noise really is.
The head candle diagonals indicate the candle body direction.
SETTINGS:
Coloring: You can choose your own bullish or bearish colors to match your scheme.
Price Line: The price line is colored according to the trend and
Head Length: These candles are true to the source high and low. They remain slightly brighter than transition candles. We have a max of 50 to keep things responsive.
Time Decay Length: This is the amount of candles it takes to transition to the tail. Max is 300 to keep things responsive.
Decay Continuity: This forces transition candles to complete the HMA curve instead of creating gaps when conforming to it. The best way to visualize this feature is to run a 3x replay of an asset, and toggle the result on and off. On is preferred.
Tail HMA Length: This is the smoothing amount for the resulting HMA stepline that calculates every close, but has a delayed draw until after the transition candles. You can optionally turn off the delayed visibility to help with comprehension.
Tail HMA Weight: This is simply an option to make the tail thicker or thinner. This also adjusts the border on the head candles to help them stand out.
Show Side Bias Dots: Default true: Draws a dot when bias to one side changes to help keep you on the right side of trade. Side bias is simply the alignment of 3 moving averages in one direction.
IMPORTANT NOTES:
You'll have to turn off or dim the standard candles in your view "Chart Settings" to see this properly.
Be aware that since the candles are based on boxes and utilize the “recency concept”, which means their data decays and changes as it ages. This results in a cleaner chart overall, but exact highs and lows will be averaged out as the data decays, forming a Hull Moving Average stepline of your defined length once decay has finished.
SUMMARY OF HOW IT WORKS:
First it takes candle information and creates unique boxes that represent each candle based on the high and low. It utilizes boxes because standard candles once written, cannot be later altered or removed… which is a key element for this effect to work.
Next it creates a second box and line from open to close for the body of the Head candles. This indicates direction at a glance.
As candles age beyond the defined distance of the “Head” they enter the "Body" aka "Time Decay" zone. Here the accuracy of the high and low will be averaged down using an incremental factor of the HMA, defined by "Time Decay Length" amount of candles.
The resulting tail is an HMA of Tail HMA Length. This tail is always calculate at close, but is not drawn instantly. The draw is delayed so that there is not overlapping data, and this makes the effect look more elegant.
There are also two EMAs within the script that do nothing but help candle coloring and help provide a trade side bias. When both EMA's and the HMA align, a side bias is defined. Only when the side bias changes will a new dot is formed.
Head candles have been simplified from previous versions to be easier to read at a a glance.
Consecutive count backtester / Flowly Indicators- Overview
Consecutive counting is a simple method to mechanically define trending states to the upside and downside. Consecutive counts are calculated by taking reference price level (e.g. close 4 candles ago) and count closes above/below it up to a maximum count that resets the consecutive count back to 1. This tool provides the means to backtest each count by measuring % change in price after each count (e.g. % gain 2 candles after a given count).
Users can define reference source that starts the consecutive count (e.g. close 4 candles ago), maximum count where counter resets (e.g. after 9th count) and backtesting period (e.g. price change 2 candles after count).
Filters add extra conditions that must be met on the consecutive count to qualify as valid, which are also reflected on the backtest metrics. The counts can be refined using the following filters:
- RSI above/below X
- Price above/below/at moving average of choice
- Relative volume above/below X
Average gain corresponding to each count as they occur can be toggled off for less clutter. Average price change can also be visualized using candle color. Colors, gradient and table/label sizes are fully customizable.
- Practical guide
Example #1: Identify reversal potential
Consecutive counting is a simple yet effective method to for detecting reversals, for which 7-9 counts are traditionally used. Whether that holds true or not can now be put through a test with different variations of the method as well as using additional filters to improve the probability of a turn.
Example #2: Identify trend following potential
Consecutive counts can also have utility value for trend following. When historical short term change is to the downside, expect downside, when to the upside, expect upside.

Multi Time Period Box Analysis v2 [ HDBhagat ]The "Multi Time Period Chart" indicator in Pine Script is designed to overlay multiple sets of boxes on the chart, each representing price movements on different timeframes. It allows traders to visually compare price action across various timeframes simultaneously. The indicator offers flexibility by allowing users to choose between automatic mode (where timeframes are selected based on predefined rules) or manually defining custom timeframes.
Key Features:
Multi-Timeframe Analysis: The indicator enables traders to analyze price action across multiple timeframes concurrently, facilitating a comprehensive view of market dynamics.
User-Defined Timeframes: Traders can customize the timeframes for each set of boxes according to their preferences. They have the option to choose between automatic mode, which selects timeframes based on predefined rules, or manually inputting custom timeframes.
Visual Representation: Price movements are visually represented by boxes drawn on the chart, with each box indicating the price range (from high to low) within a specific timeframe. The color of the boxes indicates whether the closing price is higher or lower than the opening price.
Dynamic Updates: The indicator dynamically updates the boxes as new price data becomes available. It ensures that the visualization remains accurate and reflects the most recent market conditions.
Customizable Styling: Traders can customize the appearance of the boxes, including color, border style, and text display. This allows for personalization to suit individual preferences and improve readability.
Efficient Resource Management: The script efficiently manages computing resources by only processing data when necessary, avoiding unnecessary calculations and reducing runtime errors.
Compatibility: The script is compatible with the Pine Script language on the TradingView platform, making it accessible to a wide range of traders who use this platform for technical analysis.
Overall, the "Multi Time Period Chart" indicator provides traders with a powerful tool for conducting multi-timeframe analysis, aiding in trend identification, pattern recognition, and decision-making in the financial markets.

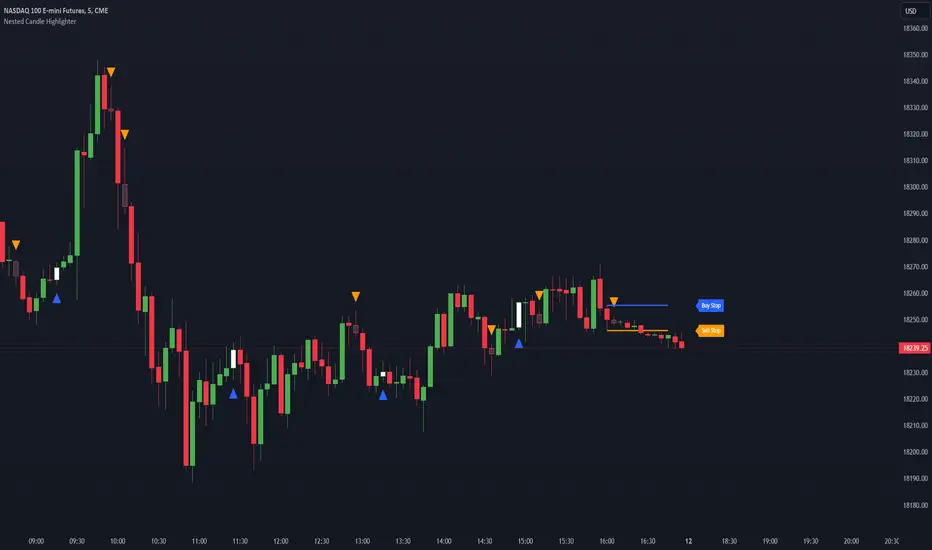
Nested Candle Highlighter @shrilssThe Nested Candle Highlighter identifies when the current candle's body is completely enclosed by the previous candle's wick zones. It examines the upper wick zone, from the previous high to the open or close, and the lower wick zone, from the low up to the open or close. This focused analysis can signal consolidation and potential shifts in momentum, offering an insightful addition to your trading analysis.
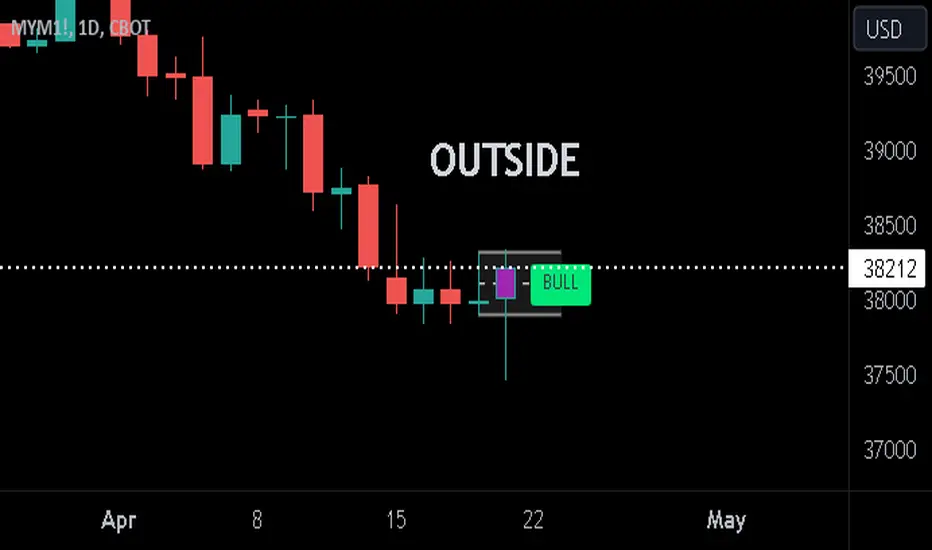
Previous Candle + Inside/OutsideThe script uses the previous candle of the current timeframe to assess the state of the current candle.
1. Previous candle high/low and midpoint are displayed
2. Highlights current bar if INSIDE previous candle
3. Highlights current bar if POTENTIAL OUTSIDE bar. This condition uses the logic that if the previous high/low has been swept and price then reaches previous bar 50%, then an OUTSIDE bar is possible.
4. If current candle breaks previous high/low, a label is added to identify.
5. If above condition is true and current candle color is opposite of previous, then label is highlighted to show possible bull/bear condition.
6. If current candle live price is below previous midpoint, a BEAR label is shown
7. If current candle live price is above previous midpoint, a BULL label is shown
I personally use the indicator on Daily/Weekly/Monthly charts to help with my overall market assessment. However users may find their own use for the indicator...or modify it to their own preferences.
As ever, the indicator should only be used with live trading accounts after thorough backtesting using a large data range.
FOMO Alert (Miu)This indicator won't plot anything to the chart.
Please follow steps below to set your alarms based on price range variation:
1) Add indicator to the chart
2) Go to settings
3) Choose timeframe which will be used to calculate bars
4) Choose how many bars which will be used to calculate max and min range
5) Choose max and min range variation (%) to trigger alerts
5) Choose up to 6 different symbols to get alert notification
6) Once all is set go back to the chart and click on 3 dots to set alert in this indicator, rename your alert and confirm
7) You can remove indicator after alert is set and it'll keep working as expected
What does this indicator do?
This indicator will generate alerts based on following conditions:
- If min and max prices reach the range (%) from amount of bars on timeframe set for any symbol checked it will trigger an alert.
- If next set of bars reaches higher range than before it will trigger an alert with new data
- If next set of bars doesn't reach higher range than before it will not trigger alerts, even if they are above the range set (this is to prevent the alert to keep triggering with high frequency)
Once condition is met it will send an alert with the following information:
- Symbol name (e.g: BTC, ETH, LTC)
- Range achieved (e.g: 3,03%)
- Current symbol price and current bar direction (e.g: 63,477.1 ▲)
This script will request lowest and highest prices through request.security() built-in function from all different symbols within the range set. It also requests symbols' price (close) and amount of digits (mintick) for each symbol to send alerts with correct value.
This script was developed with main purpose to send alerts when there are strong price movements and I decided to share with community so anyone can set different parameters for different purposes.
Feel free to give feedbacks on comments section below.
Enjoy!

BINANCE-BYBIT Cross Chart: Spot-Perpetual CorrelationName: "Binance-Bybit Cross Chart: Spot-Perpetual Correlation"
Category: Scalping, Trend Analysis
Timeframe: 1M, 5M, 30M, 1D (depending on the specific technique)
Technical analysis: This indicator facilitates a comparison between the price movements shown on the Binance spot chart and the Bybit perpetual chart, with the aim of discerning the correlation between the two charts and identifying the dominant market trends. It automatically generates the corresponding chart based on the ticker selected in the primary chart. When a Binance pair is selected in the main chart, the indicator replicates the Bybit perpetual chart for the same pair and timeframe, and vice versa, selecting the Bybit perpetual chart as the primary chart generates the Binance spot chart.
Suggested use: You can utilize this tool to conduct altcoin trading on Binance or Bybit, facilitating the comparison of price actions and real-time monitoring of trigger point sensitivity across both exchanges. We recommend prioritizing the Binance Spot chart in the main panel due to its typically longer historical data availability compared to Bybit.
The primary objective is to efficiently and automatically manage the following three aspects:
- Data history analysis for higher timeframes, leveraging the extensive historical data of the Binance spot market. Variations in indicators such as slow moving averages may arise due to differences in historical data between exchanges.
- Assessment of coin liquidity on both exchanges by observing candlestick consistency on smaller timeframes or the absence of gaps. In the crypto market, clean charts devoid of gaps indicate dominance and offer enhanced reliability.
- Identification of precise trigger point levels, including daily, previous day, or previous week highs and lows, which serve as sensitive areas for breakout or reversal operations.
All-Time High (ATH) and All-Time Low (ATL) levels may vary significantly across exchanges due to disparities in historical data series.
This tool empowers traders to make informed decisions by leveraging historical data, liquidity insights, and precise trigger point identification across Binance Spot and Bybit Perpetual market.
Configuration:
EMA length:
- EMA 1: Default 5, user configurable
- EMA 2: Default 10, user configurable
- EMA 3: Default 60, user configurable
- EMA 4: Default 223, user configurable
- Additional Average: Optional display of an additional average, such as a 20-period average.
Chart Elements:
- Session separator: Indicates the beginning of the current session (in blue)
- Background: Indicates an uptrend (60 > 223) with a green background and a downtrend (60 < 223) with a red background.
Instruments:
- EMA Daily: Shows daily averages on an intraday timeframe.
- EMA levels 1h - 30m: Shows the levels of the 1g-30m EMAs.
- EMA Levels Highest TF: Provides the option to select additional EMA levels from the major timeframes, customizable via the drop-down menu.
- "Hammer Detector: Marks hammers with a green triangle and inverted hammers with a red triangle on the chart
- "Azzeramento" signal on TF > 30m: Indicates a small candlestick on the EMA after a dump.
- "No Fomo" signal on TF < 30m: Indicates a hyperextended movement.
Trigger Points:
- Today's highs and lows: Shows the opening price of the day's candlestick, along with the day's highs and lows (high in purple, low in red, open in green).
- Yesterday's highs and lows: Displays the opening price of the daily candlestick, along with the previous day's highs and lows (high in yellow, low in red).
You can customize the colors in "Settings" > "Style".
It is best used with the Scalping The Bull indicator on the main panel.
Credits:
@tumiza999: for tests and suggestions.
Thanks for your attention, happy to support the TradingView community.

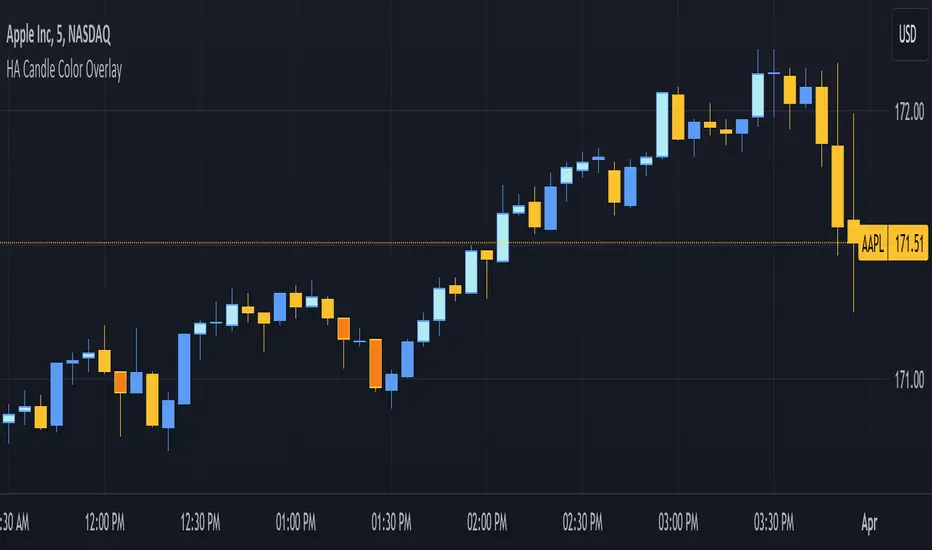
3. [Pufferman] - HA Candle Color OverlayThis indicator is designed for traders who utilize Heikin-Ashi (HA) candles to determine market trend direction and strength but prefer not to clutter their charts with multiple candlestick overlays or constantly switch between chart types. It aims to enhance chart readability by marking significant HA candles directly on the price chart, leveraging the unique characteristics of HA candles to signal trend direction and momentum.
Key Features:
1. Trend Identification through HA Candles: Automatically calculates Heikin-Ashi candles based on standard price data, highlighting significant HA candles that exhibit flat tops or bottoms. These characteristics are indicators of strong trend presence and direction. Highlights are in darker or lighter shade (darker - bearish or light - bullish colors) than the standard candles for easy read.
2. Cleaner Chart Presentation: Offers a streamlined alternative to overlaying HA candles on traditional candlestick charts or toggling between different chart views, keeping the user's interface uncluttered.
3. Selective Highlighting Based on Agreement: Marks traditional candles only when there's a concurrence between the HA candle's trend (bullish or bearish) and the traditional candle's trend. This feature ensures that only the most relevant signals are highlighted for the trader's attention.
Operational Mechanism: The script identifies HA candles with open equal to high (for flat tops) and open equal to low (for flat bottoms), which typically indicate strong trend movements. By marking these on the regular price chart, it provides immediate visual cues about trend strength and direction without needing to switch between HA and traditional candlestick views.
This tool is particularly useful for traders looking for a clean and efficient way to incorporate the insights of Heikin-Ashi candles into their technical analysis without the visual complexity of full HA candlestick overlays.
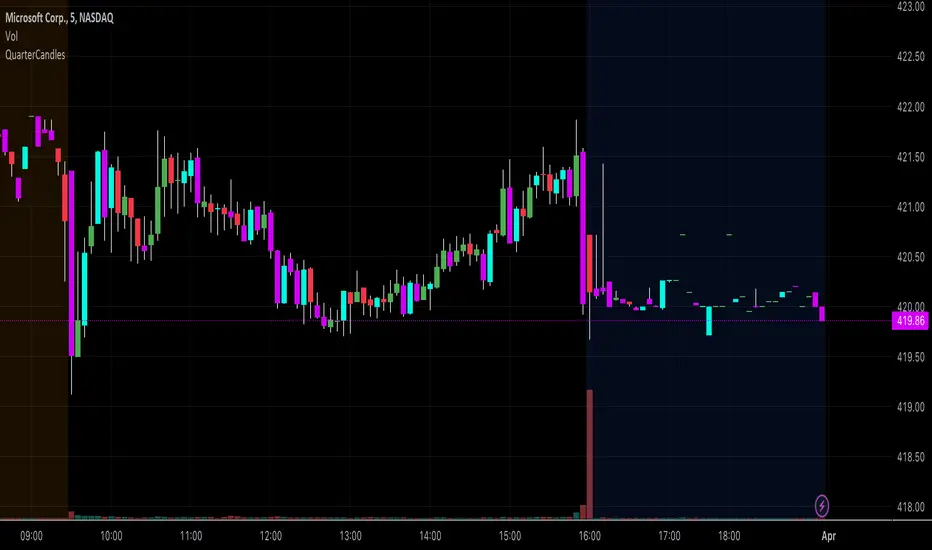
QuarterCandlesChanges candle color when close is within the top 25% or bottom 25% of candle range (High - Low) on the last candle update.
Due to limitations of barcolor command, I'd suggest that you turn OFF the candle borders (chart settings--> right click on chart --> settings -->symbol and uncheck the border option) to ensure that the bar color is easily identifiable.
HTF FVG and Wick Fill trackingImbalances in the charts are some of the clearest and most traded price areas. Two of the best and most used are fair value gaps FVGs and large candle wicks. In both of these price appears to move in such a way that most are left behind having 'missed' the move. But in reality price will often come back to these price points to re-balance and absorb the liquidity that was left behind.
This indicator takes these areas and makes viewing and tracking them clearer than ever. It does this, by first allowing the user to overlay a higher timeframe candle on the current chart. This in itself provides an in depth look at a higher timeframe candle both as it forms and in its final form.
Next the indicator identifies either the FVG or large wicks, on the chosen higher timeframe, all while the chart remains on a lower timeframe. As seen here the fair value gaps are clearly highlighted, taken from a 4 hour timeframe, while the actual chart is on 15 minutes. This allows the user even greater accuracy in identifying their key trading areas.
Utilizing the indicators unique feature, these areas can optionally be extended forward to the current timeframe and 'filled' in realtime. Areas that are filled to the users defined level, will be removed from the chart.
With supplementary settings for how much history to show, how large of a wick should be highlighted and complete control over the colour scheme, users will be able to track and understand the filling of imbalances like never before.

QTE Scalper ModifiedA modified version of the QTE scalper indicator. Produces a buy/sell signal based on a 2 candle pattern. For long signals it produces a signal when the high and low of the second candle are below the high and low of the first candle and both candles close above the 10 period EMA. The reverse is true for short signals.
Added functionality so that signals will trigger an alert: Add the indicator to the chart on the instrument and timeframe you wish to use it on. Add an alert and in the 'condition' section choose the indicator and set the trigger as 'once per bar close'. You will have to set individual alerts for both long and short signals and if you change the time period on the chart.

Candle Close TrendFirst of all, a huge credit to Wade for all the help with this indicator. An absolute Legend!
The idea behind this indicator is to identify a potential trend with simply the close of candles.
If a candle closes above the previous candle High, the trend would be "bullish" and remain bullish until there is a candle that closes below the previous candle Low. The opposite is true for a "bearish" trend.
As always, this is NOT intended to be used by itself, but with other TA.
For cleanest results, I find it best to use with the candle borders turned off in the chart settings but that is just my preference.
Works on all timeframes.

Bollinger Band Wick and SRSI Signals [MW]Introduction
This indicator uses a novel combination of Bollinger Bands, candle wicks crossing the upper and lower Bollinger Bands and baseline, and combines them with the Stochastic SRSI oscillator to provide early BUY and SELL signals in uptrends, downtrends, and in ranging price conditions.
How it’s unique
People generally understand Bollinger Bands and Keltner Channels. Buy at the bottom band, sell at the top band. However, because the bands themselves are not static, impulsive moves can render them useless. People also generally understand wicks. Candles with large wicks can represent a change in pattern, or volatile price movement. Combining those two to determine if price is reaching a pivot point is relatively novel. When Stochastic RSI (SRSI) filtering is also added, it becomes a genuinely unique combination that can be used to determine trade entries and exits.
What’s the benefit
The benefit of the indicator is that it can help potentially identify pivots WHEN THEY HAPPEN, and with potentially minimal retracement, depending on the trader’s time window. Many indicators wait for a trend to be established, or wait for a breakout to occur, or have to wait for some form of confirmation. In the interpretation used by this indicator, bands, wicks, and SRSI cycles provide both the signal and confirmation.
It takes into account 3 elements:
Price approaching the upper or lower band or the baseline - MEANING: Price is becoming extended based on calculations that use the candle trading range.
A candle wick of a defined proportion (e.g. wick is 1/2 the size of a full candle OR candle body) crosses a band or baseline, but the body does not cross the band or baseline - MEANING: Buyers and sellers are both very active.
The Stochastic RSI reading is above 80 for SELL signals and below 20 for BUY signals - MEANING: Additional confirmation that price is becoming extended based on the current cyclic price pattern.
How to Use
SIGNALS
Buy Signals - Green(ish):
B Signal - Potential pivot up from the lower band when using the preferred multiplier
B1 Signal - Potential pivot up from baseline
Sell Signals - Red(ish):
S Signal - Potential pivot down from the upper band when using the preferred multiplier
S1 Signal - Potential pivot down from the baseline
DISCUSSION
During an uptrend or downtrend, signals from the baseline can help traders identify areas where they may enter the trending move with the least amount of drawdown. In both cases, entry points can occur with baseline signals in the direction of the trend.
For example, in an uptrend (when the price is forming higher highs and higher lows, or when the baseline is rising), price tends to oscillate between the upper band and baseline. In this case, the baseline BUY signal (B3) can show an entry point.
In a downtrend (when the price is forming lower highs and lower lows, or when the baseline is falling), price tends to oscillate between the baseline and the lower band. In this case, the baseline SELL signal (S3) can show an entry point.
During consolidation, when price is ranging, price tends to oscillate between the upper and lower bands, while crossing through the baseline unperturbed. Here, entry points can occur at the upper and lower bands.
When all conditions are met at the lower band during consolidation, a BUY signal (B), can occur. This signal may also occur prior to a break out of consolidation to the upside.
When all conditions are met at the upper band during consolidation, a SELL signal (S), can occur. This signal may also occur prior to a break out of consolidation to the downside.
Additional, B1 and S1 signals can be displayed that use the baseline as the pivot level.
Settings
SIGNALS
Show Bollinger Band Signals (Default: True): Allows signal labels to be shown.
Hide Baseline Signals (Default: False): Baseline signals are on by default. This will turn them off.
Show Wick Signals (Defau
lt: True): Displays signals when wicking occurs.
BOLLINGER BAND SETTINGS
Period length for Bollinger Band Basis (Default: 21): Length of the Bollinger Band (BB) moving average basis line.
Basis MA Type (Default: SMA): The moving average type for the BB Basis line.
Source (Default: “close”): The source of time series data.
Standard Deviation Multiplier (Default: 2.5: The deviation multiplier used to calculate the band distance from the basis line.
WICK SETTINGS FOR BOLLINGER BANDS
Wick Ratio for Bands (Default: 0.3): The ratio of wick size to total candle size for use at upper and lower bands.
Wick Ratio for Baseline (Default: 0.3): The ratio of wick size to total candle size for use at baseline.
WICK SETTINGS FOR CANDLE SIGNALS
Upper Wick Threshold (Default: 50): The percent of upper wick compared to the full candle size or candle body size.
Lower Wick Threshold (Default: 50): The percent of lower wick compared to the full candle size or candle body size.
Use Candle Body (Default: false): Toggles the use of the full candle size versus the candle body size when calculating the wick signal.
VISUAL PREFERENCES
Fill Bands (Default: true): Use a background color inside the Bollinger Bands.
Show Signals (Default: true): Toggle the Bollinger Band upper band, lower band, and baseline signals.
Show Bollinger Bands (Default: true): Show the Bollinger Bands.
STOCHASTIC SETTINGS
Use Stochastic RSI Filtering (Default: False): This will only trigger some SELL signals when the stochastic RSI is above 80, and BUY signals when below 20.
K (Default: 3): The smoothing level for the Stochastic RSI.
RSI Length (Default: 14): The period length for the RSI calculation.
Stochastic Length (Default: 8): The period length over which the stochastic calculation is performed.
Calculations
Bollinger Bands are a technical analysis tool that are used to measure market volatility and identify overbought or oversold conditions in the trading of financial instruments, such as stocks, bonds, commodities, and currencies. Bollinger Bands consist of three lines plotted on a price chart:
Middle Band, Basis, or Baseline: This is typically a simple moving average (SMA) of the closing prices over a certain period. It represents the intermediate-term trend of the asset's price.
Upper Band: This is calculated by adding a certain number of standard deviations to the middle band (SMA). The upper band adjusts itself with the increase in volatility.
Lower Band: This is calculated by subtracting the same number of standard deviations from the middle band (SMA). Like the upper band, the lower band adjusts to changes in volatility.
The candle wick signals occur if the wick is at the specified ratio compared to either the entire candle or the candle body. The upper band, lower band, and baseline signals happen if the wick is the specified ratio of the total candle size. For the major signals for upper and lower bands, these occur when the wick extends outside of the bands while closing a candle inside of the bands. For the baseline signals, they occur if a wick crosses a baseline but closes on the other side.
Other Usage Notes and Limitations
To understand future price movement, this indicator assumes that 3 things must be known:
Evidence of a change of market structure. This can be demonstrated by increased volatility, consolidation, volume spikes (which can be tracked with the MW Volume Impulse Indicator) or, in the case of this indicator, candle wicks.
The potential cause of the change. It could be a VWAP line (which can be tracked with the Multi VWAP , and Multi VWAP from Gaps indicators), an event, an important support or resistance level, a key moving average, or many other things. This indicator assumes the ATR bands can be a cause.
The current position in the price cycle. Oscillators like the RSI, and MACD, are typical measures of price oscillation (other oscillators like the Price and Volume Stochastic Divergence indicator can also be useful). This indicator uses the Stochastic RSI oscillator to determine overbought and oversold conditions.
When evidence of the change appears, and the potential cause of the change is identified, and the price oscillation is at a favorable position for the desired trading direction, this indicator will generate a signal.
ATR Bands (or Keltner Channels) are used to determine when price might “revert to the mean”. Crossing, or being near the upper or lower band, can indicate an overbought or oversold condition, which could lead to a price reversal. By tracking the behavior of candle wicks during these events, we can see how active the battle is between buyers and sellers.
If the top of a wick is large, it may indicate that sellers are aggressively attempting to bring the price down. Conversely, if the bottom wick is large, it can indicate that buyers are actively trying to counter the price action caused by selling pressure.
When this wicking action occurs at times when price is not near the upper band, lower band, or baseline, it could indicate the presence of an important level. That could mean a nearby VWAP line, a supply or demand zone, a round price number, or a number of other factors. In any case, this wick may be the first indication of a price reversal.
Shorter baseline periods may be better for short period trading like scalping or day trading, while longer period baselines can show signals that are better suited to swing trading, or longer term investing.
It's important for traders to be aware of the limitations of any indicator and to use them as part of a broader, well-rounded trading strategy that includes risk management, fundamental analysis, and other tools that can help with reducing false signals, determining trend direction, and providing additional confirmation for a trade decision. Diversifying strategies and not relying solely on one type of indicator or analysis can help mitigate some of these risks.
The TradingView platform allows a maximum of 500 labels per chart. This means that if your settings allow for a lot of signals, labels for earlier ones may not appear if the total number of labels exceeds 500 for the chart.

Morning & Evening Star [TradingFinder] Stock Indices Gap Candle🔵 Introduction
In "technical analysis", there are certain reversal patterns that alert us to a potential reversal of a stock's previous trajectory.
Two significant patterns in this regard are the "Morning Star" pattern and the "Evening Star" pattern, which are formed by a combination of three different candlesticks and are considered as reversal patterns.
Here, we will examine how to identify these patterns and how to respond to them.
🟣 Morning Star Pattern
This pattern forms at the end of a downtrend and indicates the beginning of an uptrend.
The pattern consists of three candlesticks in the following order :
1.A large bearish candlestick
2.A candlestick with a short body
3.A bullish candlestick
With the formation of the morning star pattern, it is expected that the stock price will change direction and continue to rise. Therefore, in such situations, it is advisable to enter a long position and follow the uptrend.
Signs of the morning star pattern :
•The first sign of this pattern is the presence of a small-bodied candlestick at the end of the trend, accompanied by a gap from the previous candlestick (a bearish candlestick with a large body). Therefore, the bodies of the first and second candlesticks do not overlap.
•The second candlestick indicates market confusion and uncertainty. The color of the middle candlestick is not significant.
•The third candlestick must be positive and have a higher price than the previous candlestick (i.e., the small-bodied candlestick).
•The closing price of the third candlestick must be higher than half of the first candlestick.
🟣 Evening Star Pattern
This pattern forms at the end of an uptrend and indicates the beginning of a downtrend.
The pattern consists of three candlesticks in the following order :
1.A large bullish candlestick
2.A candlestick with a short body
3.A bearish candlestick
With the formation of the evening star pattern, it is expected that the stock price will change direction and continue to fall. Therefore, in such situations where this pattern is identified, it is advisable to refrain from entering a long position.
If the stock is traded in a two-way market, it is possible to profit by taking a short position after the formation of the evening star pattern.
Signs of the evening star pattern :
•The first sign of this pattern is the presence of a small-bodied candlestick at the end of the trend, accompanied by a gap from the previous candlestick (a bullish candlestick with a large body). Therefore, the bodies of the first and second candlesticks do not overlap.
•The second candlestick indicates market confusion and uncertainty. The color of the middle candlestick is not significant.
•The third candlestick must be negative and have a lower price than the previous candlestick (i.e., the small-bodied candlestick).
•The closing price of the third candlestick must be lower than half of the first candlestick.
🔵 How to Use
The "Filter" and "Market" features are available in the settings section, allowing you to customize the output of the indicator according to your needs.
With the "Filter" feature, you can filter the "Morning Star" and "Evening Star" patterns as "strong" or "weak." The difference between strong and weak patterns lies in their "Candle Body."
In strong patterns, the candle bodies account for more than 80% of the total candle range, while in weak patterns, the bodies comprise between 60% to 80% of the candle range.
If the "Filter" feature is set to "On," only strong patterns will be displayed. If it's set to "Off," all patterns will be displayed. By default, it's set to "Off."
The "Market" feature allows you to include "gaps" in your pattern identification calculations. You can choose between "Forex" and "Stock" modes. In the Forex pattern, calculations are performed without considering gaps since there are fewer gaps in the Forex market.
If gap calculations were to be part of the pattern identification conditions, only a very small number of patterns would be identified. However, in the "Stock" mode, gaps are considered as part of the identification conditions.
