Japanese CandlesSimple script to add standard Japanese candles in a new pane for use when using a non-standard chart (Ex: Heikin Ashi) that doesn't use true OHLC values in it's calculation so that you can still monitor true values and activity without having to take up the screen real estate that using a layout containing a whole new chart would require. This also makes horizontal sync of the main chart to the Japanese candle chart perfect at all times.
K線分析
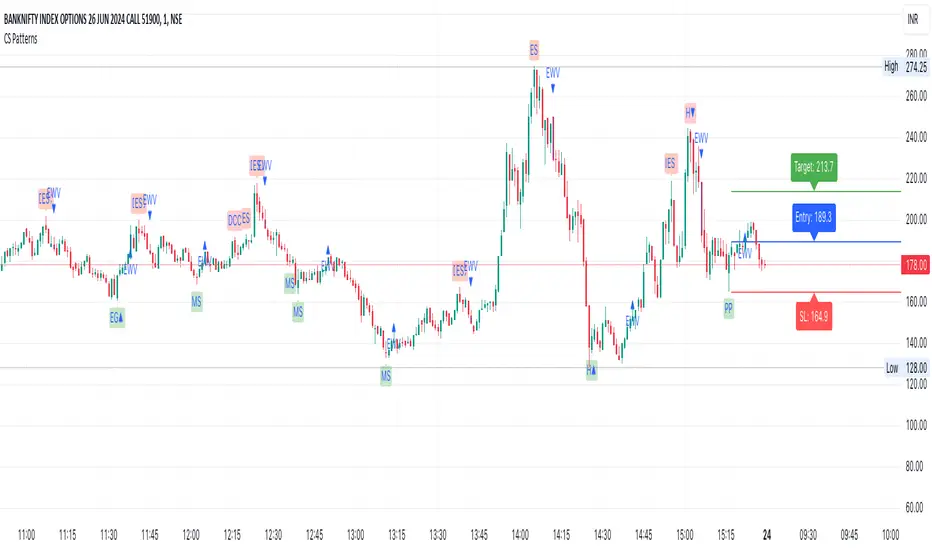
CS PatternsOverview
The CS Patterns indicator is designed to identify and highlight various candlestick patterns on a trading chart. Candlestick patterns are a crucial tool for traders as they help in predicting market movements and potential reversals. This indicator includes single, double, and triple candlestick patterns without revealing the source code, making it an ideal tool for traders who want to utilize advanced pattern recognition while keeping the script proprietary.
Candlestick Patterns Included
Single Candlestick Patterns
Bullish Hammer:
Found at the bottom of a downtrend.
Features a small body, long lower shadow, and little to no upper shadow.
Indicates potential reversal to an uptrend.
Bearish Hanging Man:
Found at the top of an uptrend.
Similar structure to the Bullish Hammer but indicates a potential reversal to a downtrend.
Bullish Inverted Hammer:
Found at the bottom of a downtrend.
Features a small body, long upper shadow, and little to no lower shadow.
Suggests a potential reversal to an uptrend.
Bearish Shooting Star:
Found at the top of an uptrend.
Indicates a potential reversal to a downtrend.
Dragonfly Doji:
Small or non-existent upper shadow and long lower shadow.
Indicates a potential reversal when found at the bottom of a trend.
Gravestone Doji:
Long upper shadow and small or non-existent lower shadow.
Indicates a potential reversal when found at the top of a trend.
Standard Doji:
Very small body, indicates indecision in the market.
Can signal reversals when found at the tops or bottoms of trends.
Long-Legged Doji:
Long upper and lower shadows with a small body.
Indicates a potential market reversal.
Double Candlestick Patterns
Bullish Engulfing:
A smaller bearish candle followed by a larger bullish candle that engulfs it.
Indicates a potential reversal to an uptrend.
Bearish Engulfing:
A smaller bullish candle followed by a larger bearish candle that engulfs it.
Indicates a potential reversal to a downtrend.
Bullish Harami:
A large bearish candle followed by a smaller bullish candle within its range.
Indicates a potential reversal to an uptrend.
Bearish Harami:
A large bullish candle followed by a smaller bearish candle within its range.
Indicates a potential reversal to a downtrend.
Bullish Piercing Line:
A bearish candle followed by a bullish candle that closes above the midpoint of the previous candle.
Indicates a potential reversal to an uptrend.
Bearish Dark Cloud Cover:
A bullish candle followed by a bearish candle that closes below the midpoint of the previous candle.
Indicates a potential reversal to a downtrend.
Bullish Inside Bar:
A smaller bullish or bearish candle completely within the range of the previous bearish candle.
Indicates a potential continuation or reversal to an uptrend.
Bearish Inside Bar:
A smaller bullish or bearish candle completely within the range of the previous bullish candle.
Indicates a potential continuation or reversal to a downtrend.
Triple Candlestick Patterns
Bullish Morning Star:
A bearish candle followed by a smaller-bodied candle (bullish or bearish), and then a larger bullish candle.
Indicates a potential reversal to an uptrend.
Bearish Evening Star:
A bullish candle followed by a smaller-bodied candle (bullish or bearish), and then a larger bearish candle.
Indicates a potential reversal to a downtrend.
How to Use?
Adding the Indicator:
Open TradingView and go to the Pine Script Editor.
Copy and paste the provided code into a new script.
Save and add the script to your chart.
Interpreting the Signals:
The indicator will highlight the patterns on the chart with specific labels.
Use these visual cues to make informed trading decisions based on potential reversals or continuations indicated by the patterns.
Customizing the Settings:
The indicator allows for customization of various settings through input options.
Adjust these settings according to your trading strategy and preferences.
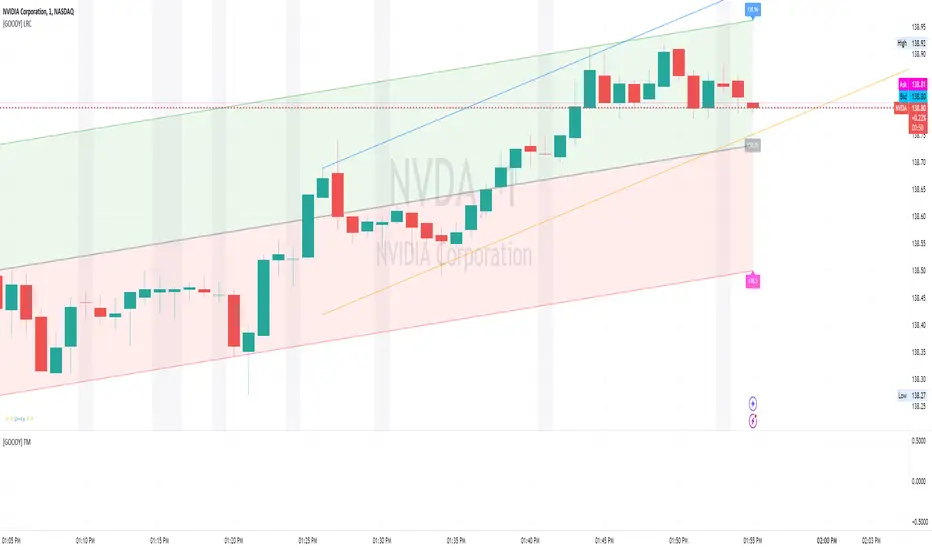
Linear Regression Channel [GOODY]Linear Regression Channel
The Linear Regression Channel indicator is a versatile tool for traders, providing valuable insights into price trends and potential reversal points. It plots two linear regression channels on the chart, helping you visualize price dynamics and make informed trading decisions.
Indicator Features and Settings
General Settings:
• Source: The price source used for channel calculations. Typically, the close price is used.
1st Channel Settings:
• Length: The number of bars used to calculate the linear regression channel. Increasing this value widens the channel and makes it less responsive to recent price changes.
• Upper Deviation Multiplier: Multiplier for the upper deviation from the regression line. Higher values widen the upper boundary.
• Lower Deviation Multiplier: Multiplier for the lower deviation from the regression line. Higher values widen the lower boundary.
• Show Channel Lines: Toggle to show or hide the channel lines, useful for visualizing channel boundaries.
• Show Channel Background: Toggle to show or hide the background color between the channel lines, highlighting the area covered by the channel.
• Show Labels: Toggle to show or hide price level labels for the channel lines, helping to identify exact price levels at the boundaries.
• Upper Label Color: Color for the upper price level label.
• Lower Label Color: Color for the lower price level label.
• Label Offset: Offset for the price level labels, adjusting them horizontally.
1st Channel Display Settings:
• Extend Lines Left: Extend the regression channel lines to the left of the chart, visualizing historical performance.
• Extend Lines Right: Extend the regression channel lines to the right of the chart, anticipating future price movements.
1st Channel Style Settings:
• Upper 1st Channel Line Color: Color for the upper line of the first channel.
• Lower 1st Channel Line Color: Color for the lower line of the first channel.
• Upper Channel Color: Color for the upper channel area, filling the area between the upper channel line and the midline.
• Lower Channel Color: Color for the lower channel area, filling the area between the lower channel line and the midline.
• Baseline Color (DownTrend): Color of the baseline during a downtrend.
• Baseline Color (Up Trend): Color of the baseline during an uptrend.
2nd Channel Settings:
• Length for 2nd Channel: The number of bars used to calculate the second linear regression channel.
• Upper Deviation Multiplier for 2nd Channel: Multiplier for the upper deviation from the regression line in the second channel.
• Lower Deviation Multiplier for 2nd Channel: Multiplier for the lower deviation from the regression line in the second channel.
2nd Channel Display Settings:
• Show 2nd Channel Lines: Toggle to show or hide the second channel lines, useful for visualizing channel boundaries.
• Show 2nd Channel Background: Toggle to show or hide the background color between the second channel lines, highlighting the area covered by the second channel.
2nd Channel Style Settings:
• Upper 2nd Channel Color: Color for the upper line of the second channel.
• Lower 2nd Channel Color: Color for the lower line of the second channel.
• Baseline Color for 2nd Channel (Up Trend): Color of the baseline during an uptrend in the second channel.
• Baseline Color for 2nd Channel (Down Trend): Color of the baseline during a downtrend in the second channel.
• Upper 2nd Channel Background Color: Background color for the upper part of the second channel, filling the area between the upper channel line and the midline.
• Lower 2nd Channel Background Color: Background color for the lower part of the second channel, filling the area between the lower channel line and the midline.
• Line Style for 2nd Channel: Choose the style of the second channel lines (Solid, Dotted, Dashed, Arrow, Round).
2nd Channel Line Settings:
• Extend 2nd Channel Lines Left: Extend the second channel lines to the left of the chart, visualizing historical performance.
• Extend 2nd Channel Lines Right: Extend the second channel lines to the right of the chart, anticipating future price movements.
Other Settings:
• Show VWAP Detection: Toggle to enable or disable VWAP detection. VWAP (Volume Weighted Average Price) indicates the average price of the asset, weighted by volume.
• Show Doji Detection: Toggle to enable or disable Doji candle detection. Doji candles have small bodies, indicating market indecision.
• Doji Size Threshold: Threshold to determine a Doji candle. A smaller value indicates a stricter Doji definition.
How to Read the Indicator for Trading
Channel Lines and Colors:
• The upper line of the 1st channel (green) and the 2nd channel (blue) represents the upper boundary based on linear regression and deviation multipliers.
• The lower line of the 1st channel (red) and the 2nd channel (orange) represents the lower boundary.
• The midline changes color dynamically based on the trend direction:
• Pink during a downtrend for the 1st channel.
• Blue during an uptrend for the 1st channel.
• Gray during a consolidation for both channels.
• The 2nd channel uses similar color logic.
Channel Background:
• The background color between the channel lines highlights the area covered by the channel:
• Green for the upper area and red for the lower area in the 1st channel.
• Blue and orange for the upper and lower areas in the 2nd channel, respectively.
Labels:
• Price level labels at the channel boundaries provide exact price levels, displayed at the upper and lower lines if enabled.
VWAP and Doji Detection:
• VWAP is plotted as circles on the chart, showing the volume-weighted average price.
• Doji candles are highlighted with a background color if detected, indicating potential market indecision.
Alerts:
• Alerts are triggered when the trend direction of the channels changes. For example:
• An alert notifies you if the 1st channel is in an uptrend while the 2nd channel is in a downtrend.
• An alert notifies you if the 1st channel is in a downtrend while the 2nd channel is in an uptrend.
Trading with the Indicator
• Trend Identification: Use the color and direction of the midline and baseline to identify the current trend. An uptrend is indicated by a blue midline, while a downtrend is indicated by a pink midline.
• Reversal Points: Monitor when the price approaches the upper or lower boundaries of the channels, as these can act as support or resistance levels.
• Volume Insights: Use the VWAP and liquidity levels to understand the true average price based on volume and identify significant areas of trading activity.
• Market Indecision: Watch for Doji candles, which can signal potential reversals or periods of consolidation.
Svopex Pin Bar DetectorThe Pin Bar Detector is a technical analysis tool designed to identify pin bar candlestick patterns on trading charts. A pin bar is characterized by a small candle body and a long shadow, indicating a significant rejection of prices that can signal potential reversals in the market.

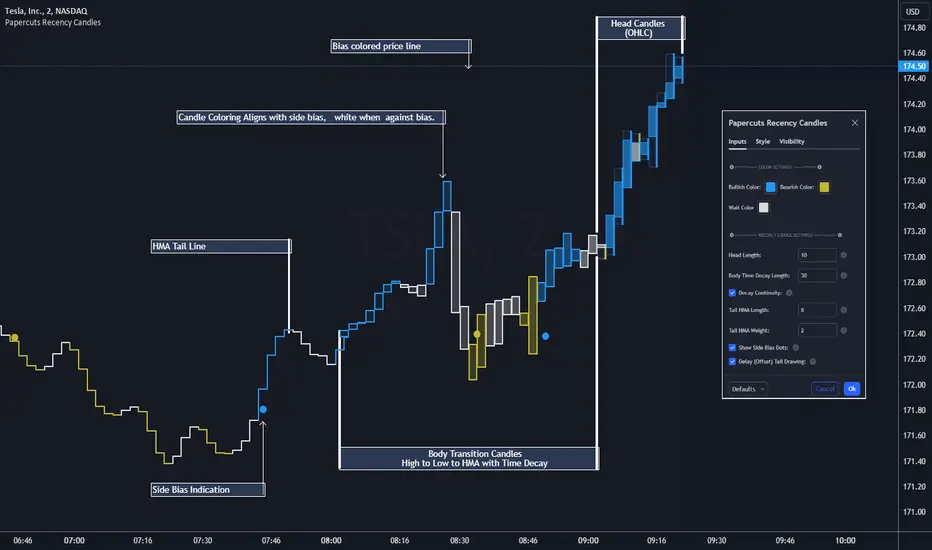
Papercuts Recency CandlesPapercuts Recency Candles
V0.8 by Joel Eckert @PapercutsTrading
***This is currently an experimental visual exploratory concept.***
*** Experimental tools should only be explored by fellow coders and experienced traders.***
DESCRIPTION:
As coders, how can we seamlessly transition between actual and smoothed price data sets as data ages?
This is a visual experiment to see if and how data can be smoothly transitioned from one value to another over a set number of candles. If we visualize a chart in 3 zones, a head, a body, and a tail we can start to understand how this could work. The head zone would represent the first data set of actual asset prices. The body zone would represent the transition period from the first to the to the second data set. Last, the tail zone would represent the second data set made of a Hull Moving Average of the asset.
CONCEPT:
It is conceived that data and position precision constantly shift as they decay or age, therefore making older price levels act more like price regions or zones vs exact price points. This is what I am calling Recency.
This indicator utilizes the concept of "Recency" to explore the possibility of a new style of candle. It aims to maintain accurately on recent prices action but loosen up accuracy on older price action. The very nature of this requires ALTERING HISTORICAL DATA within the body zone or transition candles to achieve the effect. It is similar to trying to merge a line chart type with a candle chart type.
This experiment of using recency for candles was to create candles that stay more accurate near current price but fade away into a simple line as they age out, resulting in a simplified view of the big picture which consists of older price action.
This experimental design theoretically will help you stay focused only on what is currently unfolding and to minimize distractions from older price nuances.
USAGE:
WHO:
This is not recommended for new traders or novices that are unfamiliar with standard tools. Standardized tools should always be used to get grounded and build a foundation.
Active traders who are familiar with trading comfortably should experiment with this to see if they find it interesting or usable.
Pine coders may find this concept interesting enough, and may adapt the idea to other elements of their own scripts if they find it interesting… I just ask they give credit where credit is due.
HOW:
The best way to visualize how this works is to do the following:
Load it on a chart.
Turn off Standard candles in Chart Setting of the current window. I actually just turn off the bodies and borders, and dim the old wicks as I like the way the old wicks look when left alone with these new candles.
Enable chart replay at a faster speed, like 3x, and play back the chart to watch the behavior of the candles.
You’ll be able to see how the head of the candle type preserves OHLC, and indicates direction but as the candle starts to age it progressively flowers into the HMA
While it plays back try adjusting settings to see how they affect behavior.
You can see the data average in real-time which often reveals how unstable actual price noise really is.
The head candle diagonals indicate the candle body direction.
SETTINGS:
Coloring: You can choose your own bullish or bearish colors to match your scheme.
Price Line: The price line is colored according to the trend and
Head Length: These candles are true to the source high and low. They remain slightly brighter than transition candles. We have a max of 50 to keep things responsive.
Time Decay Length: This is the amount of candles it takes to transition to the tail. Max is 300 to keep things responsive.
Decay Continuity: This forces transition candles to complete the HMA curve instead of creating gaps when conforming to it. The best way to visualize this feature is to run a 3x replay of an asset, and toggle the result on and off. On is preferred.
Tail HMA Length: This is the smoothing amount for the resulting HMA stepline that calculates every close, but has a delayed draw until after the transition candles. You can optionally turn off the delayed visibility to help with comprehension.
Tail HMA Weight: This is simply an option to make the tail thicker or thinner. This also adjusts the border on the head candles to help them stand out.
Show Side Bias Dots: Default true: Draws a dot when bias to one side changes to help keep you on the right side of trade. Side bias is simply the alignment of 3 moving averages in one direction.
IMPORTANT NOTES:
You'll have to turn off or dim the standard candles in your view "Chart Settings" to see this properly.
Be aware that since the candles are based on boxes and utilize the “recency concept”, which means their data decays and changes as it ages. This results in a cleaner chart overall, but exact highs and lows will be averaged out as the data decays, forming a Hull Moving Average stepline of your defined length once decay has finished.
SUMMARY OF HOW IT WORKS:
First it takes candle information and creates unique boxes that represent each candle based on the high and low. It utilizes boxes because standard candles once written, cannot be later altered or removed… which is a key element for this effect to work.
Next it creates a second box and line from open to close for the body of the Head candles. This indicates direction at a glance.
As candles age beyond the defined distance of the “Head” they enter the "Body" aka "Time Decay" zone. Here the accuracy of the high and low will be averaged down using an incremental factor of the HMA, defined by "Time Decay Length" amount of candles.
The resulting tail is an HMA of Tail HMA Length. This tail is always calculate at close, but is not drawn instantly. The draw is delayed so that there is not overlapping data, and this makes the effect look more elegant.
There are also two EMAs within the script that do nothing but help candle coloring and help provide a trade side bias. When both EMA's and the HMA align, a side bias is defined. Only when the side bias changes will a new dot is formed.
Head candles have been simplified from previous versions to be easier to read at a a glance.
Consecutive count backtester / Flowly Indicators- Overview
Consecutive counting is a simple method to mechanically define trending states to the upside and downside. Consecutive counts are calculated by taking reference price level (e.g. close 4 candles ago) and count closes above/below it up to a maximum count that resets the consecutive count back to 1. This tool provides the means to backtest each count by measuring % change in price after each count (e.g. % gain 2 candles after a given count).
Users can define reference source that starts the consecutive count (e.g. close 4 candles ago), maximum count where counter resets (e.g. after 9th count) and backtesting period (e.g. price change 2 candles after count).
Filters add extra conditions that must be met on the consecutive count to qualify as valid, which are also reflected on the backtest metrics. The counts can be refined using the following filters:
- RSI above/below X
- Price above/below/at moving average of choice
- Relative volume above/below X
Average gain corresponding to each count as they occur can be toggled off for less clutter. Average price change can also be visualized using candle color. Colors, gradient and table/label sizes are fully customizable.
- Practical guide
Example #1: Identify reversal potential
Consecutive counting is a simple yet effective method to for detecting reversals, for which 7-9 counts are traditionally used. Whether that holds true or not can now be put through a test with different variations of the method as well as using additional filters to improve the probability of a turn.
Example #2: Identify trend following potential
Consecutive counts can also have utility value for trend following. When historical short term change is to the downside, expect downside, when to the upside, expect upside.

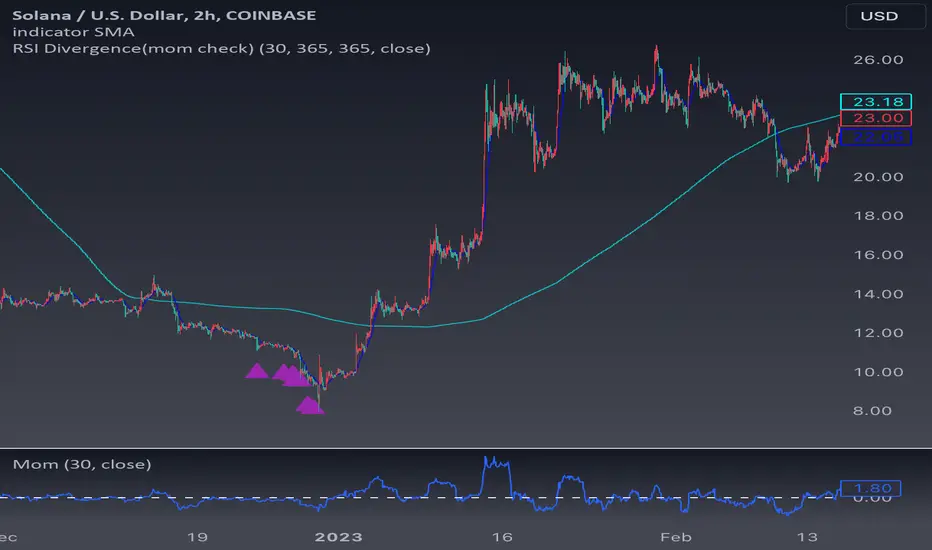
RSI divergence(mom check)The core of this indicator is obviously RSI divergence. But there are some tips I would like to explain and suggest.
First of all, although the basic principle of this indicator is simple: simply comparing the price and RSI value within a given time period. To be more specific, if the price now is lowest among last 300 candlesticks but its RSI value is not, then the candlesticks will be marked. However, sometimes it is not accurate. Here are some examples:
This is bitcoin 2h chart from COINBASE. It is true that we can capture most of corrections and make a fortune during a bull market. However, the market is not always consist of bull market:
This is also bitcoin 2h chart from COINBASE. We can imagine how much money we would lose if we buy every time solely according to the RSI divergence signals during a bear market. So, how to solve this question? As a bullish indicator, it's normal to have distortions in a bear market, but I still hope to improve its win rate and make it more reliable even though when people are trading during a bear market. So we need to add some filtering conditions to screen out all the divergence signals.
The first indicator came in my mind is: Momentum. Here is the momentum code with its zero axis:
//@version=5
indicator(title="Momentum", shorttitle="Mom", timeframe="", timeframe_gaps=true)
//input variables
len = input.int(30, minval=1, title="Length")
src = input(close, title="Source")
//calculate momentum
mom = src - src
//draw momentum chart
plot(mom, color=#2962FF, title="MOM")
//draw 0 axis
hline(0, "Zero Line", color=color.white)
One thing we should notice is that ’30’ is the time period of the momentum, you can change this to everything you want according to which assets you are trading. For example, in a long-run bullish stock market or gold market, you can set ’60’. But when it comes to futures or crypto, maybe 30 is a better choice.
Now, I use momentum as a condition to distinguish a bearish trend: if the all momentum value of past 100 candlesticks of my RSI divergence signals are minus, which means these divergence signals are in a bearish trend, in this case, I market them as purple signal2. Attached are some examples of BTC, ETH and SOL charts. We can see if we trade according to green signal1s. We gonna have to cut our losses multiple times, and for leveraged traders, it could even mean facing liquidation. However, signal2 has helped filter most of signal1s. So in most conditions, I believe the appearance of signal2 represents the end of bearish trends.
So far, we have created an overall frame. And I have set ‘alertcondition’ functions so that we can use this indicator to set alerts.
Here are some tips I would like to suggest based on my personal experiences:
1. Set stop losses and follow them strictly;
2. Adjust the time period according to different assets. For instance, 4h chart is good for bitcoin and most altcoin. But when it comes to stock market, 12h or 1d may be a better choice. You need to find the best suitable time period by yourself;
3. In a bear market, please be especially cautious with the green Signal 1; they are great for following uptrends but are not suitable for bottom-fishing. I recommend waiting for the purple Signal 2 to appear before placing trust again in the green Signal 1.
4. To be continued….
Multi Time Period Box Analysis v2 [ HDBhagat ]The "Multi Time Period Chart" indicator in Pine Script is designed to overlay multiple sets of boxes on the chart, each representing price movements on different timeframes. It allows traders to visually compare price action across various timeframes simultaneously. The indicator offers flexibility by allowing users to choose between automatic mode (where timeframes are selected based on predefined rules) or manually defining custom timeframes.
Key Features:
Multi-Timeframe Analysis: The indicator enables traders to analyze price action across multiple timeframes concurrently, facilitating a comprehensive view of market dynamics.
User-Defined Timeframes: Traders can customize the timeframes for each set of boxes according to their preferences. They have the option to choose between automatic mode, which selects timeframes based on predefined rules, or manually inputting custom timeframes.
Visual Representation: Price movements are visually represented by boxes drawn on the chart, with each box indicating the price range (from high to low) within a specific timeframe. The color of the boxes indicates whether the closing price is higher or lower than the opening price.
Dynamic Updates: The indicator dynamically updates the boxes as new price data becomes available. It ensures that the visualization remains accurate and reflects the most recent market conditions.
Customizable Styling: Traders can customize the appearance of the boxes, including color, border style, and text display. This allows for personalization to suit individual preferences and improve readability.
Efficient Resource Management: The script efficiently manages computing resources by only processing data when necessary, avoiding unnecessary calculations and reducing runtime errors.
Compatibility: The script is compatible with the Pine Script language on the TradingView platform, making it accessible to a wide range of traders who use this platform for technical analysis.
Overall, the "Multi Time Period Chart" indicator provides traders with a powerful tool for conducting multi-timeframe analysis, aiding in trend identification, pattern recognition, and decision-making in the financial markets.

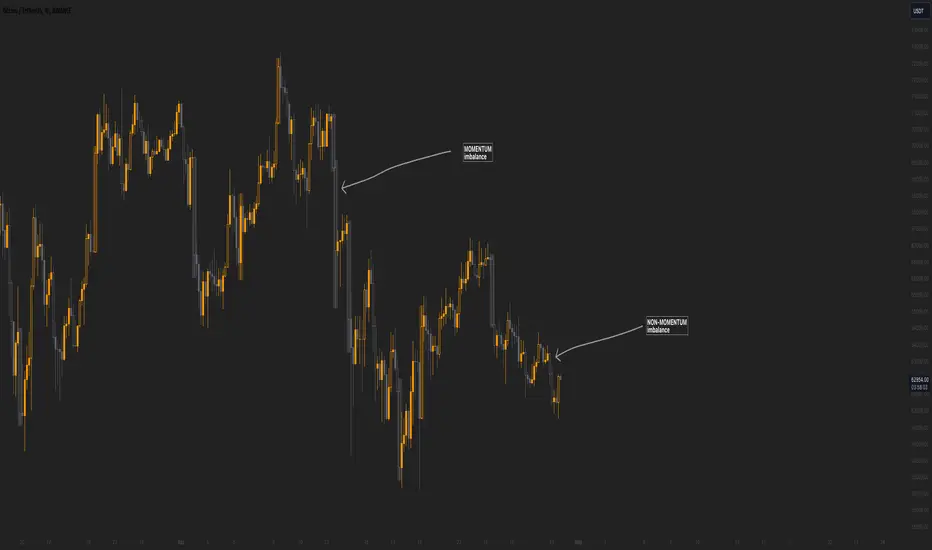
Momentum imbalance (internal liquidity) by CUWe have developed a sophisticated indicator to detect momentum, imbalance, and internal liquidity within financial markets. Designed to leverage real-time data analysis, this tool aims to assist traders in making more informed decisions.
The momentum component of the indicator calculates the rate at which prices move. By measuring price changes over a specific period, the indicator can show whether an asset is likely to continue rising or falling. This helps traders identify when a trend is gaining strength or beginning to wane.
Market imbalance is analyzed by observing the disparity in buy and sell orders. Our indicator identifies significant deviations between supply and demand, which can indicate potential turning points or accelerations in market movement. This aspect is crucial for understanding the underlying forces that influence price changes.
Regarding internal liquidity, our indicator measures the market depth and the availability of liquid assets. This component is essential for assessing how easily assets can be bought or sold without significantly impacting the price. High internal liquidity indicates a healthy market where transactions are executed quickly and efficiently, while low liquidity can lead to increased volatility and potential price manipulation.
By integrating these three components, our indicator provides a holistic view of market dynamics, enabling traders to operate more strategically and with greater confidence.
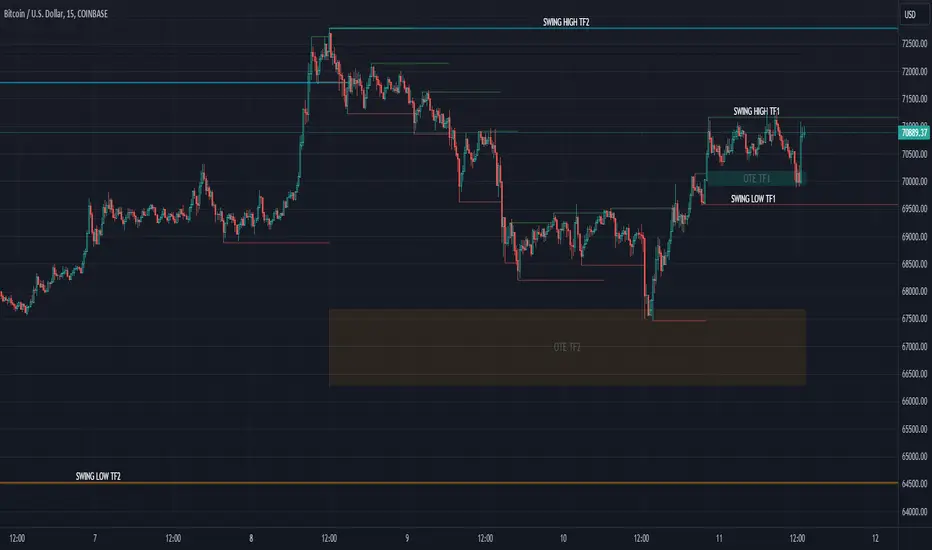
RN3 Ichimoku PVSRA Scalper IndicatorThis indicator will place long (buy) and short (sell) orders using the Ichimoku Tenkan Kijun Cross strategy. When in a trade position, it will create take profit levels using Fibonacci against the highest high or lowest low of the past 2 days. You can define your own level and set your own stop loss just in case.
Senkou Span will act as your main bias.
if the price under the cloud so the bias will be bearish. You may want to focus on selling(short) on this direction.
if the price above the cloud so bias will be bullish, You may want to focus on buying(long) on this direction.
This is for scalping, but it possible to do swing.
Suggested Symbols : Forex / Crypto / Commodities
Timeframe for Entry : Less than 1D TF
Additional controls include:
PVSRA Candle
M Pivot
VWAP
B1: Yesterday High B2: Yesterday Low
C1: Today High C2: Today Low.
Here's the way you can utilize the script.
First look at the Yesterday high, and Yesteday Low.
You need to consider that would be the symbols can travel into.
If today high has broke yesteray high, there's possibly the price will can keep higher and will create new high. Likewise if today lowest broke yesterday low, there's possibly the price can keep dropping and create new low.
VWAP : You can use this to determine if the price is fair or not, the more it's trading away away the vwap this will determine if it's overbought, or oversold.
PVSRA :
using 10 Periods, it's determine the volume.
Blue(Bullish) and Pink(Bearish) the 150% more Volume from previous bar.
Green(Bullish) and Red(Bearish) the 200% more Volume from previous bar.

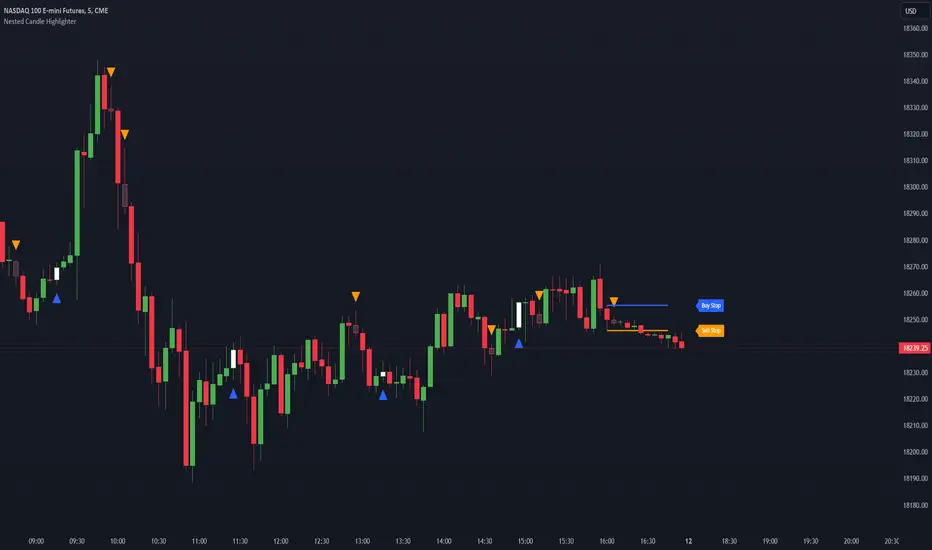
Nested Candle Highlighter @shrilssThe Nested Candle Highlighter identifies when the current candle's body is completely enclosed by the previous candle's wick zones. It examines the upper wick zone, from the previous high to the open or close, and the lower wick zone, from the low up to the open or close. This focused analysis can signal consolidation and potential shifts in momentum, offering an insightful addition to your trading analysis.
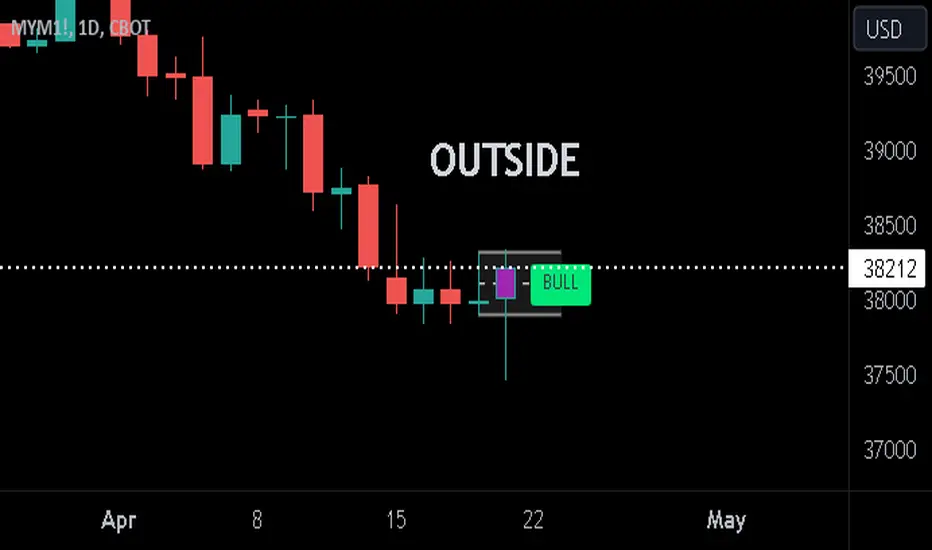
Previous Candle + Inside/OutsideThe script uses the previous candle of the current timeframe to assess the state of the current candle.
1. Previous candle high/low and midpoint are displayed
2. Highlights current bar if INSIDE previous candle
3. Highlights current bar if POTENTIAL OUTSIDE bar. This condition uses the logic that if the previous high/low has been swept and price then reaches previous bar 50%, then an OUTSIDE bar is possible.
4. If current candle breaks previous high/low, a label is added to identify.
5. If above condition is true and current candle color is opposite of previous, then label is highlighted to show possible bull/bear condition.
6. If current candle live price is below previous midpoint, a BEAR label is shown
7. If current candle live price is above previous midpoint, a BULL label is shown
I personally use the indicator on Daily/Weekly/Monthly charts to help with my overall market assessment. However users may find their own use for the indicator...or modify it to their own preferences.
As ever, the indicator should only be used with live trading accounts after thorough backtesting using a large data range.
FOMO Alert (Miu)This indicator won't plot anything to the chart.
Please follow steps below to set your alarms based on price range variation:
1) Add indicator to the chart
2) Go to settings
3) Choose timeframe which will be used to calculate bars
4) Choose how many bars which will be used to calculate max and min range
5) Choose max and min range variation (%) to trigger alerts
5) Choose up to 6 different symbols to get alert notification
6) Once all is set go back to the chart and click on 3 dots to set alert in this indicator, rename your alert and confirm
7) You can remove indicator after alert is set and it'll keep working as expected
What does this indicator do?
This indicator will generate alerts based on following conditions:
- If min and max prices reach the range (%) from amount of bars on timeframe set for any symbol checked it will trigger an alert.
- If next set of bars reaches higher range than before it will trigger an alert with new data
- If next set of bars doesn't reach higher range than before it will not trigger alerts, even if they are above the range set (this is to prevent the alert to keep triggering with high frequency)
Once condition is met it will send an alert with the following information:
- Symbol name (e.g: BTC, ETH, LTC)
- Range achieved (e.g: 3,03%)
- Current symbol price and current bar direction (e.g: 63,477.1 ▲)
This script will request lowest and highest prices through request.security() built-in function from all different symbols within the range set. It also requests symbols' price (close) and amount of digits (mintick) for each symbol to send alerts with correct value.
This script was developed with main purpose to send alerts when there are strong price movements and I decided to share with community so anyone can set different parameters for different purposes.
Feel free to give feedbacks on comments section below.
Enjoy!

Master Candle Breakout Trading Strategy - Omkar BanneDiscover the Power of Master Candle Trading with Our Indicator! 📈
What does it do?
This indicator scans price action to identify 'Master Candle' formations, a powerful signal indicating potential trend continuations.
A Master Candle occurs when the high and low of the next 4 candles are within the range of the previous candle, suggesting a period of consolidation followed by a breakout.
How can it be used?
Swing Trading
Capture significant price movements by entering trades at the breakout of Master Candle formations.
It can also be used for Intraday trading.
Trend Reversals
Identify potential trend reversals early by recognizing Master Candle patterns.
Entry
The indicator displays the entry price depending on the high of the master candle.
Risk Management
Set stop-loss levels and take-profit targets based on the size of the Master Candle, enhancing risk management.
Customizable Threshold
Adjust tolerance levels for high and low prices to suit your trading style.
Background
It highlights the master candle using a different background colour.
Box
It draws a box around the pattern formation.
Theme Options
Choose between light and dark themes for optimal visibility.
Whether you're a beginner or an experienced trader, our Master Candle Trading Strategy Indicator can enhance your trading arsenal and improve your profitability.

BINANCE-BYBIT Cross Chart: Spot-Perpetual CorrelationName: "Binance-Bybit Cross Chart: Spot-Perpetual Correlation"
Category: Scalping, Trend Analysis
Timeframe: 1M, 5M, 30M, 1D (depending on the specific technique)
Technical analysis: This indicator facilitates a comparison between the price movements shown on the Binance spot chart and the Bybit perpetual chart, with the aim of discerning the correlation between the two charts and identifying the dominant market trends. It automatically generates the corresponding chart based on the ticker selected in the primary chart. When a Binance pair is selected in the main chart, the indicator replicates the Bybit perpetual chart for the same pair and timeframe, and vice versa, selecting the Bybit perpetual chart as the primary chart generates the Binance spot chart.
Suggested use: You can utilize this tool to conduct altcoin trading on Binance or Bybit, facilitating the comparison of price actions and real-time monitoring of trigger point sensitivity across both exchanges. We recommend prioritizing the Binance Spot chart in the main panel due to its typically longer historical data availability compared to Bybit.
The primary objective is to efficiently and automatically manage the following three aspects:
- Data history analysis for higher timeframes, leveraging the extensive historical data of the Binance spot market. Variations in indicators such as slow moving averages may arise due to differences in historical data between exchanges.
- Assessment of coin liquidity on both exchanges by observing candlestick consistency on smaller timeframes or the absence of gaps. In the crypto market, clean charts devoid of gaps indicate dominance and offer enhanced reliability.
- Identification of precise trigger point levels, including daily, previous day, or previous week highs and lows, which serve as sensitive areas for breakout or reversal operations.
All-Time High (ATH) and All-Time Low (ATL) levels may vary significantly across exchanges due to disparities in historical data series.
This tool empowers traders to make informed decisions by leveraging historical data, liquidity insights, and precise trigger point identification across Binance Spot and Bybit Perpetual market.
Configuration:
EMA length:
- EMA 1: Default 5, user configurable
- EMA 2: Default 10, user configurable
- EMA 3: Default 60, user configurable
- EMA 4: Default 223, user configurable
- Additional Average: Optional display of an additional average, such as a 20-period average.
Chart Elements:
- Session separator: Indicates the beginning of the current session (in blue)
- Background: Indicates an uptrend (60 > 223) with a green background and a downtrend (60 < 223) with a red background.
Instruments:
- EMA Daily: Shows daily averages on an intraday timeframe.
- EMA levels 1h - 30m: Shows the levels of the 1g-30m EMAs.
- EMA Levels Highest TF: Provides the option to select additional EMA levels from the major timeframes, customizable via the drop-down menu.
- "Hammer Detector: Marks hammers with a green triangle and inverted hammers with a red triangle on the chart
- "Azzeramento" signal on TF > 30m: Indicates a small candlestick on the EMA after a dump.
- "No Fomo" signal on TF < 30m: Indicates a hyperextended movement.
Trigger Points:
- Today's highs and lows: Shows the opening price of the day's candlestick, along with the day's highs and lows (high in purple, low in red, open in green).
- Yesterday's highs and lows: Displays the opening price of the daily candlestick, along with the previous day's highs and lows (high in yellow, low in red).
You can customize the colors in "Settings" > "Style".
It is best used with the Scalping The Bull indicator on the main panel.
Credits:
@tumiza999: for tests and suggestions.
Thanks for your attention, happy to support the TradingView community.

SMC Market Structure (MTF)Introducing the Smart Money Concept Market Structure analysis indicator, a sophisticated tool designed to display the true market structure, in multiple timeframes. Inspired by Lewis Kelly's renowned strategy, this indicator offers a unique approach to defining market structure.
It's worth noting that the Smart Money Concept Market Structure analysis indicator employs Lewis Kelly's strategy for swing detection.
However, it differs from other scripts in the market that utilize alternative methods for swing detection.
Some of these alternative methods that are not used by this script (as it doesn't define market structure properly according to Lewis Kelly's rules):
- ignoring previous market swings. New swings are created inside the internal noise, as they don't need a close above or below previous swings.
- considering that a swing detection is a tops/bottoms with pivots (left, right) with HH/LL.
Any existing market structure script using any of the above will lead to a wrong Break of Structure or Change of character detection and may induce traders to wrongly take trades against the true trend (and lose their trades).
This is why none of the listed above is used here, and this distinction also offers traders a diverse range of options to suit their individual trading preferences and styles.
Here's the main principles of how it works that differentiate from other scripts:
- New Swings are detected only if the new candle closes above/below the previous swing.
- A pullback is detected after 3 (by default) candles going in the same direction, against the current trend. The pullback candles do not need to follow each other, but the count is reset when invalidated. The pullback invalidation strategy is not disclosed here.
Also, unlike most indicators out there, the Smart Money Concept Market Structure (MTF) is multi-timeframe, eliminating the need for traders to constantly switch between different timeframes or add additional indicators. This feature enhances efficiency and streamlines the analysis process, allowing traders to focus more on making informed decisions.
It's important to understand that this indicator is fundamentally based on price action and is not specifically designed to detect market manipulations. Therefore, it should be used in conjunction with your own analytical skills and expertise to derive optimal trading strategies.
While still in its development phase, the indicator may receive updates and new features in the future to further enhance its functionality and usability.
Some of these new features may also not be implemented by existing market structure scripts.
If you have any question or need for new features, please feel free to ask them.
Also, it is recommended to compare the results of this indicator and other existing ones to see which is the most suitable to your trading style.
In the meantime, Enjoy !
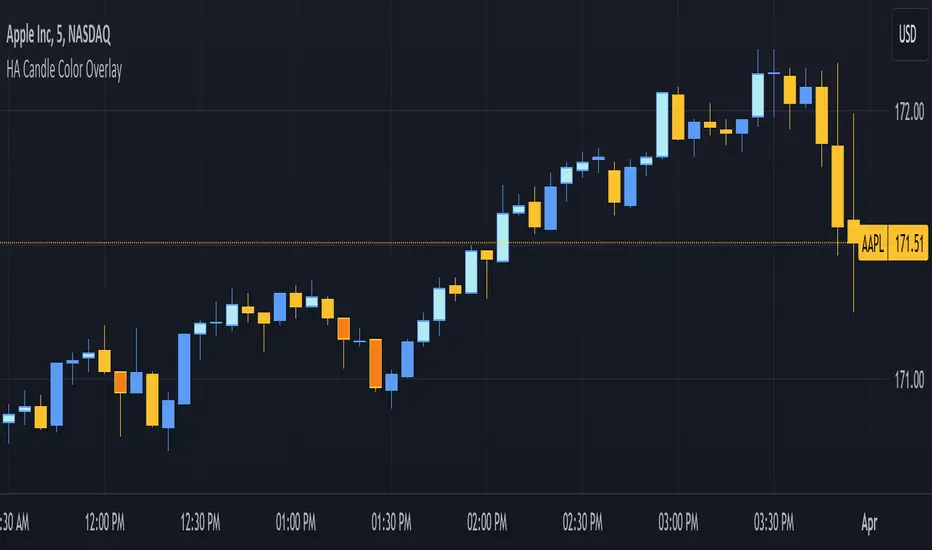
3. [Pufferman] - HA Candle Color OverlayThis indicator is designed for traders who utilize Heikin-Ashi (HA) candles to determine market trend direction and strength but prefer not to clutter their charts with multiple candlestick overlays or constantly switch between chart types. It aims to enhance chart readability by marking significant HA candles directly on the price chart, leveraging the unique characteristics of HA candles to signal trend direction and momentum.
Key Features:
1. Trend Identification through HA Candles: Automatically calculates Heikin-Ashi candles based on standard price data, highlighting significant HA candles that exhibit flat tops or bottoms. These characteristics are indicators of strong trend presence and direction. Highlights are in darker or lighter shade (darker - bearish or light - bullish colors) than the standard candles for easy read.
2. Cleaner Chart Presentation: Offers a streamlined alternative to overlaying HA candles on traditional candlestick charts or toggling between different chart views, keeping the user's interface uncluttered.
3. Selective Highlighting Based on Agreement: Marks traditional candles only when there's a concurrence between the HA candle's trend (bullish or bearish) and the traditional candle's trend. This feature ensures that only the most relevant signals are highlighted for the trader's attention.
Operational Mechanism: The script identifies HA candles with open equal to high (for flat tops) and open equal to low (for flat bottoms), which typically indicate strong trend movements. By marking these on the regular price chart, it provides immediate visual cues about trend strength and direction without needing to switch between HA and traditional candlestick views.
This tool is particularly useful for traders looking for a clean and efficient way to incorporate the insights of Heikin-Ashi candles into their technical analysis without the visual complexity of full HA candlestick overlays.
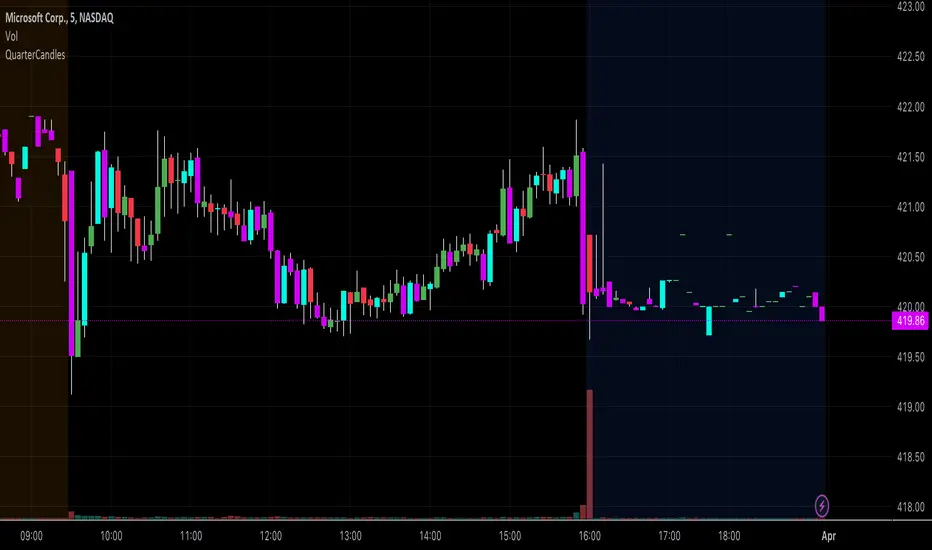
QuarterCandlesChanges candle color when close is within the top 25% or bottom 25% of candle range (High - Low) on the last candle update.
Due to limitations of barcolor command, I'd suggest that you turn OFF the candle borders (chart settings--> right click on chart --> settings -->symbol and uncheck the border option) to ensure that the bar color is easily identifiable.
Flow of Trade [Orderflowing]Flow of Trade | Supply & Demand Zones | Turtle Soup Reversal Pattern Detection (+)
Built using Pine Script V5.
Introduction
The Flow of Trade indicator is a trading tool designed to leverage the principles of Supply and Demand, along with automatic “Turtle Soup” reversal pattern detection.
This indicator is made for traders who aim to identify potential market reversal points, supported by multi-timeframe analysis for a more complete market overview.
Core Concepts and Innovation
Supply and Demand (S&D) Zones
At the heart of the Flow of Trade indicator is the concept of Supply & Demand, along with Market Imbalance, which is sound for identifying the Supply and Demand zones.
The Turtle Soup Reversal Pattern Detection
Named after the ICT-derived trading pattern, the Flow of Trade script tries to find and plot these "failed breakout" reversals based on the user input configuration.
Inputs
The Flow of Trade indicator offers customization, allowing traders to fit the tool to their specific analysis needs and trading style.
Zone Ratio: Determines the scale of imbalance required for a candle to be considered for a zone. A higher value indicates a need for a more significant imbalance, making zones less frequent but potentially more reliable.
Zone Extension: Specifies how far to the right of the latest bar the zones should extend, providing a visual projection of potential future support and resistance areas.
Display LTF Zones: Enables the visualization of zones from lower timeframes on the current chart, offering a multi-timeframe perspective on supply and demand areas.
Supply and Demand Zone Colors: Customize the colors for supply (red) and demand (blue) zones, including opacity for chart visibility.
Border Color: Adjust the border color to find a suitable view of the zones. Optionally disable the S&D colors with 0% opacity and only keep border colors for a border-only view.
Text Display Settings: Options to display high/low quotes information within zones.
Timeframe Options: Select which timeframes to include in the analysis, from shorter periods like 30M to longer ones like Daily (D) or Weekly (W), allowing for a complete view across different timeframes.
How It Works
Imbalance Calculation.
The indicator looks at consecutive candles to measure the magnitude of price movement and volume imbalances.
A significant imbalance between buying and selling pressure is what defines a potential supply or demand zone.
Supply Zones Identification.
A supply zone is flagged when there's imbalance favoring sellers, typically after a notable price drop. It looks for a consolidation phase where the price fails to achieve a higher high, suggesting an area where sellers might regain control.
Demand Zones Identification.
A demand zone is marked in the presence of a buyer-dominated imbalance, especially after a significant price rally.
The indicator seeks periods of consolidation where the price doesn't make a lower low, indicating potential buyer accumulation.
Multi-Timeframe Imbalance Analysis.
The indicator extends its imbalance analysis across multiple timeframes of identified zones.
This multi-layered approach allows traders to discern the strength and relevance of supply and demand zones within a broader multi-timeframe market context.
Turtle Soup Reversal Pattern Detection.
The Turtle Soup pattern detection is fitted into the imbalance analysis.
The indicator scans for setups within or near the identified supply and demand zones, providing an additional layer of confirmation for potential reversals.
The Turtle Soup Pattern Logic
Attempts at detecting false breakouts within the zones. For example, a bearish Turtle Soup pattern emerges when the price dips below a demand zone but quickly reverses, indicating a failed breakout and potential upward momentum.
Integration and Practical Application
The Flow of Trade indicator integrates these elements, marking out S&D zones while also scanning for reversal patterns within or adjacent to these zones.
The added multi-timeframe analysis can help the traders understanding of broader market context, enabling you to find the relative strength of MTF zones and see how reversal setups perform in the specific asset.
Strategic Entry and Exit Points: Use the confluence of S&D zones and Turtle Soup patterns to find possible entry and exit points.
Risk Management: Potentially leverage the defined zones for setting stop-loss levels and managing trade risk based on supply and demand concepts.
Confirmation and Confluence: Apply multi-timeframe analysis to validate S&D zones and Turtle Soup patterns.
Example of High/Low (H/L) Quotes from Zones:
Example of MTF S&D Zones (4H/D/W):
Conclusion
The Flow of Trade indicator is of time-tested market principles and along with innovative pattern recognition, designed to offer traders a customizable method for more systematized view of supply and demand, along with reversal signals.
Its multi-timeframe analysis can be useful for decision-making and systemizing your trading layout.
Disclaimer
While the Flow of Trade Indicator is a useful tool for analysis, it is important for traders to remember that no single tool can guarantee success.
Past performance is not indicative of future results.
Do not solely rely on the signals from the Flow of Trade indicator.
The indicator is meant to be used as confluence to an existing strategy.

HTF FVG and Wick Fill trackingImbalances in the charts are some of the clearest and most traded price areas. Two of the best and most used are fair value gaps FVGs and large candle wicks. In both of these price appears to move in such a way that most are left behind having 'missed' the move. But in reality price will often come back to these price points to re-balance and absorb the liquidity that was left behind.
This indicator takes these areas and makes viewing and tracking them clearer than ever. It does this, by first allowing the user to overlay a higher timeframe candle on the current chart. This in itself provides an in depth look at a higher timeframe candle both as it forms and in its final form.
Next the indicator identifies either the FVG or large wicks, on the chosen higher timeframe, all while the chart remains on a lower timeframe. As seen here the fair value gaps are clearly highlighted, taken from a 4 hour timeframe, while the actual chart is on 15 minutes. This allows the user even greater accuracy in identifying their key trading areas.
Utilizing the indicators unique feature, these areas can optionally be extended forward to the current timeframe and 'filled' in realtime. Areas that are filled to the users defined level, will be removed from the chart.
With supplementary settings for how much history to show, how large of a wick should be highlighted and complete control over the colour scheme, users will be able to track and understand the filling of imbalances like never before.

Market Structure (Range) & Internal Liquidity
This indicator will simplify the price-action reading of any trader/investor by decluttering his/her charts from un-important & confusing candles to highlight the true momentum candles which are usually formed by institutional buying/selling .
The indicator will be a good tool in the arsenal of the following styles of Trading/Investing
Smart Money / Liquidity Concepts
Price Action Concepts
Demand & Supply Concepts
Support & Resistance Concepts
UNIQUE FEATURES:
1. Market Structure - Range & Internal Liquidity:
Unlike other liquidity indicators, this indicator only highlights liquidity levels of significant importance. Not every intermediate high & low in a chart are worthy of noticing, hence by enabling the 'Swings' & 'Range (BoS)' feature in the indicator settings, the structure highs and lows (external liquidity) in a chart can be identified.
Any other liquidity levels within a market range (Range between structural High & Low) is known as internal liquidity which price targets to collect enough orders before heading towards the external liquidity levels.
2. Gaps (Fair Value Gaps / Imbalance):
Not every imbalance / gap between candles are important & trade-worthy. This feature of the indicator is different from the other widely available imbalance indicators & only highlights gaps formed by true momentum candles. Gaps between unimportant inside bars are not highlighted, as these bars occur in the absence of momentum.
3. True Price Action:
Looking at the two charts below, we can clearly observe the difference between price action of a confusing normal chart & the simplified price action highlighted by the indicator. This feature declutters the charts by only highlighting the candles a trader / investor should notice in a chart.
This feature when used in confluence with the liquidity levels feature & gap feature of the indicator, helps identify the true demand & supply zones (order blocks) in a chart.
Before
After
4. Zig Zag Lines:
This unique feature which is useful to Identify & Backtest different entry types taught by Smart Money Traders . This feature helps the trader understand the True Fractal Nature of price. This can also be seen as an alternate to the default line chart feature.
Examples of Entry Types taken by Smart Money Traders
ADDITIONAL FEATURES:
(These features are essential addons to trade liquidity. However, these are derived from publicly available indicators from the Tradingview library, but with a different interpretation for a better visualization of charts & or to time better trade entries without cluttering the charts)
a. Inside Bar & Outside Bars:
Identify not just a single Inside Bar as highlighted by other indicators, but to highlight a series of candles which are within a master candle range and are exhibiting unimportant sideways price action.
Outside Bars only relevant to momentum candles are highlighted, ignoring candles that occur within a master candle range. Highs & Lows of such Outside Bars are used by aggressive traders to identify liquidity levels in the charts.
b. Highs & Lows of previous Monthly / Weekly / Daily & Hourly Candles:
This feature draws Highs & Lows of previous Monthly / Weekly / Daily & Hourly Candles on the extreme right hand side of the chart to keep the charts clean.
Additionally for Hourly time frame, the indicator includes a setting to select the hourly candle time frame (60 min / 75 min / 240 min), which are personal and different for each trader.
UNDERLYING CONCEPT:
In the image below we see how a large majority of Traders / Investors incorrectly mark Structure markings, mistaking a raid of internal liquidity as a Break of Structure, thereby taking trades opposite to the broader trend of the markets
However, this indicator has a higher accuracy of identifying the correct price structure by only marking a structure high or low, when a subsequently opposite side liquidity is taken/raided. Further the broader trend of the markets can be easily identified by looking as to which side the Break of Structure has happened. (This is visible in the indicator in the form of 'Range' feature, so if a Range High is broken then it is understood to be in an uptrend & vice versa)
The underlying core functionality of the indicator is best displayed by the image below
USECASE OF THE INDICATOR:
Before taking any Buying/Selling position in the markets, a Trader / Investor must analyze the price action on the following parameters
HTF & LTF Trend Identification (To judge if trade is Pro-Trend or Counter-Trend)
Is Price at a High Probability Area of Interest?
Is Price satisfying the trade entry conditions?
Let us see how this indicator can be used as a complete trading system in itself and addresses each of the above parameters
Disclaimer: Illustrations shown below are just for understanding the features of the indicator & does not guarantee profitability. Every trader must back test their setups to arrive at a setup with an edge (positive expectancy) before they start actively trading the setup.
1. HTF & LTF Trend Identification (Pro-Trend / Counter-Trend) using 'Range (BoS)' feature of the indicator
Let's assume a Day Trader, uses hourly chart (75 min) to frame his Higher Time Frame (HTF) ideas & 15min charts (LTF) for trade entries
Looking at the chart below the Trader concludes that the HTF has most recently broken the structure to the downside and is considered Bearish till price action is below the range high of 48600 levels. It can also be concluded that the price is currently in a Bullish retracement.
The Trader can choose to take both Pro-Trend or Counter-Trend Trades, timing the trade entries using the LTF charts.
Looking at the LTF chart below, it is evident that price on LTF has also broken structure to the downside and is now aligned with the HTF Bearish Trend. The Trader will now look to get into short trades, to take trades both in line with HTF & LTF trend.
2. Let's identify if Price is at a High Probability Area of Interest, using either single or combination of the 'Swings' / 'Gaps' / 'Outside Bars' / 'HL of previous M,W,D, H candles' features of the indicator
Definition of High Probability Level / Area differs from each Traders perspective depending upon which of the Trading Styles (mentioned in the beginning) does one use.
Smart Money Traders
SMC Traders are known to get into trades early and their high R:R trades are taken mostly at a High Probability Area of Interest which are identified by them on HTF, by looking for candles with imbalance (gaps) & or candles which have taken out a previous liquidity and then having creating imbalance (gaps).
Also Turtle Soups is one of the favorite setups for SMC traders, where a trader enters a trade on LTF (typically 1 min/3min & 5min) after grabbing HTF liquidity lying at H/L of outside bar / previous monthly, weekly, daily or hourly candles.
Demand & Supply Traders
Some of the Best Demand & Supply Traders have the patience to wait for trades and take trades at the extreme Demand & Supply Zones within a market Range.
As illustrated below, the extreme hourly supply zone just below the structure high, which has the confluence of imbalance and Bearish HTF confirmation resulted in a good R:R trade.
Price Action Traders & Support & Resistance Traders
From the illustration below we can see how the 15 min Range breakdown confirms the breakdown of the Inverted Cup Pattern for Price Action Traders & Support & Resistance Traders using the same area of breakdown as the new Resistance to enter Short trades
3. Let's identify if Price is satisfying the Trade Entry Conditions using the 'Zig-Zag Lines' feature
Statistics say that majority (> 80%) of Traders blow up their accounts multiple times or completely give up and never achieve profitability.
One of the primary reasons for this is Traders punching trades randomly and without having proper Setup or rules for entering Trades.
Also in order to arrive at rules or execute the different entry models (couple of examples highlighted earlier) taught by different Trainers, a Trader needs to learn to visualize charts in a similar format to what the trainers are teaching.
The Zig-Zag lines feature is a form of line chart that joins the swing high points to the swing low points on the chart to represent the True Price action & a proper fractal nature of the markets, unlike the line chart which is formed by only by joining the closing value of each candle.
From the image below we can see that the Zig-Zag lines feature eliminates the randomness visible in the line chart and is a more smoother chart. Using this feature one can back test the various entry models widely available on the internet or arrive at a user specific model which he/she is comfortable with.
CONCLUSION:
Trading with a deeper understanding of Price Action allows a Trader/Investor to enter or exit trades with ease. Price Action trading allows individuals to keep their charts clean and stay away from the other lagging technical indicators and enter trades much earlier than other technical indicators.
This indicator attempts in simplifying the understanding of price action for every one and identify potential high probability areas / levels where one should enter / exit trades.
This indicator will be an important tool in the arsenal of any Trader / Investor to take better informed trades, however it does not guarantee profitability of a Trader, due to the randomness of the markets & external factors that influence each trader.
GET ACCESS:
Refer Author's instructions below to get access to the indicator

QTE Scalper ModifiedA modified version of the QTE scalper indicator. Produces a buy/sell signal based on a 2 candle pattern. For long signals it produces a signal when the high and low of the second candle are below the high and low of the first candle and both candles close above the 10 period EMA. The reverse is true for short signals.
Added functionality so that signals will trigger an alert: Add the indicator to the chart on the instrument and timeframe you wish to use it on. Add an alert and in the 'condition' section choose the indicator and set the trigger as 'once per bar close'. You will have to set individual alerts for both long and short signals and if you change the time period on the chart.

Candle Close TrendFirst of all, a huge credit to Wade for all the help with this indicator. An absolute Legend!
The idea behind this indicator is to identify a potential trend with simply the close of candles.
If a candle closes above the previous candle High, the trend would be "bullish" and remain bullish until there is a candle that closes below the previous candle Low. The opposite is true for a "bearish" trend.
As always, this is NOT intended to be used by itself, but with other TA.
For cleanest results, I find it best to use with the candle borders turned off in the chart settings but that is just my preference.
Works on all timeframes.
