*SSS 50% [Intra]SSS 50% Rule Indicator - Intraday 5/15/30/60 Version
This indicator is based on Sara Strat Sniper's - 50% Rule for trading Outside Bars and helps you visual the method quickly.
This indicator allows you to select: Outside 5/15/30/60 minute Warning Levels with Previous High and Low Levels all available within the indicators settings.
Please note - 60 minute warning and high/low levels are set to the indicators default. Feel free to change and save as required. Any issues let me know.
** Indicator Setup Requirements **
For Indicator to correctly display the 50% price level you need to setup your chart correctly. Right-click your chart background, select Settings, select Scales and Tick “Indicator Last Value Label". Now your 50% Price level will be displayed.
Nov 30, 2021
Custom functions added as requested by users to produce cleaner charts.
H Line added for 50% level
Ability to change color for H/L Levels and Labels.
Adjust Line Width and Line Style
Adjust 50% and High/Low Label Offsets
Basic Alert Function added for 50% Level. Add Alert and Select Condition: SSS 50%, followed by your desired Outside Day Warning.
Please note alert functions have been tested and work once the current close price crosses the 50% level. Any issues please let me know and I will update when required.
K線分析

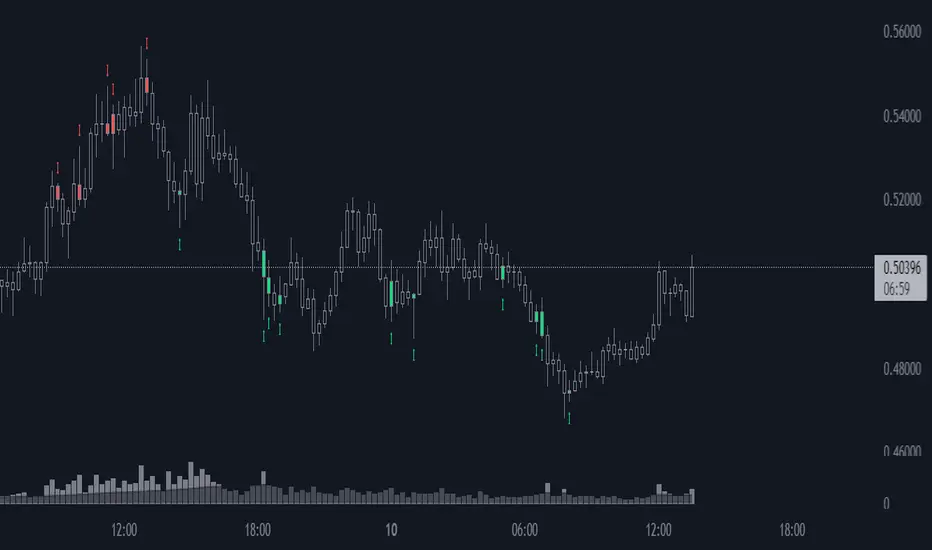
Fear and Greed Index CandlesticksThis colours the candlesticks based on my 'Fear and Greed Index'.
All calculations are explained in the code.
The index is mainly based upon the components of the popular fear and greed index website. I've annotated the components in the code for you to look at.
If you're interested, you can replace the final variable 'Total' (within the 'barcolor' function at the very end) with any of the final outputs of the subcomponents to see the results of that single part.
Red = Greed
Green = Fear
Enjoy!

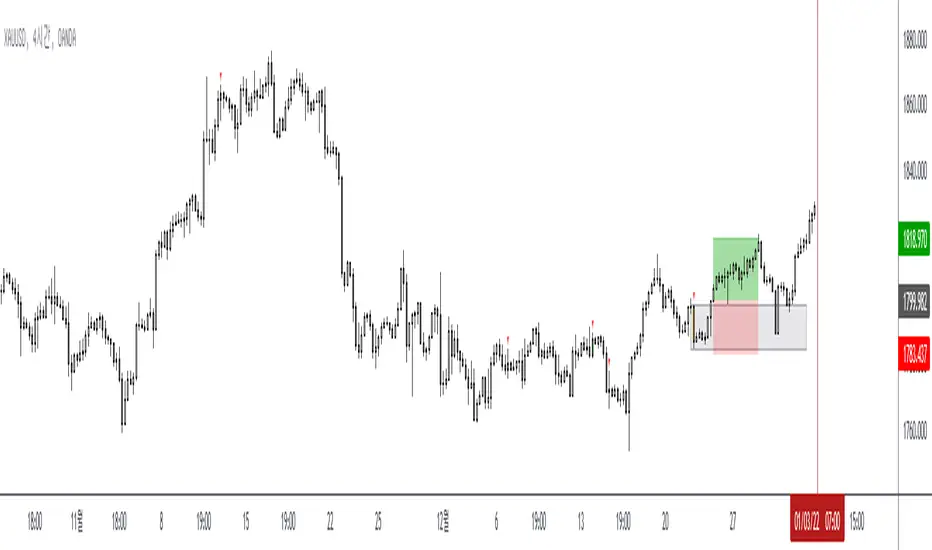
Find Master Candle(MC)Description.
1. This indicator finds and displays master candles.
2. Master Candle (MC)? After the MC, the first candle becomes the MC if there is a movement of 4 candles trapped in the master candle.
3. Option setting
3.1. Specify min/max size and pip conversion variables to specify the size of the master candle (MC).
3.2. The size of the master candle (MC) can be specified by the size of the pip.
3.3. The body size of the master candle (MC) can be specified as a percentage of the total candle.
4. trading strategy
4.1. Master Candle Identification
4.2. Enter trading when the master candle is broken
4.3. The target return is basically the same as the size of the master candle (however, you want to find a valid value according to the stock)
※ It is recommended to set the master candle size and target profit range according to the trading time chart.
※ This trading strategy is useful for judging when to break through a certain range, and is useful both for scalping and beyond.
------------------------------------------------------------------------------------------
설명.
1. 이 인디케이터는 마스터 캔들을 찾아서 표시 해줍니다.
2. 마스터캔들(MC)? MC 이후 캔들 4개가 마스터캔들에 갇힌 움직임이 나오는 경우에 첫 캔들이 MC이 됩니다.
3. 옵션 설정
3.1. 마스터캔들(MC)의 크기를 지정하기 위해 최소/최대 사이즈 및 핍 변환 변수를 지정합니다.
3.2. 마스터캔들(MC)의 크기는 핍의 크기로 지정할 수 있습니다.
3.3. 마스터캔들(MC)의 몸통 크기는 전체 캔들의 %비율로 지정할 수 있습니다.
4. 매매 전략
4.1. 마스터 캔들 식별
4.2. 마스터 캔들 돌파 시 거래 진입 ( cf . MC +-5 pips 인 경우 진입)
4.3. 목표 수익은 기본적으로 마스터 캔들의 크기 만큼 (그러나, 종목에 따라 유효한 값을 찾기 바람)
※ 거래 시간대 차트에 따라 마스터 캔들 크기 및 목표 수익의 범위를 정하기 바람
※ 이 거래 전략은 특정 범위의 돌파 시점을 판단하는데 유용하고, 스캘핑 또는 그 이상의 거래에 모두 유용합니다.
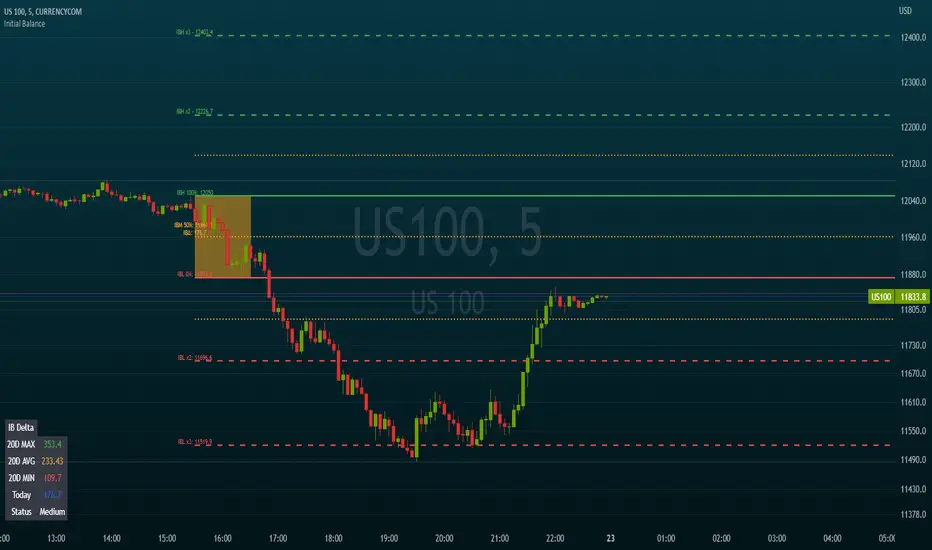
Initial BalanceThis script calculates and draws the initial balance price levels which can be really interesting for intraday activities.
Note: Obviously, you need to wait for the calculation period to finish in order to see your daily levels
The tool includes the following options
Customization of the session used to calculate the initial balance (default 0930-1030)
Show/Hide the calculation period (as a background color)
Show/Hide extra levels (report the IBH-IBL delta above and under the IB area)
Show/Hide intermediate levels (displays 50% price levels in the IB and extra areas)
Show labels (Display levels names as well as their price on corresponding lines)
Levels names:
- IBH (Initial Balance High)
- IBH (Initial Balance Low)
- IBM (Initial Balance Middle)
- IBH x2
- IBL x2
Default colors are green for high levels, red for low levels, and orange for intermediate levels
Extend levels (extends the current levels to left/right/both/none sides of the chart)
SMART4TRADER - BREAKOUTThis indicator shows the breakthrough of extremes for the selected period. The default period is set = 3
The indicator checks on the current bar whether the maximum or minimum prices for the selected period are broken
----------------
Данный индикатор показывает прорыв экстремумов за выбранный период. По-умолчанию выставлен период = 3
Индикатор проверяет на текущем баре пробиты ли максимальные или минимальные значения цен за выбранный период

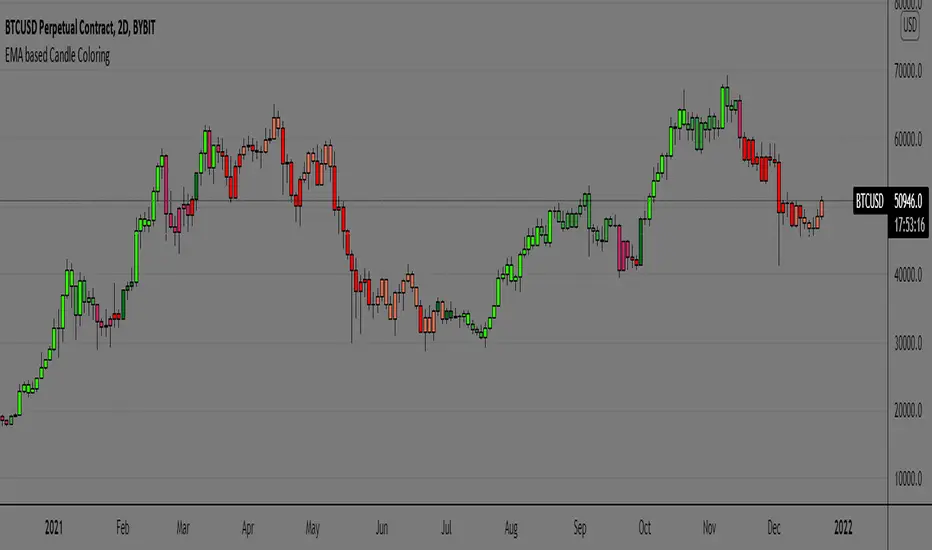
EMA based Candle ColoringEMA or Exponential Moving Average (EMA) is a technical indicator used in trading practices that shows how the price of an asset or security changes over a certain period of time. The EMA is different from a simple moving average in that it places more weight on recent data points (i.e., recent prices)
In this script plain EMA or MA is not used for candle coloring, but it takes multiple EMAs of the original EMA and then subtracts lag from the result to get data points of each candle of two certain periods defined. As it differs from traditional EMAs and MAs by reacting quicker to price changes and is able to subtract lag with its calculated formula.
The candle coloring is able to interpret short-term price direction and overall trend and its suitable for active traders. As it tracks price more closely than SMAs
Since EMAs can also provide support or resistance for price and is highly reliant on the asset’s lookback period we can make sure we stay with the trend rather than going against the trend.
*First of all here's what the colors represent and how to interpret them is shown in below image
Examples of how I use the Coloring pattern
Spotting a fakeout/stophunt
during trends:
* No strategy is 100% accurate this script is one of those too , traders must use this as an addition to their system rather than making it a standalone system.
* Context is important as the coloring is done using calculations, different timeframes has different context hence traders discretion is key.
Hope you find this helpful,
Thankyou.
happy trading.
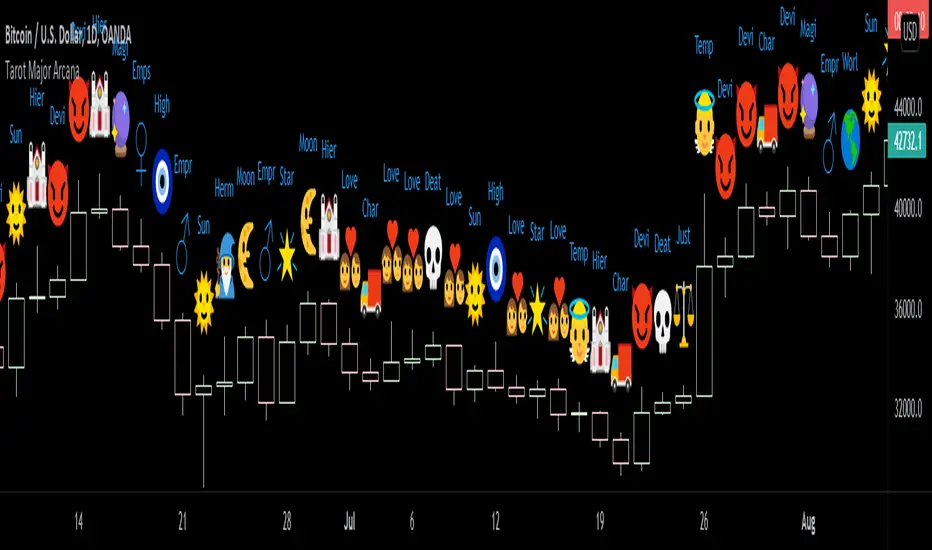
Tarot : Major ArcanaThis script generates a Major Arcana Tarot card for each candle at its close.
The candle is divided into 22 sections, each section corresponding to one of the Major Arcana.
When a candle closes, it closes in one of those 22 sections and that generates the card.
You could read green candles as upright and red candles as reversals.
Uses
----
Use this to pull a daily card on your chart.
Ask a question on the one-minute chart before the candle closes and wait for your answer.
Use it to forecast the upcoming market.
Anything else!
Enjoy.
TAPLOT Price Time Frame Continuity #TheStrat#TheStrat Price Continuity is a simple concept in where market participants across multiple time frames are in-sync with each other.
The concept looks at multiple time frames & assess if harmony exists between them. The way that is done is looking at closing price vs opening price on each time frame.
If monthly bar is up & weekly bar is up and daily bar is up, that means market participants across all of these 3 different time frames are in-sync with each other.
The indicator places an indicator at the top right side of the chart with each resolution closing price vs open. if Close is higher than open then green else red.
The indicator setting allows you to change the size of the data cells and text color.
How do I use this?
I am a swing/position trader. The indicator gives me more conviction when I see that daily, weekly and Monty chart are all in-sync with each other.
Please note that the indicator displays ONLY on daily charts.

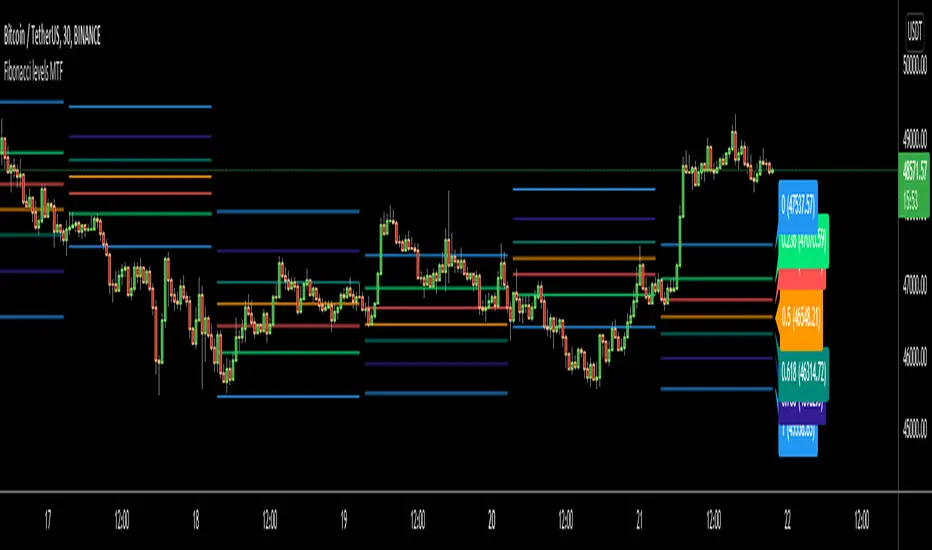
Fibonacci levels MTFHello All,
I got some requests for a script that shows Fibonacci Levels of Higher Time Frame Candles. so I made/published this script. I hope it would be useful for you.
Options:
You can set Higher Time Frame, by default it's 1 Day.
Optionally it can use Current or Last Candle of higher time frame to calculate/show its Fibonacci Levels.
It can show higher time frame candles at the background optionally. You can change its colors.
You can enable/disable/change each Fibonacci levels and their colors.
You can enable/disable Fibonacci Labels that is shown at the right ride and see only Fibonacci lines/levels
example, Fibonacci levels with higher time frame candles:
P.S. if you have ideas to improve this script, drop a comment under the script please
Enjoy!
Trailing Stop AlertsThis script is designed as an ATR-based trailing stop tool to assist in managing open positions.
Once you're involved in a profitable trade, if you add this script to your chart you'll be prompted to select a bar to begin trailing from.
You can then adjust the candle lookback distance for swing high/lows (7 by default), the ATR multiplier (1.0 by default), and the direction to trail (Long/Short).
You can also adjust the ATR period in the settings menu if you want to (14 period by default).
Once the script is added to your chart, it will begin drawing your trailing stop and you can then set up alerts.
Alert Options:
Any alert() function call : Will trigger an alert for both conditions (trailing stop updated, trailing stop hit)
Alert Conditions : Trailing Stop Update will trigger whenever the stop is updated, Trailing Stop Hit will trigger whenever the stop is hit.
Note: the alerts will only fire once per bar close and the trailing stop will not update on realtime bars.

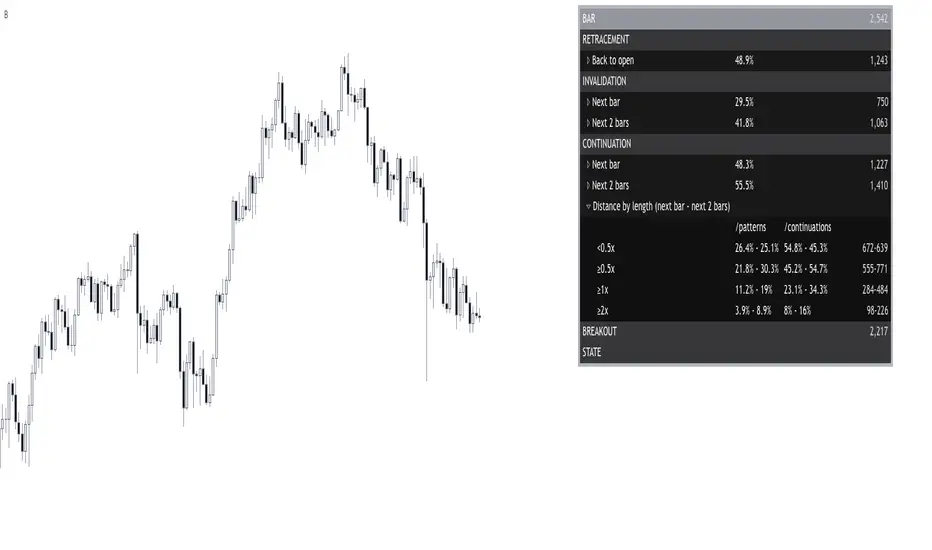
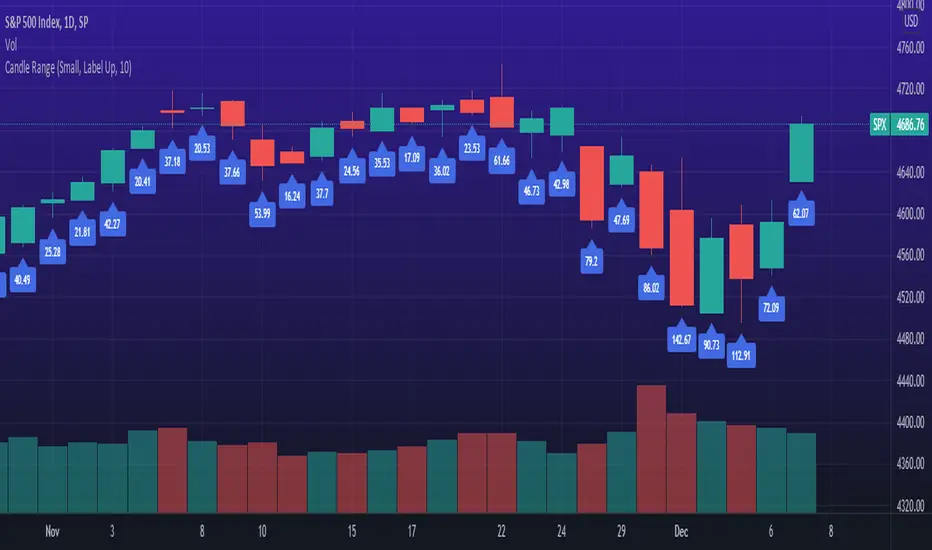
Bar█ OVERVIEW
This indicator demonstrates how we can use Pine script for collecting data to study the market.
By building a statistical report based on the chart candlestick analysis, discover if there is an edge or not, when and where?
Compare it with a specific candlestick pattern and know how its behavior diverges. I have already covered some here .
I hope it can bring you ideas for researching new edges, testing, and trying new things.
█ FEATURES
Sections
The report organizes the data into the following sections: retracement , invalidation , continuation , breakout , and state . Each of them provides insights into the price behavior and answers to questions such as: How often does price retrace? Does the pattern often invalidate? If it does not, does it break in the pattern's direction? How far does the price go? What are the odds of a false breakout? What is the likelihood of the next bar being a down candle?
Highlighter
The indicator highlights flat bars (open and close at the same price). It also highlights bullish and bearish bars once a filter is applied.
Settings
Filtering of bars closing beyond their prior bar’s high and low;
Filtering of reversal bars (two modes available);
Displaying distances relative to the bars length or Average True Range;
Collapsing/expanding each section;
Changing the report’s coloring and positioning;
█ NOTES
Computation
The script computation occurs on bar close.
Distances in ATR
When using a period of 20, for example, the first 19 candles are ignored because the ATR is not defined yet.
Waves + ZOOnesTrend visualization tool in Wave theory. Unlike Elliot waves, it has a constant pattern length. The formation consists of impulse and 3 corrections.
The script analyzes candle relationships in the currect trend, trend will be continueted until candle are not breaking trend rules.
Currently it supports 2 rulesets/wave variants:
Low - More sensitive (trend will change more ofter).
Meddium - Less sensitive ( trend will change less ofter).
Simultaneous observation of both types allows to detect consolidation before the overlapping movement and increase the probability of indicating the moment of the movement occurrence.
Script with limited access, contact author to get authorization
Features:
- Show Low and Middle type/order waves
- Show support/resistance areas for the Low and Middle type/order waves.
- Types for waves and support areas are picked independently. Script can show Middle Waves with Low Waves support areas.
- Shadow mode that show second wave moved to the wave max/min bars.
- Show historical support/resistance areas that are not valid any more.
Script settings:
Trend type - You can switch what kind of waves should be drawn.
ImpulsMode - Picking graphical reprezentation of first bullish arrow.
Line width - With of drawn line. Separate setting for Low and Medium trend type.
Impuls - Color of the first bullish arrow.
Correction - Color for other arrows.
Trend shadow - Showing second reprezentation of the trend with drawing with the use of minimal and maximal values. It's usefull to determine the delay between the peak and a wave change signal.
ZOOnes type - Determines what type of trend is used to designate areas of support.
Only nearest zones - Drawing only one nearest zone above and below current price.
Only nearest potencial zones - Drawing only one nearest potencial zone above and below current price.
Show history - Showing zones in historical data
Zone precision - Determines how many bars are included in area calculation.
Alerts:
Low trend DOWN - When Low trend type is changing from UP to DOWN
Low trend UP - When Low trend type is changing from DOWN to UP
middle trend DOWN - When Middle trend type is changing from UP to DOWN
middle trend UP - When Middle trend type is changing from DOWN to UP
middle trend from ZOOnes DOWN - When Middle trend type is changing from UP to DOWN after hiting resistance area .
middle trend from ZOOnes UP = When Middle trend type is changing from DOWN to UP after hiting support area .
Troubleshooting:
In case of any problems, send error details to the author of the script.

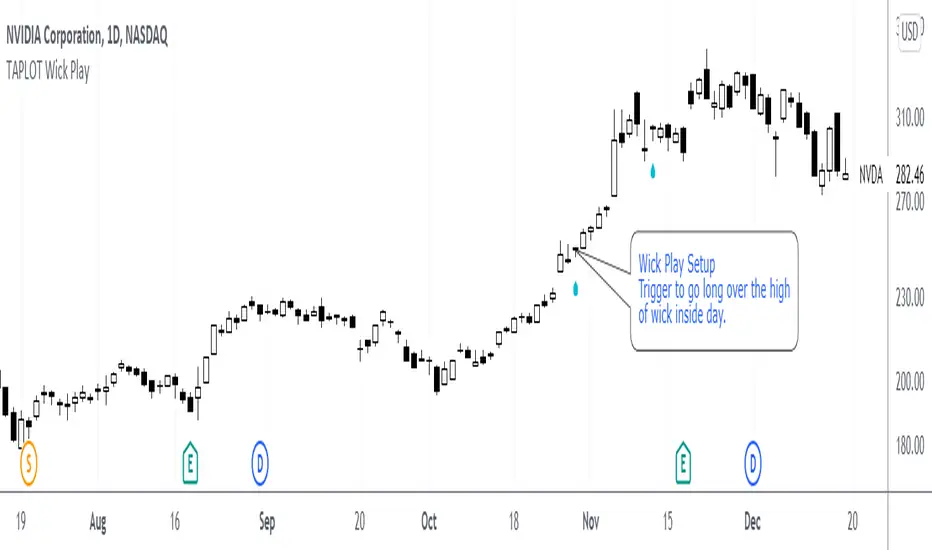
TAPLOT Wick PlayWick play is a candle stick long setup popularized by 2020 US Investing Champion Oliver Kell
Wick Play is a setup in which:
Strong stock with momentum to the upside closes off the highs of the day in yesterdays session.
Today's session opens in the candle "wick" of yesterdays bar.
If stock holds in the wick and doesn't trade in the body of yesterdays candle, it is a sign of strength.
Trigger happens on day 3 when price moves over the high of the wick inside day.
It is important to note that this setup should not be traded in isolation. Not every wick play is buyable.
This is to be used in the context of strong stocks like True Market Leaders and with buying momentum behind them.
Indicator places an up arrow under the candle setup. It also colors the candle itself. All configurable through indicator settings.
Cheers!
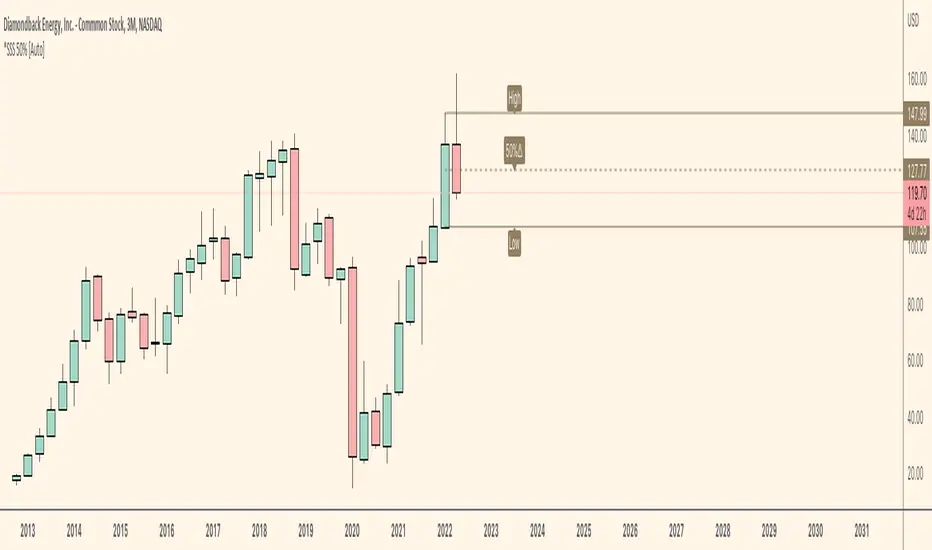
*SSS 50% [Auto]** SSS 50% - Displays Outside Warning and Previous High/Low on Current chart timeframe or Custom Timeframe Selection **
Outside Warning and Previous high/low levels default is set to the current charts timeframe.
For all Custom Timeframes, select within Indicator settings. Note this indicator is a simple version of my previous SSS Rule Indicator and HTF as this is allows for ONE Timeframe only!
This indicator is based on Sara Strat Sniper's - 50% Rule for trading Outside Bars and helps you visual the method quickly.
** Indicator Setup Requirements **
For Indicator to correctly display the 50% price level you need to setup your chart correctly. Right-click your chart background, select Settings, select Scales and Tick “Indicator Last Value Label". Now your 50% Price level will be displayed.
Known Issues:
This indicator does not work when you try to view a lower timeframes levels on a higher timeframe chart.
Example 1: Selecting Daily Warning, High and Low Levels will not be displayed correctly on a Weekly timeframe and above etc. The Daily selection however will be displayed correctly on all lower timeframes from the 1 minute chart to the Daily.
Example 2: Selecting Weekly Warning, High and Low Levels will not be displayed correctly on a Monthly timeframe and above etc. The Weekly selection however will be displayed correctly on all lower timeframes from the 1 minute chart to the Weekly. Please apply these same rules for all other timeframe indicator selections.
Monthly Warning, High and Low levels will not work correctly on a Weekly chart when the current Weekly candlestick is forming between the end of a previous Month and start of new Month. Once the first Weekly candle of a new Month closes the Monthly levels will now be displayed correctly. Please note, selecting the Monthly levels when viewing a Monthly chart will work as normal and Monthly levels displayed on a Weekly chart will be corrected once the first Weeks candle has closed. I believe this error is caused by a pine script repainting issue when assessing historical price data which is out of my limited scripting brains control.
EMA Confirmations & RejectionsWant to know how the bulls and bears are doing? Use this to see the attempts made for making big moves and their outcomes to feel more confident in your entry or exit and know when the tides are turning. Do not read a single arrow or cross on the chart and think it means one thing. Take in the big picture and detect patterns and frequency of good or bad signals to determine the likelihood of the future being bullish or bearish. For example, more green arrows than orange arrows in a consolidation period would suggest a break to the upside is more likely.
There are 4 different signals this indicator can print:
1. A green arrow indicates a move of strength to the upside has begun. Could be a bull trap or the start of a long lasting bullish move.
2. An orange arrow indicates a move of strength to the downside has begun. Could be a bear trap or the start of a long lasting bearish move.
3. A blue cross is printed above if the break was to the upside, or below if it was to the downside. Indicates a failed attempt to change the trend and bullish price action is more likely in the next few candles.
4. A red cross is printed above if the break was to the upside, or below if it was to the downside. Indicates a failed attempt to change the trend and bearish price action is more likely in the next few candles.
The location of the cross is more important than the colour. Above means pressure downwards, and below means pressure upwards.
Pro Tip: Green arrows below 50 on the RSI are more meaningful than when above. This also works for orange arrows when above 50.

Favorite Signals w/EMA FilterThe script combines my favorite signals then filters them with three EMAs.
Via the Style tab, you can choose to either have the signals color the bar and/or plot a shape above/below.
All signals can be turned off via the Inputs tab, which will remove the bar color and/or shape (if not already off in the Style tab) as well as remove the pattern from the alerts function.
Remember when using TV alerts, if you change the script settngs, you must create a new alert if you wish to be alerted for the changes you've made.
LONG/SHORT SIGNALS INCLUDED FOR:
- TD8s
- TD9s
- Hammer
- Shooting Star
- Bullish Harami
- Bearish Harami
- RSI Divergences
EMA FILTER LOGIC LONGS:
- Price < Fast EMA & Med EMA > Slow EMA = Possible Long Entry
- Price > Fast EMA & Med EMA > Slow EMA = Possible Reversal, Tighten Stop or Reduce Position
EMA FILTER LOGIC SHORTS:
- Price > Fast EMA & Med EMA < Slow EMA = Possible Short Entry
- Price < Fast EMA & Med EMA < Slow EMA = Possible Reversal, Tighten Stop/Reduce Position
Big up to @spdoinkal, @HPotter, @LonesomeTheBlue, for writing the originals scripts for the signals above.
Enjoy!
Bar Percent CompleteThis is an example script for checking how far the current bar has progressed towards it's completed state. This works for any time frame, eliminating extra logic calls and conversions for each timeframe.period. It is not intended to be a standalone indicator, but rather as a resource for additional logic triggers on the real time bar of a pine script.
The main caveat is that pine script calculations occur on a per-tick basis. This means that the completion percentage can exceed the percentage threshold before any logic is executed. This happens when the next tick occurs after the threshold. The relevance then will depend on the activity of the underlying asset. Longer time frames on low activity assets will likely be more relevant than their shorter time frame counterparts.

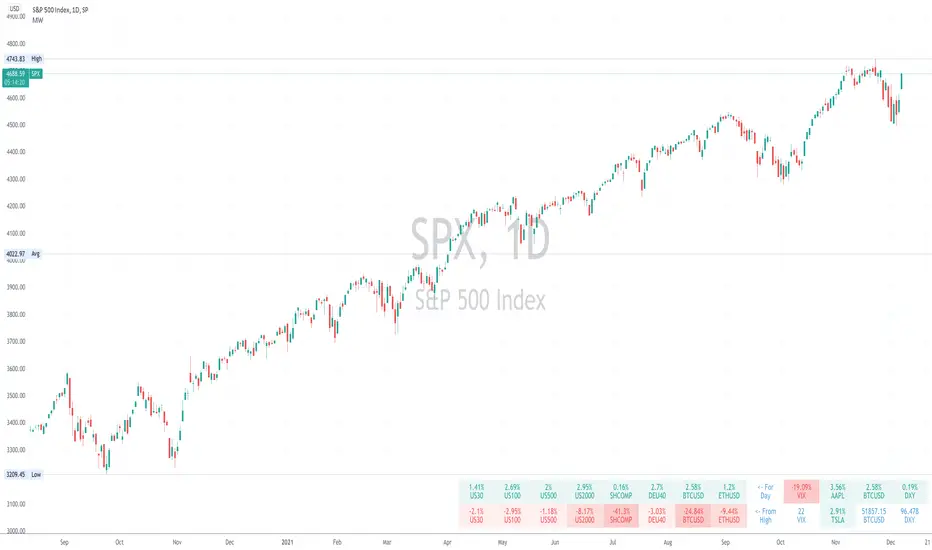
Market WatcherMarket Watcher is companion table indicator that keeps an eye on the rest of the market, regardless of the ticker you are currently viewing.
Keep track of up to 8 tickers and their change on the day as well as their distance from their all time high. After all, who doesn't like an all time high???
Also keep track of 8 additional tickers and either their change on the day or their current price.
There are 9 different default positions as well as the ability to add a gap from the borders, incase you have other information already in the default position you want to use. It also has the ability to change the width of the table borders.
Have modification ideas for this indicator? Just let me know and I will gladly consider them!
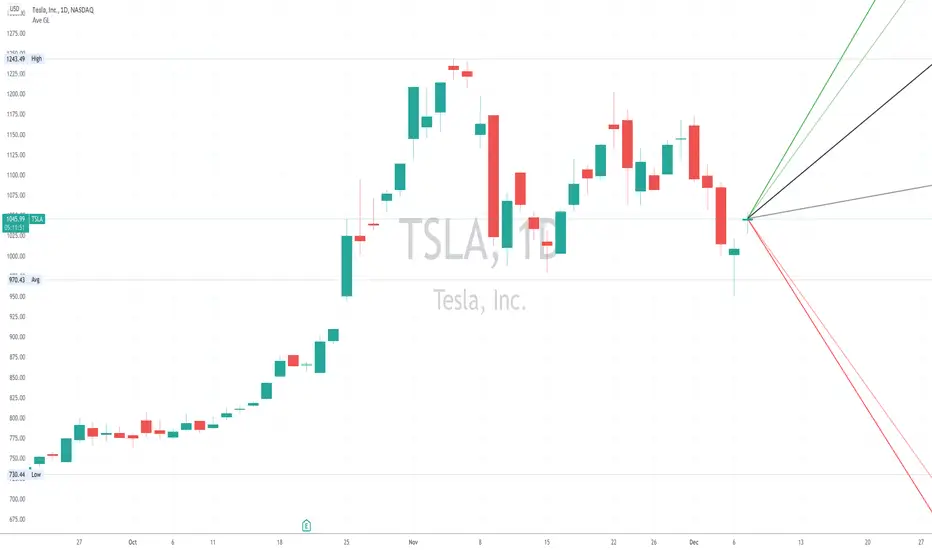
Average Gain/LossThe Average Gain/Loss indicator adds rays to show what the average trade range might be for a given ticker based on historical data.
Green lines are the average gain, red lines are the average loss and black are the overall average.
Darker lines are the average of close to close and lighter lines are the candle averages.
Default average is set to 50 bars but is adjustable in settings.
Have modification ideas for this indicator? Just let me know and I will gladly consider them!
Price Action [Morty]This price action indicator uses the higher timeframe SSL channel to identify trends.
The long entry signal is a bullish candlestick pattern when the price retraces to EMA20 in an uptrend.
The short entry signal is a bearish candlestick pattern when the price retraces to the EMA20 in a downrend.
Currently, this indicator shows engulfing patterns, pin bar patterns, 2 bar reversal patterns and harami patterns.
It also shows a volatility squeeze signal when the Bollinger bands is within the Kelter channels.
The buy and sell signal can also be filter by the ADX indicator greater than a threshold.
You can set your stoploss to the previous low/high when you go long/short.
The risk/reward ratio could be 1 to 1.5.
This indicator can be used in any market.

Plot Real Open and Close - SamXI built this indicator as a personal request from a friend. He often trades using Heiken Ashi charts, but wanted a way to easily cross-reference real-price open and close values for the same timeframe on the same chart (as HA candles are by design lagging, they can take a few periods to catch up to a large move). This can also be used to help guide support and resistance zones using real-price data points should you so choose.
There are 2 major ways to configure this indicator to display real-price open and close:
As a Bar or Hollow Candle style chart overlay
As on-chart shapes (allowing individual control over which data to show - open, close, or both)

*SSS 50% HTF** SSS 50% - HTF (Higher Timeframe) -D/W/M/Q Edition **
This indicator is based on Sara Strat Sniper's - 50% Rule for trading Outside Bars and helps you visual the method quickly.
This indicator allows you to select: Outside: Day/Week/Month/Quarter Warning Levels with Previous High and Low Levels available within the indicators settings.
Please note - Daily warning and high/low levels are set to the indicators default. Feel free to change and save as required. Any issues let me know. See known issues below.
** Indicator Setup Requirements **
For Indicator to correctly display the 50% price level you need to setup your chart correctly. Right-click your chart background, select Settings, select Scales and Tick “Indicator Last Value Label". Now your 50% Price level will be displayed.
Known Issues:
This indicator does not work when you try to view a lower timeframes levels on a higher timeframe chart.
Example 1: Selecting Daily Warning, High and Low Levels will not be displayed correctly on a Weekly timeframe and above etc. The Daily selection however will be displayed correctly on all lower timeframes from the 1 minute chart to the Daily.
Example 2: Selecting Weekly Warning, High and Low Levels will not be displayed correctly on a Monthly timeframe and above etc. The Weekly selection however will be displayed correctly on all lower timeframes from the 1 minute chart to the Weekly. Please apply these same rules for all other timeframe indicator selections.
Monthly Warning, High and Low levels will not work correctly on a Weekly chart when the current Weekly candlestick is forming between the end of a previous Month and start of new Month. Once the first Weekly candle of a new Month closes the Monthly levels will now be displayed correctly. Please note, selecting the Monthly levels when viewing a Monthly chart will work as normal and Monthly levels displayed on a Weekly chart will be corrected once the first Weeks candle has closed. I believe this error is caused by a pine script repainting issue when assessing historical price data which is out of my limited scripting brains control.
