Noro's Crypto Pattern for H1This indicator shows to the user a pattern. This pattern is drawn on graphics.
For:
- Any crypto
- H1
K線分析


bitFlyer DeviationbitFlyer price deviation percent between FXBTCJPY and BTCJPY.
bitFlyerのBTCFXとBTC現物の価格乖離(%)を表示します。

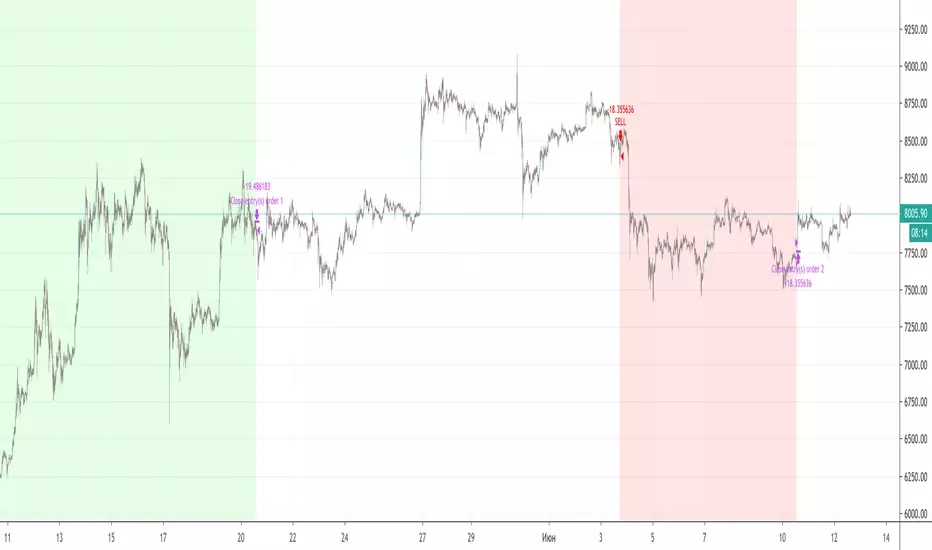
weekend rally bloody mondayTracks the gain-loss of the price on Mondays and the range gain-loss from Monday (configurable) to Sunday. Then, it identifies Sunday's pumps that end with a Monday dump.

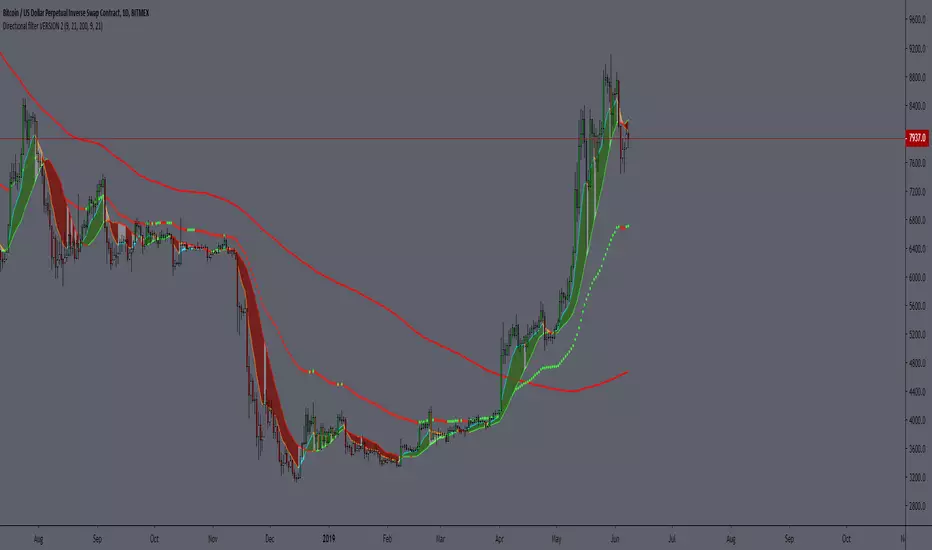
Directional filter VERSION 2The idea is to make it more visible if the moment is to seek buying or selling, based on moving averages, being SMA 21 and EMA 9.
best BUYBAR has the EMA9 and SMA21 rising and closing above them. "relevance A"
best SELLBAR has the EMA9 and SMA21 dropping and closing below them. "relevance A"
Conditions for all colors of the candlesticks:
BuyBar A = price closes above EMA9 and SMA21 with EMA9 and SMA21 rising.
BuyBar B = price closes above SMA21 with SMA21 rising OR price closes above EMA9 and SMA21.
BuyBar C = price closes above EMA9 with EMA9 rising and SMA21 falling.
BuyBar Neutral = close> open.
SellBar A = price closes below EMA9 and SMA21 with EMA9 and SMA21 falling.
SellBar B = price closes below SMA21 with SMA21 falling OR price closes below EMA9 and SMA21.
SellBar C = price closes below EMA9 with EMA9 falling and SMA21 rising.
SellBar Neutral = close abertura.
SellBar A = preço fecha abaixo de EMA9 e SMA21 com EMA9 e SMA21 caindo.
SellBar B = preço fecha abaixo de SMA21 com SMA21 caindo OU preço fecha abaixo de EMA9 e SMA21.
SellBar C = preço fecha abaixo de EMA9 com EMA9 caindo e SMA21 subindo.
SellBar Neutral = fechamento < abertura.
As medias moveis também alteram de acordo com a direção em que estão:
EMA 9 subindo = azul
EMA 9 caindo = laranja
SMA 21 subindo = verde
SMA21 caindo = vermelho

Inside BarsMark Inside Bars with a triangle above the calendar. This indicator supports having different colors and alerts for 1, 2 or 3 consecutive inside bars.

Edward PriceAction
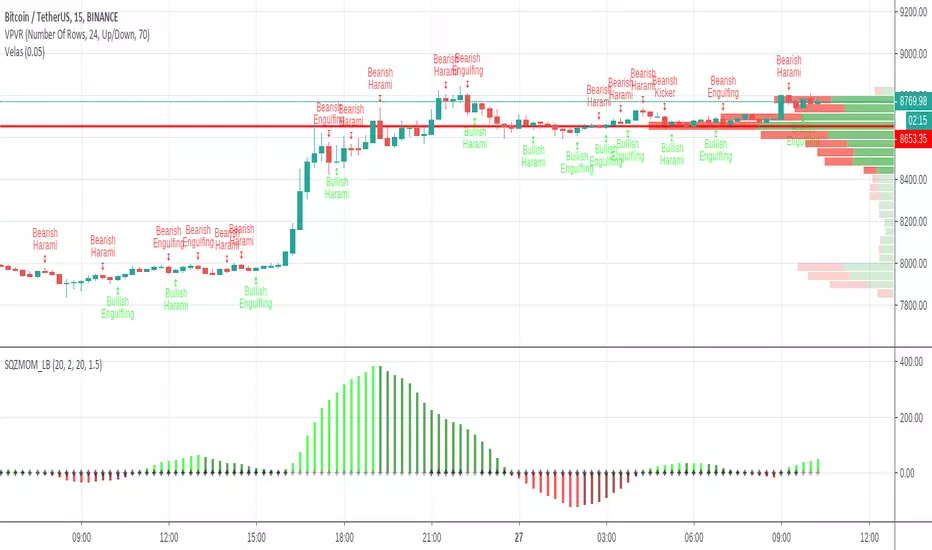
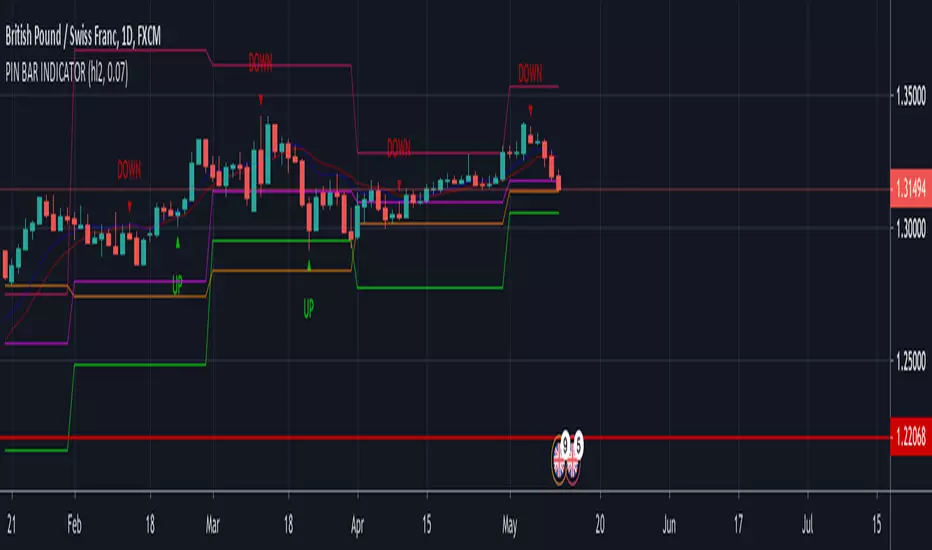
This is an updated version of my previous script, I have added a few extra Patterns and some patterns specs have chnaged over those specified by "Price Action Battle Station by theforexguy".
Because this script has diverted from the original specification of "theforexguy", I have decided to release it as a new version. Improvements have been made to some of the pattern finding calculations, for example Hammer and Shooting Stars are now special Pin Bars, they now must have preceding and succeeding confirm bars, so they do not occur very often.
NOTE: All the identification of PA candles is disabled by default.
Changes made in Version 2.0 :
Added Forex Morning and Evening Stars (the centre small candle is not a specific color).
Abbreviated text names for less cluttered look.
Change minimum/maximum bar sizes to be a % of current ATR, rather than pips, this makes relative sizing independent on Time Frame, and make the script work better with non-currency assets like stocks and commodities .
Change definition of Hammer and shooting Star so the the previous candle is part of a trend and is followed by a confirm candle.
Added some precendence test to reduce multiple action labels.
版本注释: After some feedback from fellow traders I have made the following changes:
Definition for Outside Bar now does not require the previous bar to be opposite Colour (this the same as Inside Bars), but added a requirement for minimum size ratio compared to previous Bar (set to 1.1 by default). If you require previous Bar to be opposite colour, you could use Engulfing candles with Outside Bar option enabled.
Added Maximum size ratio requirement for Inside Bars (set to 0.9 by default).
版本注释: Minor Update.
Added OverSized candle Pattern, the pattern is labelled when candle is some ratio (default 5) bigger than current ATR of chart time frame.
Added Option to Change ATR Length.
版本注释: Patch
Correct Polarity of Oversize Bar labelling.
中文解释:
价格行为交易,此指标能够显示出来K线所代表的意思,比如PB就是PINBAR的意思 就是倒锤头线,反转概率大于延续概率。
OB就是吞没的意思,不管是阴吞没还是阳吞没 我们根据PA入场就行,标准是回撤50%入场。而ODJI就是黄昏星,启明星的意思。
这个指标在添加的时候是空白的,需要人工去点设置,把需要使用的功能打上钩钩确认。这样就能够在图表上面显示出来了。
如果不希望显示彩色K线同样也可以设置哈!
数值和样式都 可以设置,在不懂指标的前提下推荐使用默认设置。只负责打勾勾就行。确认后就能够看到图表上面显示的指标了。

Identificador de Candlestick PT-br (updated 27/05/19) -whande1Identificador de Candlestick PT-br (updated 27/05/19) -whande1
10/20 MA Cross-Over with Heikin-Ashi Signals by SchobbejakThe 10/20 MA Heikin-Ashi Strategy is the best I know. It's easy, it's elegant, it's effective.
It's particularly effective in markets that trend on the daily. You may lose some money when markets are choppy, but your loss will be more than compensated when you're aboard during the big moves at the beginning of a trend or after retraces. There's that, and you nearly eliminate the risk of losing your profit in the long run.
The results are good throughout most assets, and at their best when an asset is making new all-time highs.
It uses two simple moving averages: the 10 MA (blue), and the 20 MA (red), together with heikin-ashi candles. Now here's the great thing. This script does not change your regular candles into heikin-ashi ones, which would have been annoying; instead, it subtly prints either a blue dot or a red square around your normal candles, indicating a heikin-ashi change from red to green, or from green to red, respectively. This way, you get both regular and heikin ashi "candles" on your chart.
Here's how to use it.
Go LONG in case of ALL of the below:
1) A blue dot appeared under the last daily candle (meaning the heikin-ashi is now "green").
2) The blue MA-line is above the red MA-line.
3) Price has recently breached the blue MA-line upwards, and is now above.
COVER when one or more of the above is no longer the case. This is very important. You want to keep your profit.
Go SHORT in case of ALL of the below:
1) A red square appeared above the last daily candle (meaning the heikin-ashi is now "red").
2) The red MA-line is above the blue MA-line.
3) Price has recently breached the blue MA-line downwards, and is now below.
Again, COVER when one or more of the above is no longer the case. This is what gives you your edge.
It's that easy.
Now, why did I make the signal blue, and not green? Because blue looks much better with red than green does. It's my firm believe one does not become rich using ugly charts.
Good luck trading.
--You may tip me using bitcoin: bc1q9pc95v4kxh6rdxl737jg0j02dcxu23n5z78hq9 . Much appreciated!--

Function To Candles - Another way to see indicatorsIntroduction
There are different and better way's to see price data, a candlestick chart is one of the best way to see the price since you have access to the open/high/low/close information, this is really efficient and can allow for naked non parametric trading strategies (candlesticks patterns) . But what about making candles out of indicators ? There are tons of studies about candlesticks patterns in price data but none (?) about candlestick patterns using indicator data, therefore i made this script in order to show candles from various indicators, i also made an heikin-ashi mode.
Rsi To Candles
All the indicators are use the open/high/low/close price as input in order to return candles. length control the indicator period.
Stochastic To Candles
The stochastic oscillator is restrained in a range of 0/100, therefore when equal to 0 or 100 the candles can be flat.
Rate Of Change To Candles
The rate of change don't distort price as heavily as other indicators since its based on differencing.
Center Of Gravity To Candles
The center of gravity (cog) is defined from tradingview as "an indicator based on statistics and the Fibonacci golden ratio", its not an indicator i'am familiar with and i don't know if its the same proposed by Elhers. The candles are smooth, high length can flatten the candles heavily making them hard to see.
Correlation Oscillator
In a range of -1/1 this indicator is quite smooth and can also flatten candles.
Patterns And Heikin-Ashi
There are tons of patterns that can be generated from candlesticks, they can be applied to this indicator as well.
The indicator can show an heikin-ashi mode, heikin-ashi candlestick use averaging to plot candles, this is why they appear smoother, some signals generated from heikin-ashi candles are :
Bullish body with no lower shadows = Strong Uptrend
Bearish body with no higher shadows = Strong Downtrend
High range and small body = Indecision/Risk of reversal
Conclusion
I made an indicator able to draw candles from other indicators, those candles contain various information that can generate decision from patterns. I hope you find a use to it, if its the case share your findings with me, maybe that you will even be able find a new candlestick pattern :)
Thanks for reading !

Moving Gain Loss PercentTracks the percentage gain/loss in three ranges:
single candle (can be turned on or off)
custom range of candles
custom range of candles
For example, with a range of 3 candles, and the serie:
1 - close 10
2 - close 5
3 - close 20
The moving gain would be:
1 - close 10 - gain 10, infinite%
2 - close 5 - gain 5, infinite%
3 - close 18 - gain 8, 80%
Or, for example if the range is 12 candles on a monthly chart, then the result is the Year-To-Date gain/loss plotted as a percentage.

High Performance Candlestick Patterns Colors//Candle Patterns Ranked by Performance THOMAS N. BULKOWSKI
//1. Bearish Three Line Strike +Up 67.38%
//2. Bullish Three Line Strike -Down 65.23%
//3. Bearish Three Black Crows -Down 59.83%
//4. Bearish Evening Star -Down 55.85%
//5. Bullish Upside Tasuki Gap +Up 54.44%
//6. Bullish Inverted Hammer -Down 51.73%
//7. Bullish Matching Low -Down 50.00%
//8. Bullish Abandone Baby +Up 49.73%
//9. Bearish Two Black Gapping -Down 49.64%
//10. Brearish Breakaway -Down 49.24%
//11. Bullish Morning Star +Up 49.05%
//12. Bullish Piercing Line +Up 48.37%
//13. Bullish Stick Sandwich +Up 48.20%
//14. Bearish Thrusting Line During Dowtrend +Up 48.10%
//15. Bearish Meeting Line +Up 48.07%
//Down=Yellow Bar Color and Black Text
//Up=Blue Bar Color and Blue Text
//High Performance Candlestick Patterns Colors Top 15
