StarStrat Ceres Strategy [0.3.1]2025ETH 30M Composite Golden Indicator Trend Strategy
This strategy is designed for Ethereum 30-minute timeframe, utilizing composite golden indicators combined with trend indicators for trade signal identification.
Trading Logic:
- Entry: Triggered when composite golden indicator and trend indicator confirm same direction
- Exit: Partial profit-taking mechanism with customizable parameters for each position
- Risk Management: Built-in risk coefficient, recommended setting at 1%
All key parameters are adjustable to adapt to different trading styles.
Risk Disclaimer: For educational and research purposes only. Not investment advice. Cryptocurrency trading involves high risk, please trade cautiously.
Candlestick analysis

Buy The Dip - ENGThis script implements a grid trading strategy for long positions in the USDT market. The core idea is to place a series of buy limit orders at progressively lower prices below an initial entry point, aiming to lower the average entry price as the price drops. It then aims to exit the entire position when the price rises a certain percentage above the average entry price.
Here's a detailed breakdown:
1. Strategy Setup (`strategy` function):
`'거미줄 자동매매 250227'`: The name of the strategy.
`overlay = true`: Draws plots and labels directly on the main price chart.
`pyramiding = 15`: Allows up to 15 entries in the same direction (long). This is essential for grid trading, as it needs to open multiple buy orders.
`initial_capital = 600`: Sets the starting capital for backtesting to 600 USDT.
`currency = currency.USDT`: Specifies the account currency as USDT.
`margin_long/short = 0`: Doesn't define specific margin requirements (might imply spot trading logic or rely on exchange defaults if used live).
`calc_on_order_fills = false`: Strategy calculations happen on each bar's close, not just when orders fill.
2. Inputs (`input`):
Core Settings:
`lev`: Leverage (default 10x). Used to calculate position sizes.
`Investment Percentage %`: Percentage of total capital to allocate to the initial grid (default 80%).
`final entry Percentage %`: Percentage of the *remaining* capital (100 - `Investment Percentage %`) to use for the "semifinal" entry (default 50%). The rest goes to the "final" entry.
`Price Adjustment Length`: Lookback period (default 4 bars) to determine the initial `maxPrice`.
`price range`: The total percentage range downwards from `maxPrice` where the grid orders will be placed (default -10%, meaning 10% down).
`tp`: Take profit percentage above the average entry price (default 0.45%).
`semifinal entry price percent`: Percentage drop from `maxPrice` to trigger the "semifinal" larger entry (default -12%).
`final entry price percent`: Percentage drop from `maxPrice` to trigger the "final" larger entry (default -15%).
Rounding & Display:
`roundprice`, `round`: Decimal places for rounding price and quantity calculations.
`texts`, `label_style`: User interface preferences for text size and label appearance on the chart.
Time Filter:
`startTime`, `endTime`: Defines the date range for the backtest.
3. Calculations & Grid Setup:
`maxPrice`: The highest price point for the grid setup. Calculated as the lowest low of the previous `len` bars only if no trades are open. If trades are open, it uses the entry price of the very first order placed in the current sequence (`strategy.opentrades.entry_price(0)`).
`minPrice`: The lowest price point for the grid, calculated based on `maxPrice` and `range1`.
`totalCapital`: The amount of capital (considering leverage and `per1`) allocated for the main grid orders.
`coinRatios`: An array ` `. This defines the *relative* size ratio for each of the 11 grid orders. Later orders (at lower prices) will be progressively larger.
`totalRatio`: The sum of all ratios (66).
`positionSizes`: An array calculated based on `totalCapital` and `coinRatios`. It determines the actual quantity (size) for each of the 11 grid orders.
4. Order Placement Logic (`strategy.entry`):
Initial Grid Orders:
Runs only if within the specified time range and no position is currently open (`strategy.opentrades == 0`).
A loop places 11 limit buy orders (`Buy 1` to `Buy 11`).
Prices are calculated linearly between `maxPrice` and `minPrice`.
Order sizes are taken from the `positionSizes` array.
Semifinal & Final Entries:
Two additional, larger limit buy orders are placed simultaneously with the grid orders:
`semifinal entry`: At `maxPrice * (1 - semifinal / 100)`. Size is based on `per2`% of the capital *not* used by the main grid (`1 - per1`).
`final entry`: At `maxPrice * (1 - final / 100)`. Size is based on the remaining capital (`1 - per2`% of the unused portion).
5. Visualization (`line.new`, `label.new`, `plot`, `plotshape`, `plotchar`):
Grid Lines & Labels:
When a position is open (`strategy.opentrades > 0`), horizontal lines and labels are drawn for each of the 11 grid order prices and the "final" entry price.
Lines extend from the bar where the *first* entry occurred.
Labels show the price and planned size for each level.
Dynamic Coloring: If the price drops below a grid level, the corresponding line turns green, and the label color changes, visually indicating that the level has been reached or filled.
Plotted Lines:
`maxPrice` (initial high point for the grid).
`strategy.position_avg_price` (current average entry price of the open position, shown in red).
Target Profit Price (`strategy.position_avg_price * (1 + tp / 100)`, shown in green).
Markers:
A flag marks the `startTime`.
A rocket icon (`🚀`) appears below the bar where the `final entry` triggers.
A stop icon (`🛑`) appears below the bar where the `semifinal entry` triggers.
6. Exit Logic (`strategy.exit`, `strategy.entry` with `qty=0`):
Main Take Profit (`Full Exit`):
Uses `strategy.entry('Full Exit', strategy.short, qty = 0, limit = target2)`. This places a limit order to close the entire position (`qty=0`) at the calculated take profit level (`target2 = avgPrice * (1 + tp / 100)`). Note: Using `strategy.entry` with `strategy.short` and `qty=0` is a way to close a long position, though `strategy.exit` is often clearer. This exit seems intended to apply whenever any part of the grid position is open.
First Order Trailing Stop (`1st order Full Exit`):
Conditional: Only active if `trail` input is true AND the *last* order filled was "Buy 1" (meaning only the very first grid level was entered).
Uses `strategy.exit` with `trail_points` and `trail_offset` based on ATR values to implement a trailing stop loss/profit mechanism for this specific scenario.
This trailing stop order is cancelled (`strategy.cancel`) if any subsequent grid orders ("Buy 2", etc.) are filled.
Final/Semifinal Take Profit (`final Full Exit`):
Conditional: Only active if more than 11 entries have occurred (meaning either the "semifinal" or "final" entry must have triggered).
Uses `strategy.exit` to place a limit order to close the entire position at the take profit level (`target3 = avgPrice * (1 + tp / 100)`).
7. Information Display (Tables & UI Label):
`statsTable` (Top Right):
A comprehensive table displaying grouped information:
Market Info (Entry Point, Current Price)
Position Info (Avg Price, Target Price, Unrealized PNL $, Unrealized PNL %, Position Size, Position Value)
Strategy Performance (Realized PNL $, Realized PNL %, Initial/Total Balance, MDD, APY, Daily Profit %)
Trade Statistics (Trade Count, Wins/Losses, Win Rate, Cumulative Profit)
`buyAvgTable` (Bottom Left):
* Shows the *theoretical* entry price and average position price if trades were filled sequentially up to each `buy` level (buy1 to buy10). It uses hardcoded percentage drops (`buyper`, `avgper`) based on the initial `maxPrice` and `coinRatios`, not the dynamically changing actual average price.
`uiLabel` (Floating Label on Last Bar):
Updates only on the most recent bar (`barstate.islast`).
Provides real-time context when a position is open: Size, Avg Price, Current Price, Open PNL ($ and %), estimated % drop needed for the *next* theoretical buy (based on `ui_gridStep` input), % rise needed to hit TP, and estimated USDT profit at TP.
Shows "No Position" and basic balance/trade info otherwise.
In Summary:
This is a sophisticated long-only grid trading strategy. It aims to:
1. Define an entry range based on recent lows (`maxPrice`).
2. Place 11 scaled-in limit buy orders within a percentage range below `maxPrice`.
3. Place two additional, larger buy orders at deeper percentage drops (`semifinal`, `final`).
4. Calculate the average entry price as orders fill.
5. Exit the entire position for a small take profit (`tp`) above the average entry price.
6. Offer a conditional ATR trailing stop if only the first order fills.
7. Provide extensive visual feedback through lines, labels, icons, and detailed information tables/UI elements.
Keep in mind that grid strategies can perform well in ranging or slowly trending markets but can incur significant drawdowns if the price trends strongly against the position without sufficient retracements to hit the take profit. The leverage (`lev`) input significantly amplifies both potential profits and losses.

US Index First Candle Breakout with FVGStrategy Description: US Index First Candle Breakout with FVG
Works on NG1! and YM1! for maximised profit.
Overview:
The "US Index First Candle Breakout with FVG" strategy is designed to capitalize on the volatility present during the first minutes of the U.S. stock market opening. By focusing on the initial 5-minute candle, this strategy identifies key price levels that can serve as breakout points for potential trading opportunities.
Key Features:
1. Breakout Strategy:
The strategy tracks the high and low of the first 5-minute candle after the market opens at 9:30 AM (New York time). These levels are critical indicators for potential price movements.
A long position is triggered when the price breaks above the high of the first candle, while a short position is initiated when the price drops below the low.
2. Manual Trade Direction Filter: (developing)
Users can select their preferred trading direction through a customizable input:
Buy only: Execute long trades only.
Sell only: Execute short trades only.
Both: Allow trades in both directions.
This feature enables traders to align the strategy with their market outlook and risk tolerance.
3. Fair Value Gap (FVG) Analysis:
The strategy incorporates an FVG filter to enhance trade precision. It assesses market gaps to identify whether a breakout is supported by underlying market dynamics.
The algorithm checks for conditions that indicate a valid breakout based on previous price action, ensuring that trades are made on strong signals.
4. Risk Management:
A customizable risk per trade setting allows users to define their risk tolerance in ticks.
The strategy includes a reward-to-risk ratio input, enabling traders to set their take-profit levels based on their risk preferences.
Stop-loss levels are automatically calculated based on the breakout direction, helping to safeguard against unexpected price movements.
5. Automatic Trade Execution:
Trades are executed automatically based on the defined conditions, reducing the need for manual intervention and allowing traders to capitalize on market movements in real-time.
Session End Closure:
The strategy automatically closes all open positions at 4:00 PM (New York time), ensuring that trades do not carry overnight risk.
How to Use the Strategy:
Simply add the script to your TradingView chart, set your desired parameters, and select your preferred trade direction.
Monitor for breakout signals during the first trading session, and let the automated system handle trade entries and exits based on your specifications.
Conclusion:
The "US Index First Candle Breakout with FVG" strategy is ideal for traders seeking to leverage early market volatility with a structured approach. By combining breakout techniques with FVG analysis and customizable trade direction, this strategy offers a robust framework for navigating the complexities of the U.S. stock market's opening dynamics.

Aether SignalAether Signal is a professional TradingView indicator engineered for advanced traders who demand precise analysis, smart money concepts, and robust risk management. It systematically incorporates institutional trading techniques, automated level detection, and multi-level profit-taking for exceptional trade execution.
Support & Resistance: Aether Signal automatically identifies key support and resistance levels using mathematically rigorous algorithms, ensuring that traders see the most significant price barriers for their entries and exits.
Smart Money Concepts: The indicator is grounded in institutional trading logic, analyzing market structure to pinpoint where large market participants are engaging. It leverages volume and price interaction at critical zones, similar to harmonic liquidity nodes in professional strategies.
Precise Entry Points: Entry signals are generated when strict confluence conditions are met, ensuring signals align with underlying market structure, high-volume footprints, and optimal momentum. Stops are logically placed just beyond the validated support or resistance—on the opposite side of the key zone.
Triple Take Profits: Aether Signal equips traders to maximize returns with three intelligently placed take profit levels (TP1, TP2, TP3), allowing for strategic scaling out and adaptive trade management.
Supply & Demand Zones: The indicator scans for market imbalances by identifying high-probability supply and demand areas driven by institutional activity and volume anomalies, guiding traders toward potent reversal or continuation setups.
Advanced Risk Management: Robust risk controls are integrated, including logical stop loss suggestions and trade selection filters, to minimize overtrading and enhance consistency.
Win Rate: The system claims a win rate of up to 96% under optimal settings and strict adherence to its entry criteria, setting a high benchmark for performance (note: actual results may vary depending on market conditions and trader discipline).
Aether Signal is tailored for traders seeking the edge of institutional-grade analytics—offering comprehensive structure analysis, actionable alerts, and performance-focused features that merge automation with trader control.


Refined MA + Engulfing (M5 + Confirmed Structure Break)I would like to start by saying that this strategy was put together using ChatGPT, some past trades from myself and some backtested trades, and from my time as a student in Wallstreet Academy under Cue Banks.
I am not profitable yet. I am too jumpy and blow accounts. I'm hoping this strategy (and it's indicator twin) can help me spend less time on the charts, so that I'm not tempted to press buttons as much.
It does fire quite a bit. But, the Strategy Tester tab shows a 30% win rate with our wins being significant to our losses. So, in theory, if you followed the rules of this strategy STRICTLY, you COULD BE profitable.
With that being said, there are times that this strategy has shown to trigger and I ask, "Why?".
I just want to help myself and others, and maybe make some decent\cool stuff along the way. Enjoy
KR

Swing FX Pro Panel v1Description:
"Swing FX Pro Panel v1" is a professional swing trading strategy tailored for the Forex market and other highly liquid assets. The core logic is based on the crossover of two Exponential Moving Averages (EMA), allowing the strategy to detect trend shifts and generate precise entry signals.
The script includes an interactive performance panel that dynamically displays:
initial capital,
risk per trade (%),
the number of trades taken during a selected period (e.g., 6 months),
win/loss statistics,
ROI (Return on Investment),
maximum drawdown,
win ratio.

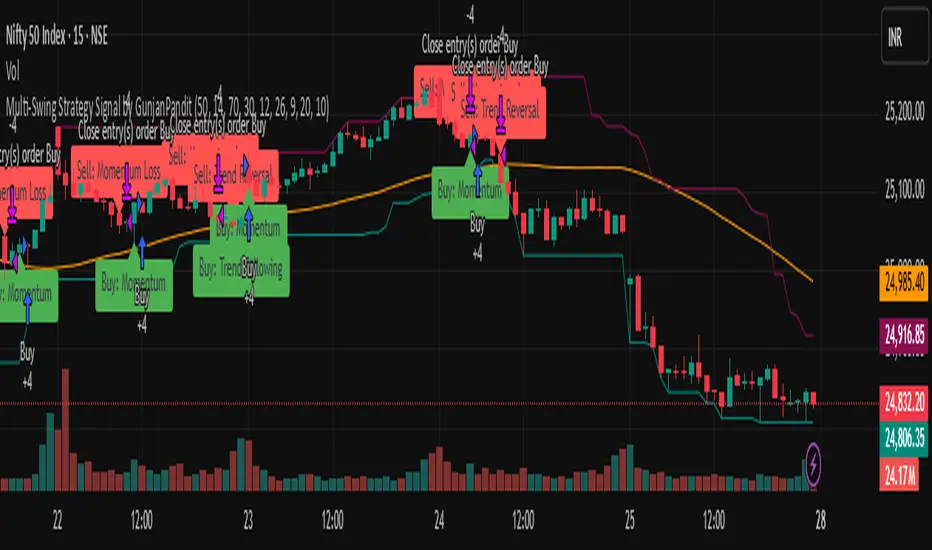
Multi-Swing Strategy Signal by GunjanPandit🌀 Swing Strategy Signal Pack (India/Global) 🌀
This public indicator highlights BUY and SELL points using six popular swing trading methods:
1. Trend Following – via 50-day SMA crossover.
2. Support & Resistance – using 20-bar highs/lows.
3. Momentum – via RSI cross 50.
4. Breakouts – detects moves beyond key swing levels.
5. Reversals – using MACD crossovers + RSI divergence zones.
6. Consolidation – detects breakouts after price compression.
Each signal is labeled with its triggering strategy. Best used on DAILY charts with NSE stocks, indices, or any liquid instruments.
✅ Educational Use Only. ❌ No financial advice. ❌ No performance promises.
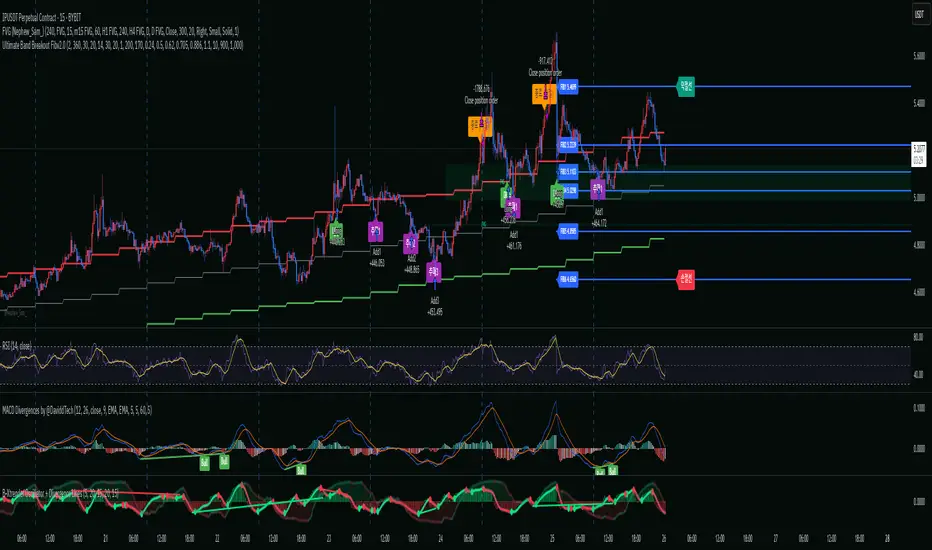
Ultimate Band Breakout Fibv2.0🔍 Key Features:
Breakout Detection (Selectable):
Envelope Upper Band breakout
Ultimate Band breakout (w/ optional high checks)
Fibonacci Retracement Entries:
Automatically draws 6 retracement levels from peak to low (based on RSI oversold or lowest low)
Enters at FIB2 and adds at FIB3, FIB4, FIB5
Exit Logic:
TP via Fibonacci Level 1 or % Take-Profit (user-defined)
SL via FIB6
Optional time-based forced exit
Fully customizable:
All Fibonacci levels, risk settings, RSI/Envelope/Ultimate Band parameters
Automatic visual labeling and line drawing
Works on any timeframe and ticker
🧪 Use Cases:
This strategy is ideal for:
Traders looking for breakout-retracement entries with clearly defined risk zones
Momentum-based trading on crypto, indices, or high-volatility assets
Backtesting Fibonacci pullback scenarios with time-based risk control
⚙️ Recommendations:
Works best on volatile assets with strong trending behavior
Use on higher timeframes (15min–4H) for swing trades or lower for scalping
Test with different RSI oversold thresholds or Ultimate Band timeframes for optimization
-ps-
I do not recommend using this strategy as a fully automated system.
It’s important to develop your own judgment by analyzing higher timeframes like the 4-hour or 6-hour charts, and making sure that smart money hasn’t exited the market.
While the indicator can generate automated entries, it may often trigger trades in areas where you shouldn’t be entering.
So please don’t blindly rely on the signals or run it on auto-pilot without supervision.
Instead, I recommend creating a watchlist of coins you're interested in and setting alerts for each one.
This way, you don't need to constantly watch the charts.
When an alert is triggered, you can check the setup, confirm with your own analysis, and enter only if the conditions still look favorable.
This semi-automated approach strikes a better balance between signal automation and human discretion.
This indicator does not generate entries using Fibonacci indiscriminately — it only creates setups in high-probability zones.
That’s why using a watchlist with alerts is essential if you want to receive more signals.
🔍 주요 특징:
돌파 조건 선택 가능:
Envelope 상단 밴드 돌파
Ultimate Band 상단 돌파 (고점 조건 체크 여부 선택 가능)
피보나치 되돌림 기반 진입:
고점 → RSI 과매도 기준 저점까지 자동 피보나치 라인 생성
FIB2 지점에서 진입, FIB3/FIB4/FIB5 구간에서 추가매수
청산 조건:
FIB1 도달 시 익절 또는 사용자 지정 % 기준 익절
FIB6 도달 시 손절
시간 경과 시 강제 종료 (옵션)
높은 사용자 맞춤성:
피보나치 비율, RSI/Envelope/Ultimate Band 설정 자유롭게 조정 가능
라벨 및 라인 자동 생성으로 직관적인 시각화
모든 종목/타임프레임 대응
🧪 추천 사용 대상:
뚜렷한 추세 또는 큰 변동성을 가진 자산에 적합
눌림목 기반 진입 전략을 자동화하려는 스윙/단타 트레이더
백테스트 기반의 전략 검증 및 최적화를 원하는 사용자
⚙️ 전략 활용 팁:
15분~4시간봉에서 높은 성능을 보입니다
RSI 과매도 기준을 유연하게 조절하여 최적 진입 구간 탐색 가능
Envelope와 Ultimate Band를 상황에 따라 선택해 조합해보세요
-ps-
자동전략으로 사용은 추천하지 않습니다. 큰프레임 즉, 4시간이나 6시간 프레임을 보고 스마트머니가 빠져나가지 않았다고 스스로 판단을 하는 안목이 필요합니다. 지표에서는 진입을 자동적으로 하지만 들어가지 말아야 할곳에 들어가는 경우도 많기 때문에 무작정 지표만 믿고 자동으로 돌리지 말기 바랍니다. 추천하는것은 원하는 모든 코인을 리스트로 만들고 리스트에 얼러트를 통으로 넣을 수 있기때문에 얼러트를 통해서 계속 차트를 보고 있지 않아도 진입시점에 알람이 오기때문에 알람이 올때 지표를 확인하고 괜찮다 싶으면 진입하는 것을 추천합니다. 이 지표는 무조건 피보나치를 통해 진입이 아닌 확률이 높은 구간에서만 만들어 집니다. 그래서 리스트를 통해 얼러트를 넣어야 많은 알람을 받을 수 있습니다.
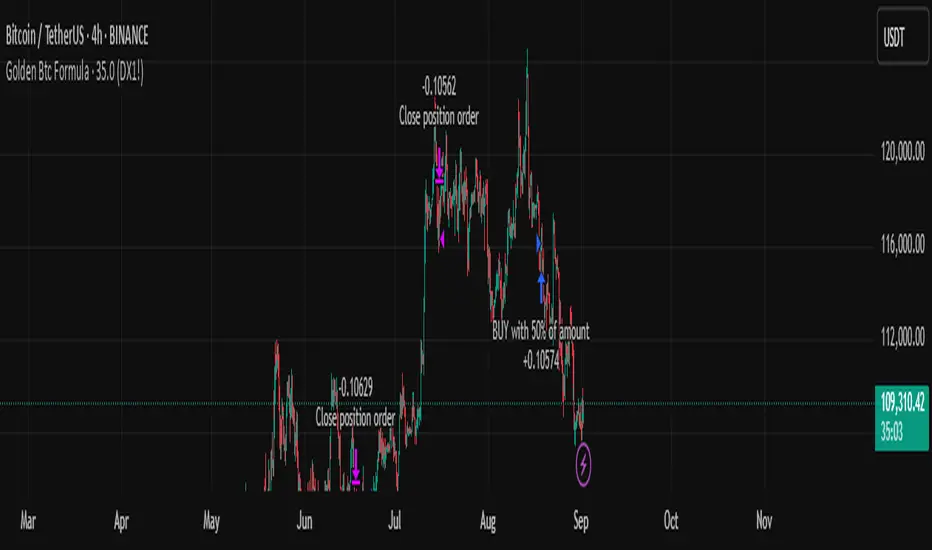
Golden Btc Formula🏆 Golden BTC Formula Bot
Introducing the Golden BTC Formula Bot — a smart trading strategy built specifically for Bitcoin on TradingView, designed to combine algorithmic precision with solid risk management.
📊 Backtest Overview:
The backtest shows that starting with a $10,000 balance and using a position size of 50% of equity per trade, the bot has delivered impressive, consistent returns over the tested period. The equity curve illustrates steady growth, minimal drawdowns, and controlled risk exposure — proving its robustness even in volatile market conditions.
⚙️ How It Works:
The bot automatically detects high-probability entries based on carefully tuned indicators and price action logic.
Targets and stop-loss levels are dynamically calculated to adapt to market volatility.
Built entirely in Pine Script for TradingView, so you can watch trades live or backtest historically.
🛡️ Risk Management Tips:
Even with a strong backtest, real trading always involves risk. Here’s how to use the Golden BTC Formula Bot responsibly:
✅ Use only part of your capital (e.g., 30–50%) for the bot.
✅ Set reasonable leverage (or stick to spot trading).
✅ Withdraw profits periodically instead of letting them fully compound forever.
✅ Always backtest and forward-test before going live, and consider running it in paper trading mode at first.
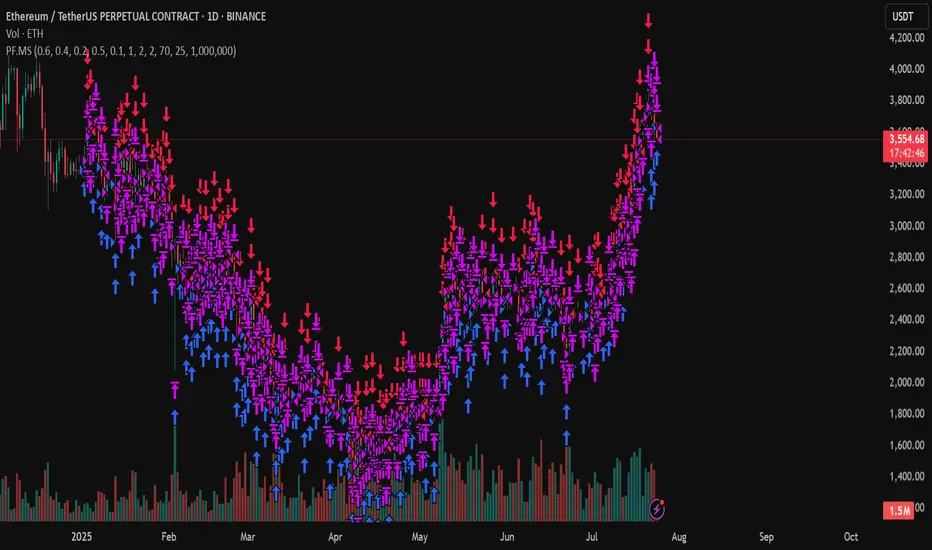
PF.MSThe Pressure & Flow Momentum Strategy (PF.MS) detects market pressure buildup through advanced candlestick analysis and captures momentum flow when conditions align, providing accurate buy and sell signals across cryptocurrencies and stocks—but even sophisticated strategies can be wrong when markets turn brutal without warning. The system reads real-time pressure dynamics (buying vs selling forces, wick patterns, volatility conditions) to identify when smart money is positioning, then captures the resulting momentum flow with precise entry and exit timing. While highly accurate at detecting pressure shifts and momentum changes, the strategy can still face losses during sudden news events or when market sentiment overrides technical patterns. The PF.MS combines intelligent pressure detection with momentum capture, trailing profit protection and strict stop losses
Bollinger + Supertrend Hybrid Pro (Auto-Backtest)This strategy tell you when to huy and sell it is bollinger and supertrend

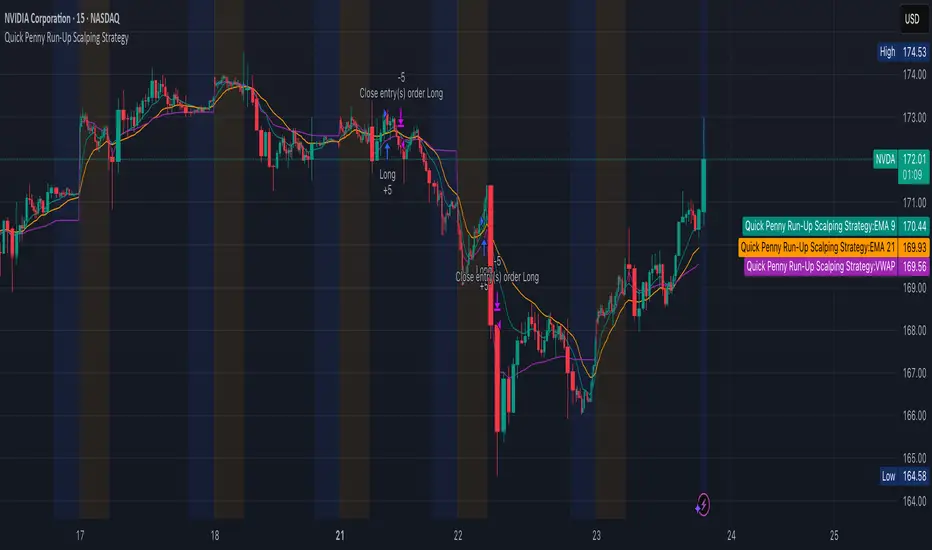
Quick Penny Run-Up Scalping StrategyQuick Penny Run-Up Scalping Strategy. Use it for 15 min within two hours
CVD Divergence + Volume HMA RSI MACD StrategyHow the script works:
The script calculates the HMA for trend direction. The HMA (shown in orange) is used as a filter: long trades are taken only if price is above the HMA, and short trades when below.
The CVD is computed by cumulatively adding volume on up bars and subtracting volume on down bars.
Pivot routines (with the input "Pivot Length") detect swing lows/highs for both price and CVD. A bullish divergence is flagged when the price makes a lower low while the CVD makes a higher low. Similarly, a bearish divergence is flagged when the price makes a higher high while the CVD makes a lower high.
Trading is triggered when the divergence condition also agrees with the HMA filter.
Feel free to further adjust the parameters or add risk‐management/exit rules as needed for your trading style.

LANZ Strategy 5.0 [Backtest]🔷 LANZ Strategy 5.0 — Rule-Based BUY Logic with Time Filter, Session Limits and Auto SL/TP Execution
This is the backtest version of LANZ Strategy 5.0, built as a strategy script to evaluate real performance under fixed intraday conditions. It automatically places BUY and SELL trades based on structured candle confirmation, EMA trend alignment, and session-based filters. The system simulates real-time execution with precise Stop Loss and Take Profit levels.
📌 Built for traders seeking to simulate clean intraday logic with fully automated entries and performance metrics.
🧠 Core Logic & Strategy Conditions
✅ BUY Signal Conditions:
Price is above the EMA200
The last 3 candles are bullish (close > open)
The signal occurs within the defined session window (NY time)
Daily trade limit has not been exceeded
If all are true, a BUY order is executed at market, with SL and TP set immediately.
🔻 SELL Signal Conditions (Optional):
Exactly inverse to BUY (below EMA + 3 bearish candles). Disabled by default.
🕐 Operational Time Filter (New York Time)
You can fully customize your intraday window:
Start Time: e.g., 01:15 NY
End Time: e.g., 16:00 NY
The system evaluates signals only within this range, even across midnight if configured.
🔁 Trade Management System
One trade at a time per signal
Trades include a Stop Loss (SL) and Take Profit (TP) based on pip distance
Trade result is calculated automatically
Each signal is shown with a triangle marker (BUY only, by default)
🧪 Backtest Accuracy
This version uses:
strategy.order() for entries
strategy.exit() for SL and TP
strategy.close_all() at the configured manual closing time
This ensures realistic behavior in the TradingView strategy tester.
⚙️ Flow Summary (Step-by-Step)
On every bar, check:
Is the time within the operational session?
Is the price above the EMA?
Are the last 3 candles bullish?
If conditions met → A BUY trade is opened:
SL = entry – X pips
TP = entry + Y pips
Trade closes:
If SL or TP is hit
Or at the configured manual close time (e.g., 16:00 NY)
📊 Settings Overview
Timeframe: 1-hour (ideal)
SL/TP: Configurable in pips
Max trades/day: User-defined (default = 99 = unlimited)
Manual close: Adjustable by time
Entry type: Market (not limit)
Visuals: Plotshape triangle for BUY entry
👨💻 Credits:
💡 Developed by: LANZ
🧠 Strategy logic & execution: LANZ
✅ Designed for: Clean backtesting, clarity in execution, and intraday logic simulation

Pullback Pro Dow Strategy v7 (ADX Filter)
### **Strategy Description (For TradingView)**
#### **Title:** Pullback Pro: Dow Theory & ADX Strategy
---
#### **1. Summary**
This strategy is designed to identify and trade pullbacks within an established trend, based on the core principles of Dow Theory. It uses market structure (pivot highs and lows) to determine the trend direction and an Exponential Moving Average (EMA) to pinpoint pullback entry opportunities.
To enhance trade quality and avoid ranging markets, an ADX (Average Directional Index) filter is integrated to ensure that entries are only taken when the trend has sufficient momentum.
---
#### **2. Core Logic: How It Works**
The strategy's logic is broken down into three main steps:
**Step 1: Trend Determination (Dow Theory)**
* The primary trend is identified by analyzing recent pivot points.
* An **Uptrend** is confirmed when the script detects a pattern of higher highs and higher lows (HH/HL).
* A **Downtrend** is confirmed by a pattern of lower highs and lower lows (LH/LL).
* If neither pattern is present, the strategy considers the market to be in a range and will not seek trades.
**Step 2: Entry Signal (Pullback to EMA)**
* Once a clear trend is established, the strategy waits for a price correction.
* **Long Entry:** In a confirmed uptrend, a long position is initiated when the price pulls back and crosses *under* the specified EMA.
* **Short Entry:** In a confirmed downtrend, a short position is initiated when the price rallies and crosses *over* the EMA.
**Step 3: Confirmation & Risk Management**
* **ADX Filter:** To ensure the trend is strong enough to trade, an entry signal is only validated if the ADX value is above a user-defined threshold (e.g., 25). This helps filter out weak signals during choppy or consolidating markets.
* **Stop Loss:** The initial Stop Loss is automatically and logically placed at the last market structure point:
* For long trades, it's placed at the `lastPivotLow`.
* For short trades, it's placed at the `lastPivotHigh`.
* **Take Profit:** Two Take Profit levels are calculated based on user-defined Risk-to-Reward (R:R) ratios. The strategy allows for partial profit-taking at the first target (TP1), moving the remainder of the position to the second target (TP2).
---
#### **3. Input Settings Explained**
**① Dow Theory Settings**
* **Pivot Lookback Period:** Determines the sensitivity for detecting pivot highs and lows. A smaller number makes it more sensitive to recent price swings; a larger number focuses on more significant, longer-term pivots.
**② Entry Logic (Pullback)**
* **Pullback EMA Length:** Sets the period for the Exponential Moving Average used to identify pullback entries.
**③ Risk & Exit Management**
* **Take Profit 1 R:R:** Sets the Risk-to-Reward ratio for the first take-profit target.
* **Take Profit 1 (%):** The percentage of the position to be closed when TP1 is hit.
* **Take Profit 2 R:R:** Sets the Risk-to-Reward ratio for the final take-profit target.
**④ Filters**
* **Use ADX Trend Filter:** A master switch to enable or disable the ADX filter.
* **ADX Length:** The lookback period for the ADX calculation.
* **ADX Threshold:** The minimum ADX value required to confirm a trade signal. Trades will only be placed if the ADX is above this level.
---
#### **4. Best Practices & Recommendations**
* This is a trend-following system. It is designed to perform best in markets that exhibit clear, sustained trending behavior.
* It may underperform in choppy, sideways, or strongly ranging markets. The ADX filter is designed to help mitigate this, but no filter is perfect.
* **Crucially, you must backtest this strategy thoroughly** on your preferred financial instrument and timeframe before considering any live application.
* Experiment with the `Pivot Lookback Period`, `Pullback EMA Length`, and `ADX Threshold` to optimize performance for a specific market's characteristics.
---
#### **DISCLAIMER**
This script is provided for educational and informational purposes only. It does not constitute financial advice. All trading involves a high level of risk, and past performance is not indicative of future results. You are solely responsible for your own trading decisions. The author assumes no liability for any financial losses you may incur from using this strategy. Always conduct your own research and due diligence.

Strategi FVG 09:31 (Pro)FVG 09:31 Strategy (Pro)
In short, this is an automated trading strategy (bot) for TradingView designed to execute buy or sell orders based on a Fair Value Gap (FVG) pattern. The strategy is highly specific, as it only triggers on the 1-minute timeframe and looks for an FVG that forms precisely at 09:32 AM New York time.
Main Purpose of the Strategy
The primary goal of this script is to identify and capitalize on short-term price imbalances, known as Fair Value Gaps (FVGs). It operates during a specific, high-volatility window right after the U.S. stock market opens, often referred to by traders as the "Silver Bullet" session. By automating the detection and execution, it aims to trade these fleeting opportunities with precision.
How the Strategy Works
The strategy follows a clear, step-by-step logical flow on your chart.
1. Time & Timeframe Restriction
1-Minute Timeframe: The strategy is hard-coded to work only on the 1-minute (1m) chart. A warning label will appear on your chart if you apply it to any other timeframe.
Specific Time Window: The core logic activates only between 09:32 and 09:33 AM New York time. It searches for an FVG pattern formed by the three candles from 09:29, 09:30, and 09:31, with the pattern confirmation happening on the close of the 09:31 candle.
2. Fair Value Gap (FVG) Detection
An FVG is a three-candle pattern that signals a price imbalance.
Bullish FVG (Potential Buy): Occurs when the low of the first candle is higher than the high of the third candle. The space between these two prices is the FVG zone.
Bearish FVG (Potential Sell): Occurs when the high of the first candle is lower than the low of the third candle. The space between these two prices is the FVG zone.
If this pattern is detected at the target time, the strategy draws a colored box on the chart to visualize the FVG zone (aqua for bullish, fuchsia for bearish).
3. Entry Logic
The strategy provides two user-selectable methods for entering a trade:
Retracement (Immediate Entry): The strategy will open a position with a market order as soon as the price retraces back into the identified FVG zone.
For a Bullish FVG, a Long (buy) position is opened when the price drops to touch the upper boundary of the FVG.
For a Bearish FVG, a Short (sell) position is opened when the price rises to touch the lower boundary of the FVG.
Limit Order (Pending Entry): The strategy places a pending limit order at the edge of the FVG zone.
For a Bullish FVG, a Buy Limit order is placed at the upper boundary of the FVG.
For a Bearish FVG, a Sell Limit order is placed at the lower boundary of the FVG.
Order Expiration: If the limit order is not filled within a specified number of candles (default is 15), it is automatically canceled to avoid chasing a stale setup.
4. Exit Logic
Once a position is active, the strategy automatically manages the exit by setting a Take Profit (TP) and Stop Loss (SL) level. You can choose between two types:
Ticks (Fixed Points): You define a fixed profit target and loss limit in ticks (the smallest price movement). For example, a 200-tick TP and a 100-tick SL.
Last Swing (Dynamic Levels): The TP and SL are set dynamically based on the most recent swing high or swing low.
For a Long position: Take Profit is set at the last swing high; Stop Loss is at the last swing low.
For a Short position: Take Profit is set at the last swing low; Stop Loss is at the last swing high.
5. Daily Management
At the start of each new trading day, the script performs a reset. All variables, including any FVG data from the previous day, are cleared. This ensures the strategy only acts on fresh signals from the current day and cancels any pending orders from the day before.
Explanation of Settings (Inputs)
Here is what each user-configurable setting does:
Entry Type: Choose your preferred entry method: Retracement or Limit Order.
Order Expiration (Candles): Applies only to the Limit Order type. Sets how many candles an unfilled order will remain active before being canceled.
Stop Loss Type: Choose Ticks for a fixed-distance stop loss or Last Swing for a dynamic level.
Take Profit Type: Choose Ticks for a fixed-distance profit target or Last Swing for a dynamic level.
Pivot Lookback (SL/TP Swing): Defines how many candles the script looks back to identify the most recent swing high/low for the Last Swing SL/TP type.
Contract Size: The quantity or lot size for each trade.
Take Profit (in Ticks): The profit target distance if using the Ticks type.
Stop Loss (in Ticks): The maximum loss distance if using the Ticks type.

Multi-Confluence Swing Hunter V1# Multi-Confluence Swing Hunter V1 - Complete Description
Overview
The Multi-Confluence Swing Hunter V1 is a sophisticated low timeframe scalping strategy specifically optimized for MSTR (MicroStrategy) trading. This strategy employs a comprehensive point-based scoring system that combines optimized technical indicators, price action analysis, and reversal pattern recognition to generate precise trading signals on lower timeframes.
Performance Highlight:
In backtesting on MSTR 5-minute charts, this strategy has demonstrated over 200% profit performance, showcasing its effectiveness in capturing rapid price movements and volatility patterns unique to MicroStrategy's trading behavior.
The strategy's parameters have been fine-tuned for MSTR's unique volatility characteristics, though they can be optimized for other high-volatility instruments as well.
## Key Innovation & Originality
This strategy introduces a unique **dual scoring system** approach:
- **Entry Scoring**: Identifies swing bottoms using 13+ different technical criteria
- **Exit Scoring**: Identifies swing tops using inverse criteria for optimal exit timing
Unlike traditional strategies that rely on simple indicator crossovers, this system quantifies market conditions through a weighted scoring mechanism, providing objective, data-driven entry and exit decisions.
## Technical Foundation
### Optimized Indicator Parameters
The strategy utilizes extensively backtested parameters specifically optimized for MSTR's volatility patterns:
**MACD Configuration (3,10,3)**:
- Fast EMA: 3 periods (vs standard 12)
- Slow EMA: 10 periods (vs standard 26)
- Signal Line: 3 periods (vs standard 9)
- **Rationale**: These faster parameters provide earlier signal detection while maintaining reliability, particularly effective for MSTR's rapid price movements and high-frequency volatility
**RSI Configuration (21-period)**:
- Length: 21 periods (vs standard 14)
- Oversold: 30 level
- Extreme Oversold: 25 level
- **Rationale**: The 21-period RSI reduces false signals while still capturing oversold conditions effectively in MSTR's volatile environment
**Parameter Adaptability**: While optimized for MSTR, these parameters can be adjusted for other high-volatility instruments. Faster-moving stocks may benefit from even shorter MACD periods, while less volatile assets might require longer periods for optimal performance.
### Scoring System Methodology
**Entry Score Components (Minimum 13 points required)**:
1. **RSI Signals** (max 5 points):
- RSI < 30: +2 points
- RSI < 25: +2 points
- RSI turning up: +1 point
2. **MACD Signals** (max 8 points):
- MACD below zero: +1 point
- MACD turning up: +2 points
- MACD histogram improving: +2 points
- MACD bullish divergence: +3 points
3. **Price Action** (max 4 points):
- Long lower wick (>50%): +2 points
- Small body (<30%): +1 point
- Bullish close: +1 point
4. **Pattern Recognition** (max 8 points):
- RSI bullish divergence: +4 points
- Quick recovery pattern: +2 points
- Reversal confirmation: +4 points
**Exit Score Components (Minimum 13 points required)**:
Uses inverse criteria to identify swing tops with similar weighting system.
## Risk Management Features
### Position Sizing & Risk Control
- **Single Position Strategy**: 100% equity allocation per trade
- **No Overlapping Positions**: Ensures focused risk management
- **Configurable Risk/Reward**: Default 5:1 ratio optimized for volatile assets
### Stop Loss & Take Profit Logic
- **Dynamic Stop Loss**: Based on recent swing lows with configurable buffer
- **Risk-Based Take Profit**: Calculated using risk/reward ratio
- **Clean Exit Logic**: Prevents conflicting signals
## Default Settings Optimization
### Key Parameters (Optimized for MSTR/Bitcoin-style volatility):
- **Minimum Entry Score**: 13 (ensures high-conviction entries)
- **Minimum Exit Score**: 13 (prevents premature exits)
- **Risk/Reward Ratio**: 5.0 (accounts for volatility)
- **Lower Wick Threshold**: 50% (identifies true hammer patterns)
- **Divergence Lookback**: 8 bars (optimal for swing timeframes)
### Why These Defaults Work for MSTR:
1. **Higher Score Thresholds**: MSTR's volatility requires more confirmation
2. **5:1 Risk/Reward**: Compensates for wider stops needed in volatile markets
3. **Faster MACD**: Captures momentum shifts quickly in fast-moving stocks
4. **21-period RSI**: Reduces noise while maintaining sensitivity
## Visual Features
### Score Display System
- **Green Labels**: Entry scores ≥10 points (below bars)
- **Red Labels**: Exit scores ≥10 points (above bars)
- **Large Triangles**: Actual trade entries/exits
- **Small Triangles**: Reversal pattern confirmations
### Chart Cleanliness
- Indicators plotted in separate panes (MACD, RSI)
- TP/SL levels shown only during active positions
- Clear trade markers distinguish signals from actual trades
## Backtesting Specifications
### Realistic Trading Conditions
- **Commission**: 0.1% per trade
- **Slippage**: 3 points
- **Initial Capital**: $1,000
- **Account Type**: Cash (no margin)
### Sample Size Considerations
- Strategy designed for 100+ trade sample sizes
- Recommended timeframes: 4H, 1D for swing trading
- Optimal for trending/volatile markets
## Strategy Limitations & Considerations
### Market Conditions
- **Best Performance**: Trending markets with clear swings
- **Reduced Effectiveness**: Highly choppy, sideways markets
- **Volatility Dependency**: Optimized for moderate to high volatility assets
### Risk Warnings
- **High Allocation**: 100% position sizing increases risk
- **No Diversification**: Single position strategy
- **Backtesting Limitation**: Past performance doesn't guarantee future results
## Usage Guidelines
### Recommended Assets & Timeframes
- **Primary Target**: MSTR (MicroStrategy) - 5min to 15min timeframes
- **Secondary Targets**: High-volatility stocks (TSLA, NVDA, COIN, etc.)
- **Crypto Markets**: Bitcoin, Ethereum (with parameter adjustments)
- **Timeframe Optimization**: 1min-15min for scalping, 30min-1H for swing scalping
### Timeframe Recommendations
- **Primary Scalping**: 5-minute and 15-minute charts
- **Active Monitoring**: 1-minute for precise entries
- **Swing Scalping**: 30-minute to 1-hour timeframes
- **Avoid**: Sub-1-minute (excessive noise) and above 4-hour (reduces scalping opportunities)
## Technical Requirements
- **Pine Script Version**: v6
- **Overlay**: Yes (plots on price chart)
- **Additional Panes**: MACD and RSI indicators
- **Real-time Compatibility**: Confirmed bar signals only
## Customization Options
All parameters are fully customizable through inputs:
- Indicator lengths and levels
- Scoring thresholds
- Risk management settings
- Visual display preferences
- Date range filtering
## Conclusion
This scalping strategy represents a comprehensive approach to low timeframe trading that combines multiple technical analysis methods into a cohesive, quantified system specifically optimized for MSTR's unique volatility characteristics. The optimized parameters and scoring methodology provide a systematic way to identify high-probability scalping setups while managing risk effectively in fast-moving markets.
The strategy's strength lies in its objective, multi-criteria approach that removes emotional decision-making from scalping while maintaining the flexibility to adapt to different instruments through parameter optimization. While designed for MSTR, the underlying methodology can be fine-tuned for other high-volatility assets across various markets.
**Important Disclaimer**: This strategy is designed for experienced scalpers and is optimized for MSTR trading. The high-frequency nature of scalping involves significant risk. Past performance does not guarantee future results. Always conduct your own analysis, consider your risk tolerance, and be aware of commission/slippage costs that can significantly impact scalping profitability.

Aftershock Playbook: Stock Earnings Drift EngineStrategy type
Event-driven post-earnings momentum engine (long/short) built for single-stock charts or ADRs that publish quarterly results.
What it does
Detects the exact earnings bar (request.earnings, lookahead_off).
Scores the surprise and launches a position on that candle’s close.
Tracks PnL: if the first leg closes green, the engine automatically re-enters on the very next bar, milking residual drift.
Blocks mid-cycle trades after a loss until the next earnings release—keeping the risk contained to one cycle.
Think of it as a sniper that fires on the earnings pop, reloads once if the shot lands, then goes silent until the next report.
Core signal inputs
Component Default Purpose
EPS Surprise % +0 % / –5 % Minimum positive / negative shock to trigger longs/shorts.
Reverse signals? Off Quick flip for mean-reversion experiments.
Time Risk Mgt. Off Optional hard exit after 45 calendar days (auto-scaled to any TF).
Risk engine
ATR-based stop (ATR × 2 by default, editable).
Bar time stop (15-min → Daily: Have to select the bar value ).
No pyramiding beyond the built-in “double-tap”.
All positions sized as % of equity via Strategy Properties.
Visual aids
Yellow triangle marks the earnings bar.
Diagnostics table (top-right) shows last Actual, Estimate, and Surprise %.
Status-line tool-tips on every input.
Default inputs
Setting Value
Positive surprise ≥ 0 %
Negative surprise ≤ –5 %
ATR stop × 2
ATR length 50
Hold horizon 350 ( 1h timeframe chart bars)
Back-test properties
Initial capital 10 000
Order size 5 % of equity
Pyramiding 1 (internal re-entry only)
Commission 0.03 %
Slippage 5 ticks
Fills Bar magnifier ✔ · On bar close ✔ · Standard OHLC ✔
How to use
Add the script to any earnings-driven stock (AAPL, MSFT, TSLA…).
Turn on Time Risk Management if you want stricter risk management
Back-test different ATR multipliers to fit the stock’s volatility.
Sync commission & slippage with your broker before forward-testing.
Important notes
Works on every timeframe from 15 min to 1 D. Sweet spot around 30min/1h
All request.earnings() & request.security() calls use lookahead_off—zero repaint.
The “double-tap” re-entry occurs once per winning cycle to avoid drift-chasing loops.
Historical stats ≠ future performance. Size positions responsibly.

Quantum Reversal# 🧠 Quantum Reversal
## **Quantitative Mean Reversion Framework**
This algorithmic trading system employs **statistical mean reversion theory** combined with **adaptive volatility modeling** to capitalize on Bitcoin's inherent price oscillations around its statistical mean. The strategy integrates multiple technical indicators through a **multi-layered signal processing architecture**.
---
## ⚡ **Core Technical Architecture**
### 📊 **Statistical Foundation**
- **Bollinger Band Mean Reversion Model**: Utilizes 20-period moving average with 2.2 standard deviation bands for volatility-adjusted entry signals
- **Adaptive Volatility Threshold**: Dynamic standard deviation multiplier accounts for Bitcoin's heteroscedastic volatility patterns
- **Price Action Confluence**: Entry triggered when price breaches lower volatility band, indicating statistical oversold conditions
### 🔬 **Momentum Analysis Layer**
- **RSI Oscillator Integration**: 14-period Relative Strength Index with modified oversold threshold at 45
- **Signal Smoothing Algorithm**: 5-period simple moving average applied to RSI reduces noise and false signals
- **Momentum Divergence Detection**: Captures mean reversion opportunities when momentum indicators show oversold readings
### ⚙️ **Entry Logic Architecture**
```
Entry Condition = (Price ≤ Lower_BB) OR (Smoothed_RSI < 45)
```
- **Dual-Condition Framework**: Either statistical price deviation OR momentum oversold condition triggers entry
- **Boolean Logic Gate**: OR-based entry system increases signal frequency while maintaining statistical validity
- **Position Sizing**: Fixed 10% equity allocation per trade for consistent risk exposure
### 🎯 **Exit Strategy Optimization**
- **Profit-Lock Mechanism**: Positions only closed when showing positive unrealized P&L
- **Trend Continuation Logic**: Allows winning trades to run until momentum exhaustion
- **Dynamic Exit Timing**: No fixed profit targets - exits based on profitability state rather than arbitrary levels
---
## 📈 **Statistical Properties**
### **Risk Management Framework**
- **Long-Only Exposure**: Eliminates short-squeeze risk inherent in cryptocurrency markets
- **Mean Reversion Bias**: Exploits Bitcoin's tendency to revert to statistical mean after extreme moves
- **Position Management**: Single position limit prevents over-leveraging
### **Signal Processing Characteristics**
- **Noise Reduction**: SMA smoothing on RSI eliminates high-frequency oscillations
- **Volatility Adaptation**: Bollinger Bands automatically adjust to changing market volatility
- **Multi-Timeframe Coherence**: Indicators operate on consistent timeframe for signal alignment
---
## 🔧 **Parameter Configuration**
| Technical Parameter | Value | Statistical Significance |
|-------------------|-------|-------------------------|
| Bollinger Period | 20 | Standard statistical lookback for volatility calculation |
| Std Dev Multiplier | 2.2 | Optimized for Bitcoin's volatility distribution (95.4% confidence interval) |
| RSI Period | 14 | Traditional momentum oscillator period |
| RSI Threshold | 45 | Modified oversold level accounting for Bitcoin's momentum characteristics |
| Smoothing Period | 5 | Noise reduction filter for momentum signals |
---
## 📊 **Algorithmic Advantages**
✅ **Statistical Edge**: Exploits documented mean reversion tendency in Bitcoin markets
✅ **Volatility Adaptation**: Dynamic bands adjust to changing market conditions
✅ **Signal Confluence**: Multiple indicator confirmation reduces false positives
✅ **Momentum Integration**: RSI smoothing improves signal quality and timing
✅ **Risk-Controlled Exposure**: Systematic position sizing and long-only bias
---
## 🔬 **Mathematical Foundation**
The strategy leverages **Bollinger Band theory** (developed by John Bollinger) which assumes that prices tend to revert to the mean after extreme deviations. The RSI component adds **momentum confirmation** to the statistical price deviation signal.
**Statistical Basis:**
- Mean reversion follows the principle that extreme price deviations from the moving average are temporary
- The 2.2 standard deviation multiplier captures approximately 97.2% of price movements under normal distribution
- RSI momentum smoothing reduces noise inherent in oscillator calculations
---
## ⚠️ **Risk Considerations**
This algorithm is designed for traders with understanding of **quantitative finance principles** and **cryptocurrency market dynamics**. The strategy assumes mean-reverting behavior which may not persist during trending market phases. Proper risk management and position sizing are essential.
---
## 🎯 **Implementation Notes**
- **Market Regime Awareness**: Most effective in ranging/consolidating markets
- **Volatility Sensitivity**: Performance may vary during extreme volatility events
- **Backtesting Recommended**: Historical performance analysis advised before live implementation
- **Capital Allocation**: 10% per trade sizing assumes diversified portfolio approach
---
**Engineered for quantitative traders seeking systematic mean reversion exposure in Bitcoin markets through statistically-grounded technical analysis.**

Canuck Trading Trader StrategyCanuck Trading Trader Strategy
Overview
The Canuck Trading Trader Strategy is a high-performance, trend-following trading system designed for NASDAQ:TSLA on a 15-minute timeframe. Optimized for precision and profitability, this strategy leverages short-term price trends to capture consistent gains while maintaining robust risk management. Ideal for traders seeking an automated, data-driven approach to trading Tesla’s volatile market, it delivers strong returns with controlled drawdowns.
Key Features
Trend-Based Entries: Identifies short-term trends using a 2-candle lookback period and a minimum trend strength of 0.2%, ensuring responsive trade signals.
Risk Management: Includes a configurable 3.0% stop-loss to cap losses and a 2.0% take-profit to lock in gains, balancing risk and reward.
High Precision: Utilizes bar magnification for accurate backtesting, reflecting realistic trade execution with 1-tick slippage and 0.1 commission.
Clean Interface: No on-chart indicators, providing a distraction-free trading experience focused on performance.
Flexible Sizing: Allocates 10% of equity per trade with support for up to 2 simultaneous positions (pyramiding).
Performance Highlights
Backtested from March 1, 2024, to June 20, 2025, on NASDAQ:TSLA (15-minute timeframe) with $1,000,000 initial capital:
Net Profit: $2,279,888.08 (227.99%)
Win Rate: 52.94% (3,039 winning trades out of 5,741)
Profit Factor: 3.495
Max Drawdown: 2.20%
Average Winning Trade: $1,050.91 (0.55%)
Average Losing Trade: $338.20 (0.18%)
Sharpe Ratio: 2.468
Note: Past performance is not indicative of future results. Always validate with your own backtesting and forward testing.
Usage Instructions
Setup:
Apply the strategy to a NASDAQ:TSLA 15-minute chart.
Ensure your TradingView account supports bar magnification for accurate results.
Configuration:
Lookback Candles: Default is 2 (recommended).
Min Trend Strength: Set to 0.2% for optimal trade frequency.
Stop Loss: Default 3.0% to cap losses.
Take Profit: Default 2.0% to secure gains.
Order Size: 10% of equity per trade.
Pyramiding: Allows up to 2 orders.
Commission: Set to 0.1.
Slippage: Set to 1 tick.
Enable "Recalculate After Order is Filled" and "Recalculate on Every Tick" in backtest settings.
Backtesting:
Run backtests over March 1, 2024, to June 20, 2025, to verify performance.
Adjust stop-loss (e.g., 2.5%) or take-profit (e.g., 1–3%) to suit your risk tolerance.
Live Trading:
Use with a compatible broker or TradingView alerts for automated execution.
Monitor execution for slippage or latency, especially given the high trade frequency (5,741 trades).
Validate in a demo account before deploying with real capital.
Risk Disclosure
Trading involves significant risk and may result in losses exceeding your initial capital. The Canuck Trading Trader Strategy is provided for educational and informational purposes only. Users are responsible for their own trading decisions and should conduct thorough testing before using in live markets. The strategy’s high trade frequency requires reliable execution infrastructure to minimize slippage and latency.

Long-Leg Doji Breakout StrategyThe Long-Leg Doji Breakout Strategy is a sophisticated technical analysis approach that capitalizes on market psychology and price action patterns.
Core Concept: The strategy identifies Long-Leg Doji candlestick patterns, which represent periods of extreme market indecision where buyers and sellers are in equilibrium. These patterns often precede significant price movements as the market resolves this indecision.
Pattern Recognition: The algorithm uses strict mathematical criteria to identify authentic Long-Leg Doji patterns. It requires the candle body to be extremely small (≤0.1% of the total range) while having long wicks on both sides (at least 2x the body size). An ATR filter ensures the pattern is significant relative to recent volatility.
Trading Logic: Once a Long-Leg Doji is identified, the strategy enters a "waiting mode," monitoring for a breakout above the doji's high (long signal) or below its low (short signal). This confirmation approach reduces false signals by ensuring the market has chosen a direction.
Risk Management: The strategy allocates 10% of equity per trade and uses a simple moving average crossover for exits. Visual indicators help traders understand the pattern identification and trade execution process.
Psychological Foundation: The strategy exploits the natural market cycle where uncertainty (represented by the doji) gives way to conviction (the breakout), creating high-probability trading opportunities.
The strength of this approach lies in its ability to identify moments when market sentiment shifts from confusion to clarity, providing traders with well-defined entry and exit points while maintaining proper risk management protocols.
How It Works
The strategy operates on a simple yet powerful principle: identify periods of market indecision, then trade the subsequent breakout when the market chooses direction.
Step 1: Pattern Detection
The algorithm scans for Long-Leg Doji candles, which have three key characteristics:
Tiny body (open and close prices nearly equal)
Long upper wick (significant rejection of higher prices)
Long lower wick (significant rejection of lower prices)
Step 2: Confirmation Wait
Once a doji is detected, the strategy doesn't immediately trade. Instead, it marks the high and low of that candle and waits for a definitive breakout.
Step 3: Trade Execution
Long Entry: When price closes above the doji's high
Short Entry: When price closes below the doji's low
Step 4: Exit Strategy
Positions are closed when price crosses back through a 20-period moving average, indicating potential trend reversal.
Market Psychology Behind It
A Long-Leg Doji represents a battlefield between bulls and bears that ends in a stalemate. The long wicks show that both sides tried to push price in their favor but failed. This creates a coiled spring effect - when one side finally gains control, the move can be explosive as trapped traders rush to exit and momentum traders jump aboard.
Key Parameters
Doji Body Threshold (0.1%): Ensures the body is truly small relative to the candle's range
Wick Ratio (2.0): Both wicks must be at least twice the body size
ATR Filter: Uses Average True Range to ensure the pattern is significant in current market conditions
Position Size: 10% of equity per trade for balanced risk management
Pros:
High Probability Setups: Doji patterns at key levels often lead to significant moves as they represent genuine shifts in market sentiment.
Clear Rules: Objective criteria for entry and exit eliminate emotional decision-making and provide consistent execution.
Risk Management: Built-in position sizing and exit rules help protect capital during losing trades.
Market Neutral: Works equally well for long and short positions, adapting to market direction rather than fighting it.
Visual Confirmation: The strategy provides clear visual cues, making it easy to understand when patterns are forming and trades are triggered.
Cons:
False Breakouts: In choppy or ranging markets, price may break the doji levels only to quickly reverse, creating whipsaws.
Patience Required: Traders must wait for both pattern formation and breakout confirmation, which can test discipline during active market periods.
Simple Exit Logic: The moving average exit may be too simplistic, potentially cutting profits short during strong trends or holding losers too long during reversals.
Volatility Dependent: The strategy relies on sufficient volatility to create meaningful doji patterns - it may underperform in extremely quiet markets.
Lagging Entries: Waiting for breakout confirmation means missing the very beginning of moves, reducing potential profit margins.
Best Market Conditions
The strategy performs optimally during periods of moderate volatility when markets are making genuine directional decisions rather than just random noise. It works particularly well around key support/resistance levels where the market's indecision is most meaningful.
Optimization Considerations
Consider combining with additional confluence factors like volume analysis, support/resistance levels, or other technical indicators to improve signal quality. The exit strategy could also be enhanced with trailing stops or multiple profit targets to better capture extended moves while protecting gains.
Best for Index option,
Enjoy !!

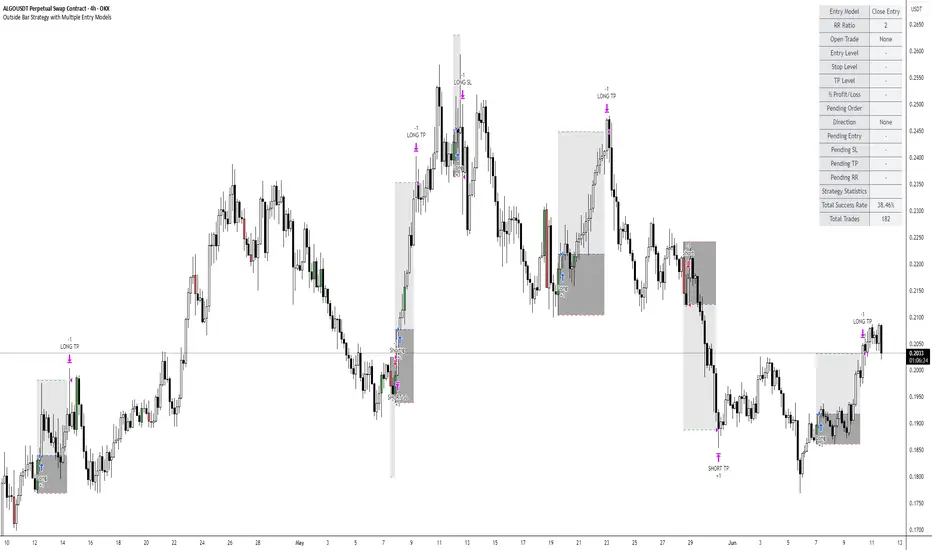
Outside Bar Strategy with Multiple Entry ModelsOutside Bar Strategy with Multiple Entry Models
This Pine Script strategy implements a versatile trading system based on the Outside Bar pattern, offering three distinct entry models: Close Entry, High/Low Entry, and Midpoint Entry. Designed for traders seeking flexibility, the strategy includes customizable risk/reward ratios, an optional EMA trend filter, and enhanced visualization with line fills.
Key Features:
Entry Models:
Close Entry: Enters a long position when the current candle closes above the high of the previous outside bullish bar . For short, it enters when the candle closes below the low of the previous outside bearish bar.
High/Low Entry: Enters a long position when the price crosses above the high of the previous outside bullish bar . For short, it enters when the price crosses below the low of the previous outside bearish bar .
Midpoint Entry: Places a limit order at the midpoint of the previous outside bar, entering when the price reaches this level.
EMA Trend Filter: Optionally filters signals based on the alignment of EMAs (7 > 25 > 99 > 200 for long, 7 < 25 < 99 < 200 for short). Can be toggled via the Use EMA Filter input.
Risk/Reward Management: Configurable risk/reward ratio (default 2.0) with stop-loss set at the low/high of the outside bar and take-profit calculated based on the bar's range multiplied by the ratio.
Visualization:
Lines for entry, stop-loss, and take-profit levels (dashed for active trades, solid for pending Midpoint Entry orders).
Line fills: Red between entry and stop-loss, green between entry and take-profit.
Previous lines and fills persist on the chart for historical reference (line deletion disabled).
Pending limit orders for Midpoint Entry extend dynamically to the right until triggered or canceled.
Information Table: Displays real-time trade details (entry model, RR ratio, open trade status, entry/stop/take-profit levels, profit/loss percentage) and strategy statistics (success rate, total trades). For Midpoint Entry, pending order details are shown.
Inputs:
Entry Model: Choose between Close Entry, High/Low Entry, or Midpoint Entry (default: Close Entry).
Risk/Reward Ratio: Set the RR ratio (default: 2.0, step: 0.5).
Use EMA Filter: Enable/disable the EMA trend filter (default: true).
Line Colors and Style: Customize colors for entry, stop-loss, and take-profit lines, and select line style (solid or dashed).
Table Settings: Adjust table text color, size (small/normal/large), and position (right top/middle/bottom).
Disclaimer: This strategy is for educational purposes only. Backtest thoroughly and use at your own risk. Past performance is not indicative of future results.