Advanced Chandelier Exit with S/R [Alpha Extract]Advanced Chandelier Exit with S/R is a precision-crafted trailing stop and market structure detection system that fuses advanced Chandelier Exit logic with intelligent, multi-timeframe support and resistance tracking. This indicator delivers adaptive trend detection, volatility-aware exit positioning, and real-time structural mapping in a clean, responsive format. By combining directional filtering, pivot zone detection, and customizable styling, Advanced Chandelier Exit with S/R is designed to give traders reliable context, strong risk management, and visually intuitive confirmation signals across all timeframes and asset classes.
🔶 Adaptive Trailing Stop Architecture
At the core of Advanced Chandelier Exit with S/R is a refined Chandelier Exit mechanism that dynamically calculates trailing stops based on recent highs and lows, ATR volatility, and trend sensitivity. The system features directional memory, anchoring the stop to maintain position until a confirmed trend break occurs. This method prevents premature flips and keeps the trade aligned with sustained momentum.
longStop := close > longStop ? math.max(longStop, longStop ) : longStop
shortStop := close < shortStop ? math.min(shortStop, shortStop ) : shortStop
🔶 Volatility-Weighted Filtering
To reduce noise and improve reaction quality, Advanced Chandelier Exit with S/R includes an optional volatility normalization filter. This system adjusts ATR output based on how elevated it is relative to its own average, effectively down-weighting erratic price moves while maintaining responsiveness in directional phases.
volatilityFilter = enableVolatilityFilter ? ta.sma(baseATR, length) / baseATR : 1.0
atr = mult * baseATR * sensitivity * volatilityFilter
🔶 Trend Strength-Aware State Transitions
Trend flips in Advanced Chandelier Exit with S/R are not based solely on price crossing the stop level. Instead, the system includes a momentum-derived trend strength filter that validates the legitimacy of directional shifts. This guards against weak reversals and gives stronger confidence in breakout moves.
priceChange = math.abs(close - close )
avgPriceChange = ta.sma(priceChange, length)
trendStrength = math.min(priceChange / avgPriceChange * 100, 200)
🔶 Multi-Timeframe Support & Resistance Zones
Advanced Chandelier Exit with S/R embeds a sophisticated pivot-based structure mapping engine that automatically identifies significant price reaction levels and tracks their validity over time. It filters redundant zones, removes invalidated levels, and renders real-time support and resistance overlays based on market structure.
if isUniqueLevel(ph, resistanceLevels)
array.unshift(resistanceLevels, ph)
if isUniqueLevel(pl, supportLevels)
array.unshift(supportLevels, pl)
🔶 Dynamic Visual Encoding
The indicator uses strength-scaled fills, customizable colors, and line styling to convey directional bias with clarity. Color opacity intensifies as trend strength increases, offering intuitive context at a glance. Dynamic background fills mark trend states, while S/R zones are rendered with user-defined transparency for clean integration.
🔶 Signal Detection and Alerts
Directional signals are generated upon confirmed flips between long and short regimes, validated by stop crosses and strength filters. Additionally, the indicator provides S/R breakout alerts, identifying when price breaks through a key structural level.
🔶 Performance and Customization Optimizations
Advanced Chandelier Exit with S/R is built with modularity and efficiency in mind. It supports full customization of stop logic, volatility sensitivity, structural lookback, S/R zone filtering, and visual display. The use of array-based data structures for S/R levels ensures consistent performance even across high-activity assets and longer lookback periods.
Advanced Chandelier Exit with S/R represents the next evolution in trailing stop and structure-aware trading tools. By blending the proven logic of the Chandelier Exit system with intelligent trend strength filters and robust S/R detection, it becomes more than just a stop indicator—it becomes a complete trade management companion. Traders benefit from fewer false flips, clearer directional bias, and precise structural overlays that reinforce both breakout and reversal strategies. Whether used for swing entries, intraday positioning, or zone-based re-entries, Advanced Chandelier Exit with S/R empowers traders with responsive, intelligent logic that adapts to market conditions without compromise.
Chandelierexit

Chandelier Exit Pro w/ExtensionsChandelier Exit Pro w/Extensions
The Chandelier Exit Pro w/Extensions indicator is designed to assist traders in managing risk and identifying trend reversals. The strategy is based on the Chandelier Exit concept, originally created by Charles Le Beau. It uses the Average True Range (ATR) to calculate dynamic stop levels that adjust based on market volatility. This script not only implements the standard Chandelier Exit, but also introduces extension levels and alerts to enhance decision-making.
Key Features:
➡️Dynamic Stop Levels: The indicator calculates stop levels for both long and short positions based on an ATR multiple. This allows traders to determine exit points by monitoring when the price crosses above or below these levels. These levels adapt in real-time based on price volatility, making them a versatile tool for trend-following strategies.
➡️Extension Levels: In addition to the primary stop levels, the script includes extension levels for more advanced stop-loss management. Traders can view active and extension levels separately, providing more flexibility in their exit strategies.
➡️Labels and Visual Cues: The indicator provides dynamic labels that automatically update and follow the plotted stop levels. Labels include the ATR multiplier value (e.g., "2.5" or "2.5ext"), clearly showing the significance of each level. When price crosses below or above a level, the corresponding label is highlighted, aiding traders in quickly identifying the most relevant stop level.
➡️Bar Confirmation and Alerts: The script includes an "await bar confirmation" option to ensure that the stop levels and alerts only trigger after the bar has closed. Alerts are customizable and will notify traders when price crosses critical levels, helping to make timely decisions without the need to constantly monitor charts.
➡️Multiple ATR Levels for Enhanced Precision: The indicator supports up to four different ATR levels, each with customizable multipliers. This allows traders to set different thresholds for exits based on varying degrees of volatility. For example, Level 1 (2.5x ATR) might represent a tighter stop, while Level 4 (10x ATR) could serve as a wider stop for long-term positions.
➡️Calc_bars_count: Improves efficiency of the indicator by reducing the on-chart calculations in to the past. This input can be found at the bottom of the INPUTS tab.
How it Helps Traders:
💥Trend Identification: By using the Chandelier Exit levels, traders can identify when the trend is likely to reverse. When the price crosses below the stop level in a long trade or above the stop level in a short trade, it signals a potential exit point.
💥Volatility-based Adjustments: Unlike static stop-loss methods, the ATR-based stop levels dynamically adjust based on the market’s volatility. This means tighter stops during low volatility periods and wider stops during high volatility periods, reducing the chance of being stopped out prematurely.
💥Risk Management: The dynamic stop levels and extension levels provide a structured way to manage risk. Traders can set tighter stops for short-term trades and wider stops for longer-term trades. The script's visual labels make it easy to track these levels in real-time.
💥Automation with Alerts: The built-in alert system ensures that traders are notified when key levels are crossed. This helps to avoid emotional decision-making and allows for better execution of trading strategies.
Confluence and Price Fluidity:
One of the powerful ways to enhance the effectiveness of the Chandelier Exit indicator is by using it in conjunction with other technical analysis tools to create confluence. Confluence occurs when multiple indicators or price action signals align, providing stronger confirmation for a trade decision. For example:
🎯Support and Resistance Levels: Traders can use the Chandelier Exit levels in combination with key support and resistance zones. If the price is nearing a support level and the Chandelier Exit signals a bullish reversal, this alignment strengthens the case for entering a long position.
🎯Moving Averages: When the Chandelier Exit signals a trend reversal and this is confirmed by a crossover in moving averages (such as a 50-day and 200-day moving average), traders gain additional confidence in the trade direction.
🎯Momentum Indicators: Traders can also look for momentum indicators like RSI or MACD to confirm the strength of a trend or potential reversal. For instance, if the Chandelier Exit triggers a short signal and the RSI also shows overbought conditions, this could provide stronger confirmation to exit a long trade or enter a short position.
🎯Candlestick Patterns: Price fluidity can be monitored using candlestick formations. For example, a bearish engulfing pattern near a Chandelier Exit resistance level offers confluence, adding confidence to the signal to close or short the trade.
By combining the Chandelier Exit with other tools, traders ensure that they are not relying on a single indicator. This layered approach can reduce the likelihood of false signals and improve overall trading accuracy.
Practical Use Case:
Imagine a trader enters a long position, and the price moves favorably. Using the Chandelier Exit, the trader sets the initial stop level at 2.5x ATR below the highest close. As the price continues to rise, the stop level follows the price, locking in profits. If the market suddenly turns, the price crossing below the stop level signals an exit, helping the trader preserve gains. With extension levels, the trader can further refine exits, adjusting based on their risk tolerance and market conditions.
Good luck and I hope that you can find a place in your tool bag to use this dynamic indicator 🙏

Anchored Chandelier ExitThe Chandelier Exit is a popular tool among traders used to help determine appropriate stop loss levels. Originally developed by Chuck LeBeau, the Chandelier Exit takes into account market volatility and adjusts the stop loss level dynamically. This indicator builds upon the original Chandelier Exit by allowing the trader to select an anchor date or starting point for the indicator to begin calculating from.
The Original Chandelier Exit
Before we get into the details of the Anchored Chandelier Exit, let's review the original. Essentially a dynamic ATR stop loss, the Chandelier Exit provides a trailing stop that moves higher or lower based on volatility.
The Chandelier Exit is calculated based on the following criteria:
🔶ATR - The ATR is used to measure the volatility of a security over a lookback period. The ATR length determines the number of bars to consider when calculating the average true range. The shorter the length, the more responsive the level will be.
🔶ATR Multiplier - The default multiplier is set to 3. This is used to determine the sensitivity of the Chandelier Exit. The higher the ATR multiplier the wider the stop levels will be. A lower multiplier will tighten stop levels.
🔶Highest / Lowest Points - Determine the highest high (bullish trade) or lowest low (bearish trade) during the lookback period. The default length is 22 bars.
Calculating the Chandelier Exit
Bullish trades - Highest High - ATR * Multiplier
Bearish trades - Lowest Low + ATR * Multiplier
The Anchored Chandelier Exit
The Anchored Chandelier Exit is a new twist on the original, allowing traders to adapt their stop loss levels based on specific market events, levels or bars.
Similar to the original, traders can select the ATR length and multiplier, however, the high or low from which the ATR is subtracted or added is first determined at the anchor bar.
As new bars form, the indicator checks for the previous high/low to be breached. If the high or low is exceeded, the highest/lowest point is updated and the Chandelier Exit is recalculated.
When the indicator is first loaded to your chart, it will ask you to select an anchor bar and choose the bias for the trade.
A bullish (long) bias trade will plot the Chandelier Exit below price action, while a bearish (short) bias trade will plot the Chandelier Exit above price action.
Indicator Features
🔶Custom Start Date
🔶Bullish or Bearish Bias
🔶Selectable ATR Length & Multiplier
🔶Custom Colors
🔶Exit With Close or Wicks
🔶Exit Alerts
With careful parameter optimization, the Anchored Chandelier Exit can be a useful tool for helping traders manage risk based on market volatility.

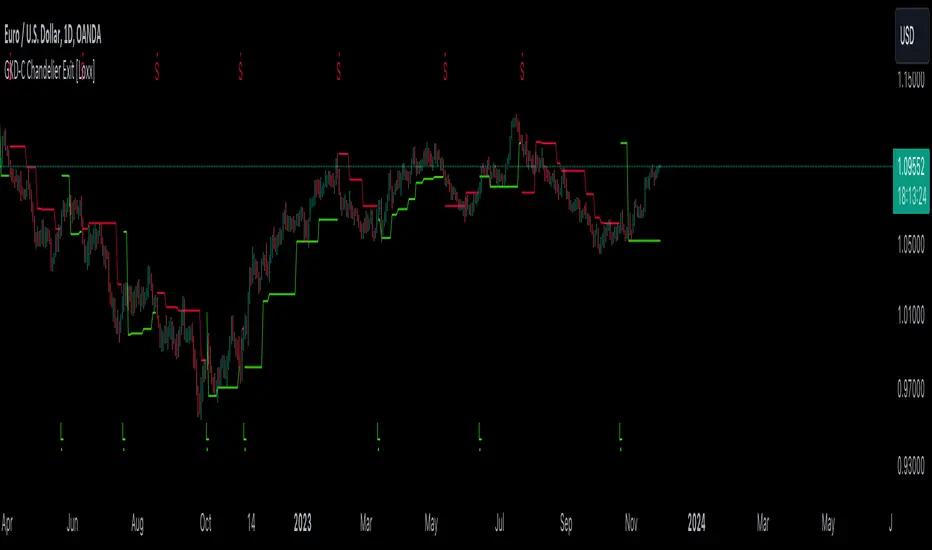
GKD-C Chandelier Exit [Loxx]The Giga Kaleidoscope GKD-C Chandelier Exit is a confirmation module included in Loxx's "Giga Kaleidoscope Modularized Trading System."
█ GKD-C Chandelier Exit
Developed by Charles Le Beau and featured in Alexander Elder's books, the Chandelier Exit sets a trailing stop-loss based on the Average True Range (ATR). The indicator is designed to keep traders in a trend and prevent an early exit as long as the trend extends. Typically, the Chandelier Exit will be above prices during a downtrend and below prices during an uptrend.
█ Giga Kaleidoscope Modularized Trading System
Core components of an NNFX algorithmic trading strategy
The NNFX algorithm is built on the principles of trend, momentum, and volatility. There are six core components in the NNFX trading algorithm:
1. Volatility - price volatility; e.g., Average True Range, True Range Double, Close-to-Close, etc.
2. Baseline - a moving average to identify price trend
3. Confirmation 1 - a technical indicator used to identify trends
4. Confirmation 2 - a technical indicator used to identify trends
5. Continuation - a technical indicator used to identify trends
6. Volatility/Volume - a technical indicator used to identify volatility/volume breakouts/breakdown
7. Exit - a technical indicator used to determine when a trend is exhausted
8. Metamorphosis - a technical indicator that produces a compound signal from the combination of other GKD indicators*
*(not part of the NNFX algorithm)
What is Volatility in the NNFX trading system?
In the NNFX (No Nonsense Forex) trading system, ATR (Average True Range) is typically used to measure the volatility of an asset. It is used as a part of the system to help determine the appropriate stop loss and take profit levels for a trade. ATR is calculated by taking the average of the true range values over a specified period.
True range is calculated as the maximum of the following values:
-Current high minus the current low
-Absolute value of the current high minus the previous close
-Absolute value of the current low minus the previous close
ATR is a dynamic indicator that changes with changes in volatility. As volatility increases, the value of ATR increases, and as volatility decreases, the value of ATR decreases. By using ATR in NNFX system, traders can adjust their stop loss and take profit levels according to the volatility of the asset being traded. This helps to ensure that the trade is given enough room to move, while also minimizing potential losses.
Other types of volatility include True Range Double (TRD), Close-to-Close, and Garman-Klass
What is a Baseline indicator?
The baseline is essentially a moving average, and is used to determine the overall direction of the market.
The baseline in the NNFX system is used to filter out trades that are not in line with the long-term trend of the market. The baseline is plotted on the chart along with other indicators, such as the Moving Average (MA), the Relative Strength Index (RSI), and the Average True Range (ATR).
Trades are only taken when the price is in the same direction as the baseline. For example, if the baseline is sloping upwards, only long trades are taken, and if the baseline is sloping downwards, only short trades are taken. This approach helps to ensure that trades are in line with the overall trend of the market, and reduces the risk of entering trades that are likely to fail.
By using a baseline in the NNFX system, traders can have a clear reference point for determining the overall trend of the market, and can make more informed trading decisions. The baseline helps to filter out noise and false signals, and ensures that trades are taken in the direction of the long-term trend.
What is a Confirmation indicator?
Confirmation indicators are technical indicators that are used to confirm the signals generated by primary indicators. Primary indicators are the core indicators used in the NNFX system, such as the Average True Range (ATR), the Moving Average (MA), and the Relative Strength Index (RSI).
The purpose of the confirmation indicators is to reduce false signals and improve the accuracy of the trading system. They are designed to confirm the signals generated by the primary indicators by providing additional information about the strength and direction of the trend.
Some examples of confirmation indicators that may be used in the NNFX system include the Bollinger Bands, the MACD (Moving Average Convergence Divergence), and the MACD Oscillator. These indicators can provide information about the volatility, momentum, and trend strength of the market, and can be used to confirm the signals generated by the primary indicators.
In the NNFX system, confirmation indicators are used in combination with primary indicators and other filters to create a trading system that is robust and reliable. By using multiple indicators to confirm trading signals, the system aims to reduce the risk of false signals and improve the overall profitability of the trades.
What is a Continuation indicator?
In the NNFX (No Nonsense Forex) trading system, a continuation indicator is a technical indicator that is used to confirm a current trend and predict that the trend is likely to continue in the same direction. A continuation indicator is typically used in conjunction with other indicators in the system, such as a baseline indicator, to provide a comprehensive trading strategy.
What is a Volatility/Volume indicator?
Volume indicators, such as the On Balance Volume (OBV), the Chaikin Money Flow (CMF), or the Volume Price Trend (VPT), are used to measure the amount of buying and selling activity in a market. They are based on the trading volume of the market, and can provide information about the strength of the trend. In the NNFX system, volume indicators are used to confirm trading signals generated by the Moving Average and the Relative Strength Index. Volatility indicators include Average Direction Index, Waddah Attar, and Volatility Ratio. In the NNFX trading system, volatility is a proxy for volume and vice versa.
By using volume indicators as confirmation tools, the NNFX trading system aims to reduce the risk of false signals and improve the overall profitability of trades. These indicators can provide additional information about the market that is not captured by the primary indicators, and can help traders to make more informed trading decisions. In addition, volume indicators can be used to identify potential changes in market trends and to confirm the strength of price movements.
What is an Exit indicator?
The exit indicator is used in conjunction with other indicators in the system, such as the Moving Average (MA), the Relative Strength Index (RSI), and the Average True Range (ATR), to provide a comprehensive trading strategy.
The exit indicator in the NNFX system can be any technical indicator that is deemed effective at identifying optimal exit points. Examples of exit indicators that are commonly used include the Parabolic SAR, the Average Directional Index (ADX), and the Chandelier Exit.
The purpose of the exit indicator is to identify when a trend is likely to reverse or when the market conditions have changed, signaling the need to exit a trade. By using an exit indicator, traders can manage their risk and prevent significant losses.
In the NNFX system, the exit indicator is used in conjunction with a stop loss and a take profit order to maximize profits and minimize losses. The stop loss order is used to limit the amount of loss that can be incurred if the trade goes against the trader, while the take profit order is used to lock in profits when the trade is moving in the trader's favor.
Overall, the use of an exit indicator in the NNFX trading system is an important component of a comprehensive trading strategy. It allows traders to manage their risk effectively and improve the profitability of their trades by exiting at the right time.
What is an Metamorphosis indicator?
The concept of a metamorphosis indicator involves the integration of two or more GKD indicators to generate a compound signal. This is achieved by evaluating the accuracy of each indicator and selecting the signal from the indicator with the highest accuracy. As an illustration, let's consider a scenario where we calculate the accuracy of 10 indicators and choose the signal from the indicator that demonstrates the highest accuracy.
The resulting output from the metamorphosis indicator can then be utilized in a GKD-BT backtest by occupying a slot that aligns with the purpose of the metamorphosis indicator. The slot can be a GKD-B, GKD-C, or GKD-E slot, depending on the specific requirements and objectives of the indicator. This allows for seamless integration and utilization of the compound signal within the GKD-BT framework.
How does Loxx's GKD (Giga Kaleidoscope Modularized Trading System) implement the NNFX algorithm outlined above?
Loxx's GKD v2.0 system has five types of modules (indicators/strategies). These modules are:
1. GKD-BT - Backtesting module (Volatility, Number 1 in the NNFX algorithm)
2. GKD-B - Baseline module (Baseline and Volatility/Volume, Numbers 1 and 2 in the NNFX algorithm)
3. GKD-C - Confirmation 1/2 and Continuation module (Confirmation 1/2 and Continuation, Numbers 3, 4, and 5 in the NNFX algorithm)
4. GKD-V - Volatility/Volume module (Confirmation 1/2, Number 6 in the NNFX algorithm)
5. GKD-E - Exit module (Exit, Number 7 in the NNFX algorithm)
6. GKD-M - Metamorphosis module (Metamorphosis, Number 8 in the NNFX algorithm, but not part of the NNFX algorithm)
(additional module types will added in future releases)
Each module interacts with every module by passing data to A backtest module wherein the various components of the GKD system are combined to create a trading signal.
That is, the Baseline indicator passes its data to Volatility/Volume. The Volatility/Volume indicator passes its values to the Confirmation 1 indicator. The Confirmation 1 indicator passes its values to the Confirmation 2 indicator. The Confirmation 2 indicator passes its values to the Continuation indicator. The Continuation indicator passes its values to the Exit indicator, and finally, the Exit indicator passes its values to the Backtest strategy.
This chaining of indicators requires that each module conform to Loxx's GKD protocol, therefore allowing for the testing of every possible combination of technical indicators that make up the six components of the NNFX algorithm.
What does the application of the GKD trading system look like?
Example trading system:
Backtest: Multi-Ticker CC Backtest
Baseline: Hull Moving Average
Volatility/Volume: Hurst Exponent
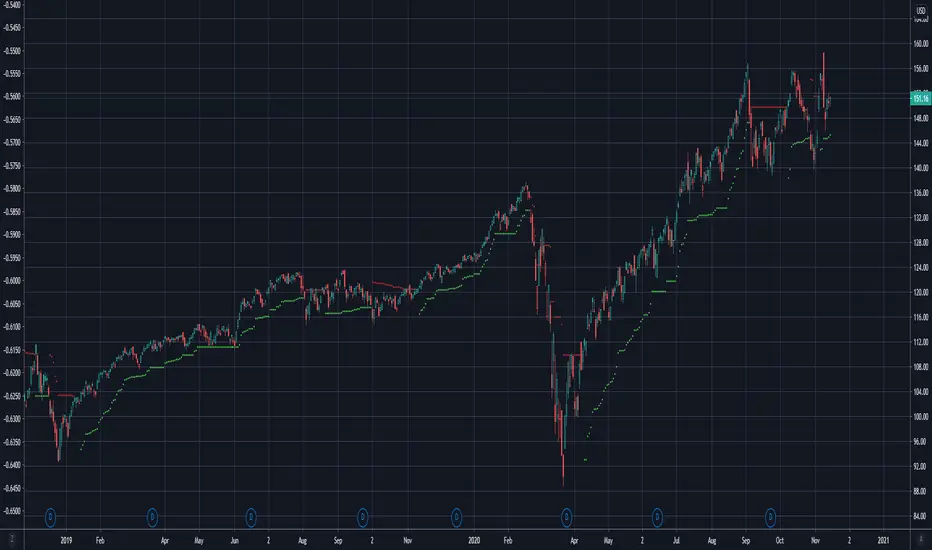
Confirmation 1: Advance Trend Pressure as shown on the chart above
Confirmation 2: uf2018
Continuation: Coppock Curve
Exit: Rex Oscillator
Metamorphosis: Baseline Optimizer
Each GKD indicator is denoted with a module identifier of either: GKD-BT, GKD-B, GKD-C, GKD-V, GKD-M, or GKD-E. This allows traders to understand to which module each indicator belongs and where each indicator fits into the GKD system.
? Giga Kaleidoscope Modularized Trading System Signals
Standard Entry
1. GKD-C Confirmation gives signal
2. Baseline agrees
3. Price inside Goldie Locks Zone Minimum
4. Price inside Goldie Locks Zone Maximum
5. Confirmation 2 agrees
6. Volatility/Volume agrees
1-Candle Standard Entry
1a. GKD-C Confirmation gives signal
2a. Baseline agrees
3a. Price inside Goldie Locks Zone Minimum
4a. Price inside Goldie Locks Zone Maximum
Next Candle
1b. Price retraced
2b. Baseline agrees
3b. Confirmation 1 agrees
4b. Confirmation 2 agrees
5b. Volatility/Volume agrees
Baseline Entry
1. GKD-B Baseline gives signal
2. Confirmation 1 agrees
3. Price inside Goldie Locks Zone Minimum
4. Price inside Goldie Locks Zone Maximum
5. Confirmation 2 agrees
6. Volatility/Volume agrees
7. Confirmation 1 signal was less than 'Maximum Allowable PSBC Bars Back' prior
1-Candle Baseline Entry
1a. GKD-B Baseline gives signal
2a. Confirmation 1 agrees
3a. Price inside Goldie Locks Zone Minimum
4a. Price inside Goldie Locks Zone Maximum
5a. Confirmation 1 signal was less than 'Maximum Allowable PSBC Bars Back' prior
Next Candle
1b. Price retraced
2b. Baseline agrees
3b. Confirmation 1 agrees
4b. Confirmation 2 agrees
5b. Volatility/Volume agrees
Volatility/Volume Entry
1. GKD-V Volatility/Volume gives signal
2. Confirmation 1 agrees
3. Price inside Goldie Locks Zone Minimum
4. Price inside Goldie Locks Zone Maximum
5. Confirmation 2 agrees
6. Baseline agrees
7. Confirmation 1 signal was less than 7 candles prior
1-Candle Volatility/Volume Entry
1a. GKD-V Volatility/Volume gives signal
2a. Confirmation 1 agrees
3a. Price inside Goldie Locks Zone Minimum
4a. Price inside Goldie Locks Zone Maximum
5a. Confirmation 1 signal was less than 'Maximum Allowable PSVVC Bars Back' prior
Next Candle
1b. Price retraced
2b. Volatility/Volume agrees
3b. Confirmation 1 agrees
4b. Confirmation 2 agrees
5b. Baseline agrees
Confirmation 2 Entry
1. GKD-C Confirmation 2 gives signal
2. Confirmation 1 agrees
3. Price inside Goldie Locks Zone Minimum
4. Price inside Goldie Locks Zone Maximum
5. Volatility/Volume agrees
6. Baseline agrees
7. Confirmation 1 signal was less than 7 candles prior
1-Candle Confirmation 2 Entry
1a. GKD-C Confirmation 2 gives signal
2a. Confirmation 1 agrees
3a. Price inside Goldie Locks Zone Minimum
4a. Price inside Goldie Locks Zone Maximum
5a. Confirmation 1 signal was less than 'Maximum Allowable PSC2C Bars Back' prior
Next Candle
1b. Price retraced
2b. Confirmation 2 agrees
3b. Confirmation 1 agrees
4b. Volatility/Volume agrees
5b. Baseline agrees
PullBack Entry
1a. GKD-B Baseline gives signal
2a. Confirmation 1 agrees
3a. Price is beyond 1.0x Volatility of Baseline
Next Candle
1b. Price inside Goldie Locks Zone Minimum
2b. Price inside Goldie Locks Zone Maximum
3b. Confirmation 1 agrees
4b. Confirmation 2 agrees
5b. Volatility/Volume agrees
Continuation Entry
1. Standard Entry, 1-Candle Standard Entry, Baseline Entry, 1-Candle Baseline Entry, Volatility/Volume Entry, 1-Candle Volatility/Volume Entry, Confirmation 2 Entry, 1-Candle Confirmation 2 Entry, or Pullback entry triggered previously
2. Baseline hasn't crossed since entry signal trigger
4. Confirmation 1 agrees
5. Baseline agrees
6. Confirmation 2 agrees
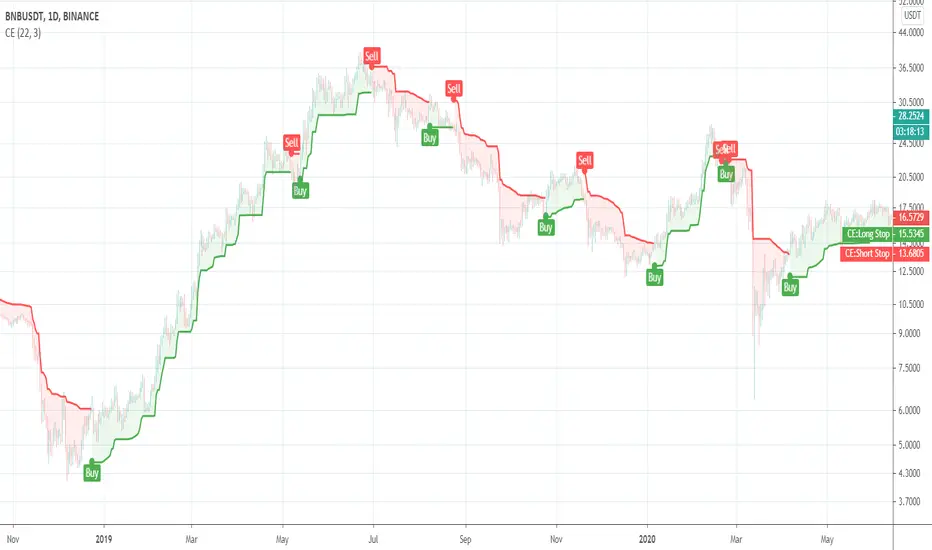
Chandelier Exit ZLSMA StrategyIntroducing a Powerful Trading Indicator: Chandelier Exit with ZLSMA
If you're a trader, you know the importance of having the right tools and indicators to make informed decisions. That's why we're excited to introduce a powerful new trading indicator that combines the Chandelier Exit and ZLSMA: two widely-used and effective indicators for technical analysis.
The Chandelier Exit (CE) is a popular trailing stop-loss indicator developed by Chuck LeBeau. It's designed to follow the price trend of a security and provide an exit signal when the price crosses below the CE line. The CE line is based on the Average True Range (ATR), which is a measure of volatility. This means that the CE line adjusts to the volatility of the security, making it a reliable indicator for trailing stop-losses.
The ZLEMA (Zero Lag Exponential Moving Average) is a type of exponential moving average that's designed to reduce lag and improve signal accuracy. The ZLSMA takes into account not only the current price but also past prices, using a weighted formula to calculate the moving average. This makes it a smoother indicator than traditional moving averages, and less prone to giving false signals.
When combined, the CE and ZLSMA create a powerful indicator that can help traders identify trend changes and make more informed trading decisions. The CE provides the trailing stop-loss signal, while the ZLSMA provides a smoother trend line to help identify potential entry and exit points.
In our indicator, the CE and ZLSMA are plotted together on the chart, making it easy to see both the trailing stop-loss and the trend line at the same time. The CE line is displayed as a dotted line, while the ZLSMA line is displayed as a solid line.
Using this indicator, traders can set their stop-loss levels based on the CE line, while also using the ZLSMA line to identify potential entry and exit points. The combination of these two indicators can help traders reduce their risk and improve their trading performance.
In conclusion, the Chandelier Exit with ZLSMA is a powerful trading indicator that combines two effective technical analysis tools. By using this indicator, traders can identify trend changes, set stop-loss levels, and make more informed trading decisions. Try it out for yourself and see how it can improve your trading performance.
Warning: The results in the backtest are from a repainting strategy. Don't take them seriously. You need to do a dry live test in order to test it for its useability.
-
Here is a description of each input field in the provided source code:
length: An integer input used as the period for the ATR (Average True Range) calculation. Default value is 1.
mult: A float input used as a multiplier for the ATR value. Default value is 2.
showLabels: A boolean input that determines whether to display buy/sell labels on the chart. Default value is false.
isSignalLabelEnabled: A boolean input that determines whether to display signal labels on the chart. Default value is true.
useClose: A boolean input that determines whether to use the close price for extrema calculations. Default value is true.
zcolorchange: A boolean input that determines whether to enable rising/decreasing highlighting for the ZLSMA (Zero-Lag Exponential Moving Average) line. Default value is false.
zlsmaLength: An integer input used as the length for the ZLSMA calculation. Default value is 50.
offset: An integer input used as an offset for the ZLSMA calculation. Default value is 0.
-
Ty for checking this out and good luck on your trading journey! Likes and comments are appreciated. 👍
--
Credits to:
▪ @everget – Chandelier Exit (CE)
▪ @netweaver2022 – ZLSMA

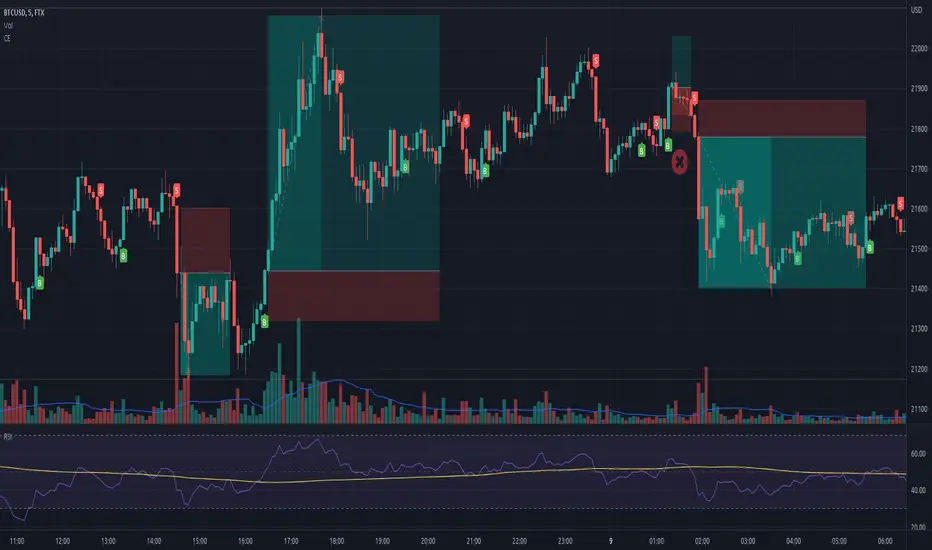
Chandelier Exit ZLSMA StrategyIntroduction
Heyo guys, I recently checked out some eye-catching trading strategy videos on YT and found one to test.
This indicator is based on the video.
Usage
The recommended timeframe is 5 min.
Signals
Long Entry => L Label
Price crosses above ZLSMA and Chandelier Exit shows Buy
Long Exit => green circle
Price crosses below ZLSMA
Short Entry => S Label
Price crosses below ZLSMA and Chandelier Exit shows Sell
Short Exit => orange circle
Prices crosses above ZLSMA
Ty for checking this out. Enjoy!
--
Credits to
@netweaver2011 - ZLSMA
@everget – Chandelier Exit

Chandelier Exit - Heikin AshiThis is a redesign of the Chandelier Exit indicator. It removes stupid transitions between Chandelier Exit' states and highlights initial points for both lines.
This indicator was originally developed by Charles Le Beau and popularized by Dr . Alexander Elder in his book "Come Into My Trading Room: A Complete Guide to Trading" (2002).
In short, this is a trailing stop-loss based on the Average True Range (ATR).
If "Heikin Ashi for calculation" is checked, then ATR and buy/sell signals are calculated based on heikin ashi candles.
You don't need to change bar style to heikin ashi.
Thanks to everget for the initial version.
Trend MasterThis is a trend aggregator for confirmation and trend signals. It basically aggregates many buy/sell signals and confirmation and by combining them provides a strong buy/sell signal or trend confirmation.
The actual layout idea and trend confirmation is derived from Trend Meter and this indicator uses few other indicator, such as Chandelier Exit, WaveTrend, QQE Signals, Parabolic SAR and AlphaTrend. This indicator aggregates signal from different methods to find out more powerful and confirmed Trend and combines them into one Signal. It also uses Technical Ratings from TradingView team to filter out false signal, it tremendously opts out false signals and improve profitability.
The first seven dots are these
All 3 Trend Meters Now Align
MACD Crossover - Fast - 8, 21, 5
RSI 13: > or < 50
RSI 5: > or < 50
MA Crossover
MA Crossover
Chaikin Money Flow
Alphatrend
Technical Ratings
Then trend
Chandelier Exit
WaveTrend
QQE Signals
Parabolic Sar
All 3 Trend Meters aligns and A signal from trend i
Instructions
Change buy/sell policy based on market trend
Works on all TimeFrame but gives more accuracy on 4H, 1D.
Buy when green big dot appears at the bottom.
Sell when red big dot appears at the bottom.
Red/green dot at the top line appears when three trend meter is aligned and this is a good confirmation.
Any red/green dot below horizontal bars are trend signals.
Big red/green got at the bottom appears whenever there's a good confirmation from trend meter and a buy/sell signal comes from any trend signals.
Also look on the technical ratings bar, green means buy, red means sell and yellow means neutral.
Look for Support or Resistance Levels for price to be attracted to.
Find confluence with other indicators.
The more Trend meters are lit up the better.
Alert
01 Buy Signal = Strong Buy Signal
02 Sell Signal = Strong Sell Signal
03 Buy Signal = Strong Buy Signal
04 Sell Signal = Strong Sell Signal
Thanks to TradingView Technical Ratings authors, evergot, Lij_MC, KivancOzbilgic for their work. This indicator was heavily inspired from their work.

Bogdan Ciocoiu - Sniper EntryWhat is Sniper Entry
Sniper Entry is a set indicator that encapsulates a collection of pre-configured scripts using specific variables that enable users to extract signals by interpreting market behaviour quickly, suitable for 1-3min scalping. This instrument is a tool that acts as a confluence for traders to make decisions concerning current market conditions. This indicator does not apply solely to an asset.
What Sniper Entry is not
Sniper Entry is not interpreting fundamental analysis and will also not be providing out of box market signals. Instead, it will provide a collection of integrated and significantly improved open-source subscripts designed to help traders speculate on market trends. Traders must apply their strategies and configure Sniper Entry accordingly to maximise the script's output.
Originality and usefulness
The collection of subscripts encapsulated in this tool makes it unique in the Trading View ecosystem. This indicator enables traders to consider entry positions or exit positions by comparing similar algorithms at once.
Its usefulness also emerges from the unique configurations embedded in the indicator's settings, which are different from those of the original scripts.
This indicator's originality is also reflected in how its modules are integrated, including the integration of the settings.
Open-source reuse
I used the following open-source resources, which I simplified significantly and pre-configured for short term scalping. The source codes for the below are already in the public domain, including the following links listed below.
www.tradingview.com (open source)
(open source and generic algorithm)
www.tradingview.com (open source)
(open source)
(open source)
www.tradingview.com (generic MA algorithm and open source)
(generic VWAP algorithm and open source)

EasyTrade - Chandelier EMAHello Traders!
Starting from an idea of youtube channel "Ultra Trader", we have developed this simple indicator and prepared to be used with EasyTrade software.
You can setup Alerts for Crypto or Forex/Indices/Stocks/etc...
The simple but working idea behind this indicator, is a combination of "Chandelier Exit strategy" and EMA 200. It's great on long trend.
Good results are obtained with scalping timeframe from 1 to 15-minute timeframe (see video for details).
Settings
ATR Period : This value is used to change the number of candles used in ATR formula.
ATR Multiplier : This value is used to multiply the ATR value.
Use EMA filter and Value : This options Enable/Disable the EMA filter. You can change the period of the EMA
R/R ratio : You can set your Risk/Reward ratio according to your trading rules.
Show Trend : Show or hide the indicator cloud
Show Signals : Show or hide the dots on the bottom of the graphs and the "Sell" or "Buy" labels.
Show TP/SL : Show or hide Take profits (Purple line) and Stop Loss (Orange Line)
Alerts
The alert signal generated by the indicator can be directly used by the EasyTrade software to directly execute trades on your preferred Broker.
Conclusion
We hope it will be useful to simplify and automate your trading, but remember; always do your back-tests with your trading rules .
Suggestions or improvements are always welcome, if they make sense.
Credits
Ultra Trades Video
EasyTrade Free Indicators and Software

Chandelier Exit - StrategyI created a strategy version for the Chandelier Exit indicator, originally owned by @everget . With the strategy I prepared, you can try both short-long and stop loss - trailing stop and take profit rates. I have also added a date filter feature so that you can test the strategy in the date range you want.
Orjinali @everget 'e ait olan Chandelier Exit indicator için strateji versiyonu oluşturdum. Hazırladığım strateji ile hem short-long deneyebilir hem de zarar durdur - takip eden stop ve kar al oranları denemeleri yapabilirsiniz. İstediğiniz tarih aralığında strateji testi yapabilmeniz için tarih filtre özelliği de ekledim.

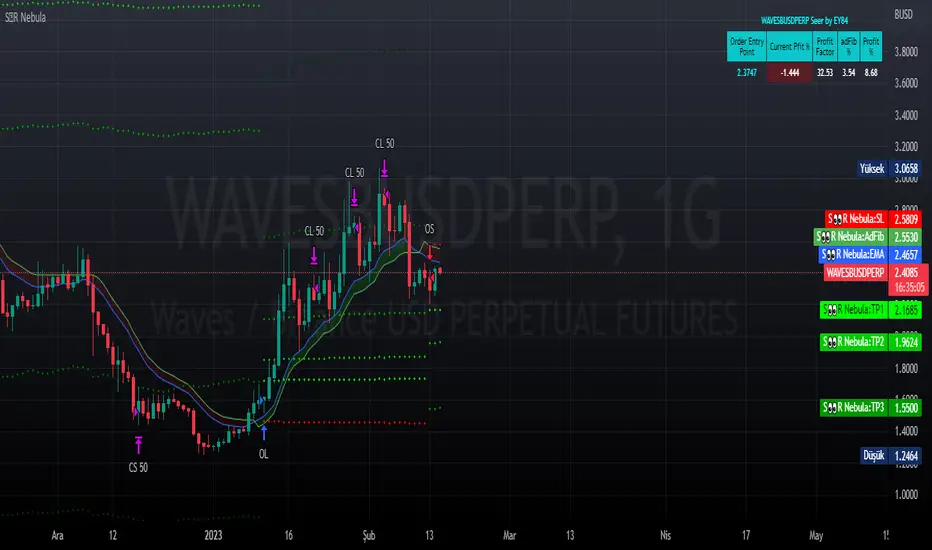
Seer by EY84This is a strategy based on Exponential Moving Averages or Volume Weighted Moving Averages against Adaptive fib resistance / support level and profit percentage which can be definetly defined by user and targeting small profits(profits will be raised by leverages).
In this strategy, there are predefined values which are collected one by one with statistical background and backtests. This gives an advantage to see which ratios are working better for each symbol.
Also this statistics are re-evaluated monthly and if there is a need they are goging to be changed with the help of libraries. Also IT IS RECOMMENDED TO USE IN HOURLY INTERVAL GRAPHICS!!!!
When we deep dive to strategy, it is based on profit percentages. it is similar to the MOST system. MOST only changes the way with default value of %2. But this hardcoded strategy is not working well with each Symbol.
So this is the point where Statistics are involved.
For Ex. while BTC is suits well with %2, it does not do wonders for RSR or RUNE which is 4-5% for each.
Library stores these values as a predefined options. Also it is allowed to change these predefined values within the settings of this strategy.
what is next ? Lets see how are we closing the positions.
Script checks cross of EMA / VWMA and adFib to decide open a position. In reversal / crosses, adFib line had been set to defined Fib. Percentage level. This sets the Full Position close / SL value for current order.
OK! we got the SL but how we get the profit ?
Now this is the place where Profit Percentage (PP) parameter involved. After the position opened it is waiting for PP to be reached. After PP had been reached, close signal had been raised for the HALF of the OPEN ORDER (with the BAR CLOSURE!!).
so tricky part has come here. Remaining position is still open and when "total available profit with remaining amount" had been reached to PP it wil raise the Close Half signal will be raised.
what happens to the SL position ? TWO possible scenarios will be raised here.
Case 1. Reversal on the adFib (short-to-long or long-to-short) will trigger full close signal.
Case 2. If the level drops the previous signal system will generate full close signal again.
Example 1:
Long Order Open : 100$
Half Close Signal : 110$
Case 1: adFib Reversal occurs : 105$ ==> Triggers Full Close Signal with Short Order.
Case 2: Price falls : 100$ ==> Only Triggers Full Close Signal.
Example 2:
Long Order Open : 100$
Half Close Signal : 110$
2. Half Close Signal : 121$
Case 1: adFib Reversal occurs : 115$ ==> Triggers Full Close Signal with Short Order.
Case 2: Price falls : 110$ ==> Only Triggers Full Close Signal.
Beside of these, strategy is also includes editable 4 EMA, 1 WMA, 1 AVWAP and Bollinger Bands Plotting (2.5x Multiplier) who wants to use them as a supportive statistics.
All feedbacks are welcome.
MA, MATR, ChEx | All in One - 4CR CUPIn trade position setup, we always need to determine the market structure and manage the position sizing in a short period of decision time. Indicators such as moving average, initial stop loss and trailing stop loss are always helpful.
This indicator put all these handy tools into a single toolkit, which includes the following price action and risk management indicators:
MA - Moving Average
MATR - Moving Average less Average True Range
ChEx - Chandelier Exit
This script further enhances the setting so that you can easily customize the indicators.
For both the Moving Averages and the Moving Average less Average True Range , you can pick a type of moving average which suits your analysis style from a list of commonly used moving average formulations: namely, EMA , HMA , RMA, SMA and WMA , where EMA is selected as default.
The Moving Average less Average True Range , MATR, is usually applied as a reference to set the initial stop loss whenever opening a new position.
The abbreviation, MATR, is picked, so that this can serve as a handy reminder of a very good trading framework as elaborates as below:
M – Market Structure
A – Area of Value
T – Trigger
R – Risk Management (aka. Exit Strategy)

Chandelier Exit | SAR/Long Only (4CUP)As introduced by StockCharts.com, Chandelier Exit was developed by Charles Le Beau and featured in Alexander Elder's books, this sets a trailing stop-loss based on the Average True Range (ATR).
Chandelier Exit can be formulated as a stop-and-reverse (SAR) or as a traditional trailing stop-loss version shown by Stockcharts.com.
The main difference is that, in SAR version, the indicator is usually formulated in a higher of previous or spot indicator (HPS) for long and lower of previous and spot indicator (LPS) for short position.
This indicator is coded to show both the SAR version and the traditional one shown by Stockcharts.com (for long position) by simply clicking a tick in the Version box.
The ATR multiplier is relaxed to allow non-integer input, like 3.5, 4.25, ... for a greater flexibility to tailor your best-fit exit strategy.
If you find this indicator is useful to you, Star it, Follow, Donate, Like and Share.
Your support is a highly motivation for me.
Chandelier ExitThis is a redesign of the Chandelier Exit indicator. It removes stupid transitions between Chandelier Exit' states and highlights initial points for both lines.
This indicator was originally developed by Charles Le Beau and popularized by Dr. Alexander Elder in his book "Come Into My Trading Room: A Complete Guide to Trading" (2002).
In short, this is a trailing stop-loss based on the Average True Range (ATR).