• 產品
  • 社群
  • 市場
  • 經紀商
  • 更多
立即開始
  • 社群
  • /指標和策略
  • /Chips

Chips

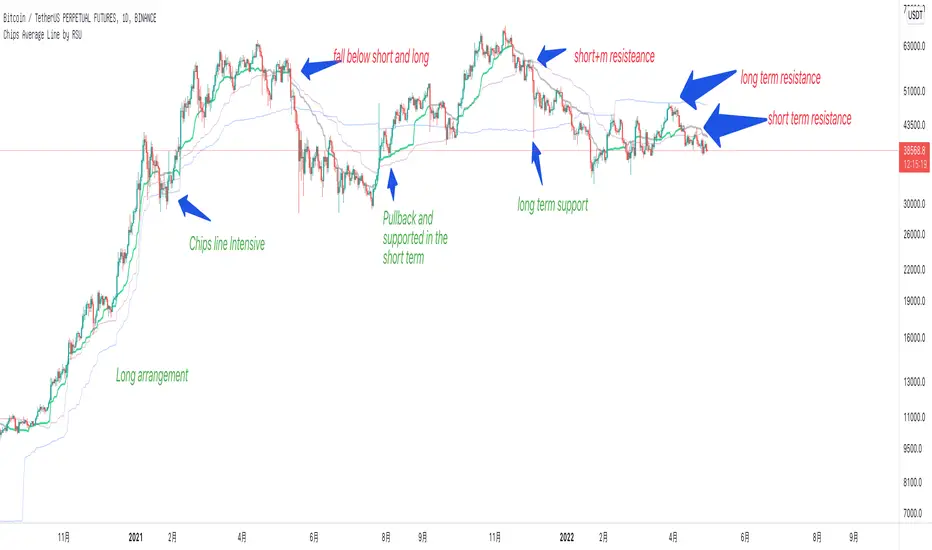
Chips Average Line (volume price) by RSUThis is a very important volume-price indicator for me. Displays the average cost of chips for the short term (30 days), medium term (60 days), and long term (200 days). Chip lines act as support and resistance. The longer the trend days, the greater the strength. usage: 1. Breakout: If the stock rises, it must be above the short-term chip line. And gradually rise. 2. Sequence: When a bullish trend is formed, the short-term stack is higher than the mid-term stack, and the mid-flag stack is higher than the long-term stack. When there is a bear trend, the order is reversed. 3. Intensive: When the three chip lines are dense, there will be a periodical resonance effect, and the long-term trend will rise or fall sharply
Pine Script®指標
由rsu9111提供
已更新
1414

選擇由ICE Data提供的市場數據。選擇由FactSet提供的參考數據。版權所有©2025FactSet Research Systems Inc.©2025TradingView, Inc.

不僅是產品
  • 超級圖表
篩選器
  • 股票
  • ETF
  • 債券
  • 加密貨幣
  • CEX對
  • DEX對
  • Pine
熱圖
  • 股票
  • ETF
  • 加密貨幣
日曆
  • 經濟
  • 收益
  • 股息
更多產品
  • 殖利率曲線
  • 期權
  • 新聞流
  • Pine Script®
App
  • 行動裝置
  • 電腦版
社群
  • 社交網路
  • 愛心牆
  • 推薦朋友
  • 網站規則
  • 版主
投資想法
  • 交易
  • 教育
  • 編輯精選
Pine腳本
  • 指標與策略
  • 大師
  • 自由開發人員
工具與訂閱
  • 功能特色
  • 價格
  • 市場數據
交易
  • 概要
  • 經紀商
特別優惠
  • CME期貨
  • Eurex期貨
  • 美國股票包
關於公司
  • 我們是誰
  • 宣言
  • 運動員
  • 部落格
  • 職涯
  • 媒體工具包
商品
  • TradingView商店
  • 交易者塔羅牌
  • C63 TradeTime
政策與安全
  • 使用條款
  • 免責聲明
  • 隱私政策
  • Cookies政策
  • 無障礙聲明
  • 安全漏洞
  • 狀態頁面
企業解決方案
  • 小工具
  • 圖表庫
  • Lightweight Charts™
  • 高級圖表
  • 交易平台
成長機會
  • 廣告
  • 經紀商整合
  • 夥伴計畫
  • 教育計劃
社群
  • 社交網路
  • 愛心牆
  • 推薦朋友
  • 網站規則
  • 版主
投資想法
  • 交易
  • 教育
  • 編輯精選
Pine腳本
  • 指標與策略
  • 大師
  • 自由開發人員
企業解決方案
  • 小工具
  • 圖表庫
  • Lightweight Charts™
  • 高級圖表
  • 交易平台
成長機會
  • 廣告
  • 經紀商整合
  • 夥伴計畫
  • 教育計劃
Look FirstLook First