Symbol Magnifier & MTF Clock# Symbol Magnifier & MTF Clock
Shows your symbol, price, and countdown timers for multiple timeframes on one chart.
## What It Does
**Symbol Display:**
- Big, easy-to-read symbol and price
- Shows time left until current candle closes
- Green for bullish, red for bearish
- Put it anywhere on your chart
**Multi-Timeframe Clock:**
- Track up to 6 timeframes at once: D1, H4, H1, M30, M15, M5
- See exactly when each candle will close
- Turns orange/red in the last 5 minutes as a warning
- Choose which timeframes to show
## Why Use It?
Never miss important candle closes across multiple timeframes. Perfect if you trade using multiple timeframe analysis or need to time your entries better.
## Settings
- Move displays to any corner
- Change text size
- Pick your colors
- Show only the timeframes you care about
That's it. Simple timing tool for multi-timeframe traders.
Clock

CANDLE_TIME_RDThis tool displays the time of each candle directly on the chart by placing a label below
the bar with an upward-pointing arrow for clear visual alignment. It helps traders quickly
identify the exact timestamp of any candle during fast intraday analysis or historical review.
OVERVIEW
The script extracts the hour and minute of each bar, formats the timestamp according to the
user’s preference, and prints it beneath the candle. This removes the need to rely on the
data window or crosshair for time inspection. It is ideal for ITI evaluation, timestamp
journaling, and precise replay study.
FEATURES
- Prints the time under each candle or every N-th candle using a simple step input.
- Supports both AM/PM and military time through a toggle input.
- Builds all hour and minute text manually to ensure consistent formatting.
- Uses label.style_label_up to draw an arrow pointing toward the candle.
- Positions labels with yloc.belowbar so they do not overlap price bars.
USE CASES
- Reviewing setups with ChatGPT where exact candle timing matters.
- Studying EMA touches, VWAP interactions, or momentum shifts that occur at specific times.
- Journaling entries and exits with precise timestamps.
- Quickly identifying candle times without zooming or opening data windows.
This script is designed for clarity and convenience, improving workflow for structured
intraday traders and replay analysts.

NYSE CME Market Session Clock This indicator can only work on short-term timeframes, since the time before the opening and before the closing of the session is updated only with the appearance of a new candle.

Enterprise Digital Clock Pro# Enterprise Digital Clock Pro - User Documentation
## Overview
Enterprise Digital Clock Pro is a professional-grade trading indicator designed to provide real-time global market session monitoring directly on your chart. This comprehensive tool helps traders stay synchronized with international market hours, track multiple trading sessions simultaneously, and receive timely alerts for market transitions.
## Purpose & Benefits
### Why Use This Indicator?
- **Global Market Awareness**: Monitor up to 8 major financial markets simultaneously
- **Real-Time Updates**: Live clock with second-by-second precision
- **Session Management**: Know exactly when markets open, close, or enter pre/post-market sessions
- **Time Zone Flexibility**: Automatically handles time zone conversions
- **Professional Visualization**: Enterprise-grade display with multiple theme options
- **Trading Efficiency**: Never miss important market openings or closings with alert notifications
### Who Should Use This Indicator?
- International traders managing positions across multiple markets
- Day traders focusing on specific session overlaps
- Institutional traders requiring professional market monitoring
- Anyone trading across different time zones
- Traders seeking better timing for entry and exit points
## Features
### Core Functionality
1. **Real-Time Digital Clock**: Displays current time in your selected timezone with live updates
2. **Multi-Market Dashboard**: Track 8 major global markets simultaneously
3. **Market Status Indicators**: Visual indicators showing:
- LIVE (Market Open)
- CLOSED (Market Closed)
- PRE (Pre-Market)
- POST (After-Hours)
- WKND (Weekend)
4. **Time Until Change**: Shows remaining time until market opens or closes
5. **Alert System**: 5-minute warnings before market transitions
6. **Professional Themes**: Multiple pre-configured color schemes
## Configuration Guide
### 🎨 Theme Settings
#### Theme Preset
Choose from professionally designed themes:
- **Dark Professional**: Modern dark theme with high contrast (Default)
- **Light Corporate**: Clean, bright theme for well-lit environments
- **Bloomberg Terminal**: Classic financial terminal appearance
- **Trading Floor**: Professional trading desk aesthetic
- **Custom**: Create your own color scheme
### ⏰ Clock Settings
#### Local Timezone
Select your preferred timezone from extensive global options. The indicator supports all major financial centers including:
- Americas (New York, Chicago, Los Angeles, Toronto, São Paulo, etc.)
- Europe (London, Frankfurt, Paris, Madrid, Bucharest, etc.)
- Asia-Pacific (Tokyo, Shanghai, Hong Kong, Singapore, Sydney, etc.)
**Default**: Europe/Bucharest
#### Dashboard Position
Choose where the clock appears on your chart:
- Top Right (Default)
- Top Left
- Bottom Right
- Bottom Left
- Top Center
- Bottom Center
#### Clock Text Size
Adjust the main clock display size:
- Small
- Normal
- Large (Default)
#### Market Text Size
Control the size of market information text:
- Small
- Normal (Default)
- Large
### ✨ Visual Enhancements
#### Enable Gradient Effects
Adds subtle gradient transitions to enhance visual appeal
- **Default**: Enabled
#### Enable Shadow Effects
Creates depth with shadow effects for better readability
- **Default**: Enabled
#### Enable Animated Status Indicators
Provides dynamic visual feedback for market status changes
- **Default**: Enabled
#### Corner Radius
Adjust the roundness of dashboard corners (0-5)
- **Default**: 2
#### Border Style
Select the dashboard border appearance:
- None
- Subtle (Default)
- Professional
- Bold
### 🎨 Custom Colors
*Only active when "Custom" theme is selected*
- **Header Background**: Background color for the clock header
- **Header Text**: Text color for the clock display
- **Body Background**: Background color for market information
- **Body Text**: Text color for market listings
- **Accent Color**: Highlight color for important elements
- **Market Open**: Color indicating open markets
- **Market Closed**: Color indicating closed markets
- **Warning/Pre-Market**: Color for warnings and pre-market sessions
### 🌏 Market Display
Toggle visibility for each market:
- **Show Tokyo Market** (Default: On)
- **Show Shanghai Market** (Default: On)
- **Show Hong Kong Market** (Default: On)
- **Show Sydney Market** (Default: On)
- **Show London Market** (Default: On)
- **Show Frankfurt Market** (Default: On)
- **Show Bucharest Market** (Default: On)
- **Show NY Market** (Default: On)
- **Show Time Until Open/Close** (Default: On)
### Market Session Settings
Configure trading hours for each market in 24-hour format (HHMM-HHMM):
#### 🇯🇵 Tokyo Session
- **Trading Hours**: Set Tokyo Stock Exchange hours
- **Default (Winter)**: 0200-0800 (Bucharest time)
#### 🇨🇳 Shanghai Session
- **Trading Hours**: Set Shanghai Stock Exchange hours
- **Default (Winter)**: 0330-0900 (Bucharest time)
#### 🇭🇰 Hong Kong Session
- **Trading Hours**: Set Hong Kong Stock Exchange hours
- **Default (Winter)**: 0330-1000 (Bucharest time)
#### 🇦🇺 Sydney Session
- **Trading Hours**: Set Australian Securities Exchange hours
- **Default (Winter)**: 0100-0700 (Bucharest time)
#### 🇩🇪 Frankfurt Session
- **Trading Hours**: Set Frankfurt Stock Exchange hours
- **Default**: 0900-1830 (Bucharest time)
#### 🇷🇴 Bucharest Session
- **Trading Hours**: Set Bucharest Stock Exchange hours
- **Default**: 0930-1600 (Bucharest time)
#### 🇬🇧 London Session
- **Trading Hours**: Set London Stock Exchange hours
- **Default**: 1000-1830 (Bucharest time)
#### 🇺🇸 New York Session
- **Trading Hours**: Set NYSE/NASDAQ hours
- **Default**: 1630-2300 (Bucharest time)
## Usage Instructions
### Initial Setup
1. Add the indicator to your chart
2. Select your local timezone in Clock Settings
3. Choose your preferred theme or customize colors
4. Select which markets you want to monitor
5. Adjust display position and text sizes to your preference
6. Configure session times if different from defaults
### Reading the Display
The dashboard shows:
- **Top Row**: Current time in your selected timezone
- **Date Row**: Current date and timezone information
- **Market Rows**: Each selected market displays:
- Country flag
- Market name
- Status indicator (LIVE/CLOSED/PRE/POST/WKND)
- Current local time in that market
- Time until next status change (optional)
- **Footer**: Summary of active markets
### Status Indicators Explained
- **● LIVE**: Market is currently open for trading
- **○ CLOSED**: Market is closed
- **◐ PRE**: Pre-market session (1 hour before open)
- **◑ POST**: After-hours session (1 hour after close)
- **◉ WKND**: Weekend (market closed)
### Alert System
The indicator automatically generates alerts:
- 5-minute warning before market opening
- 5-minute warning before market closing
- Alerts appear once per bar to avoid spam
## Best Practices
### For Day Traders
- Focus on markets relevant to your trading pairs
- Use the "Time Until Change" feature to prepare for volatility
- Set alerts for session overlaps (highest liquidity periods)
### For Swing Traders
- Monitor major market opens for gap opportunities
- Track after-hours activity in relevant markets
- Use weekend status to plan Monday strategies
### For International Traders
- Keep all markets visible for complete global overview
- Adjust session times for daylight saving changes
- Use Custom theme to match your trading platform
## Troubleshooting
### Common Issues & Solutions
**Clock not updating:**
- Ensure your chart is on a live/real-time data feed
- Refresh your chart or switch timeframes
**Incorrect market status:**
- Verify session times are correctly configured
- Check if daylight saving time affects your settings
- Ensure weekend detection is working properly
**Display issues:**
- Try different position settings if overlapping with price action
- Adjust text sizes for better visibility
- Switch themes for better contrast
**Time zone confusion:**
- All session times should be entered in your local timezone
- The indicator automatically handles conversions
- Verify your selected timezone matches your actual location
## Tips for Optimal Use
1. **Session Overlap Trading**: The most volatile and liquid periods occur when major sessions overlap
2. **Pre-Market Preparation**: Use PRE status to prepare for market opens
3. **Weekend Planning**: Review weekly performance when all markets show WKND
4. **Mobile Trading**: Choose larger text sizes for mobile device visibility
5. **Multi-Monitor Setup**: Position dashboard on secondary monitors using corner options
## Performance Notes
- The indicator updates in real-time without requiring chart refreshes
- Minimal resource usage ensures smooth chart performance
- Compatible with all timeframes and chart types
- Works seamlessly with other indicators
## Conclusion
Enterprise Digital Clock Pro transforms your trading chart into a professional command center for global market monitoring. Whether you're trading forex during London-New York overlap, catching the Asian session, or monitoring international equities, this indicator ensures you're always synchronized with global markets.
Stay informed, trade professionally, and never miss important market transitions with Enterprise Digital Clock Pro.

Volume Rotor Clock [hapharmonic]🕰️ Volume Rotor Clock
The Volume Rotor Clock is an indicator that separates buy and sell volume, compiling these volumes over a recent number of bars or a specified past period, as defined by the user. This helps to reveal accumulation (buying) or distribution (selling) behavior, showing which side has superior volume. With its unique and beautiful display, the Volume Rotor Clock is more than just a timepiece; it's a dynamic dashboard that visualizes the buying and selling pressure of your favorite symbols, all wrapped in an elegant and fully customizable interface.
Instead of just tracking price, this indicator focuses on the engine behind the movement: volume. It helps you instantly identify which assets are under accumulation (buying) and which are under distribution (selling).
---
🎨 20 Pre-configured Templates
---
🧐 Interpreting the Clock Display
The interface is designed to give you multiple layers of information at a glance. Let's break down what each part represents.
1. The Main Clock Hands (Current Chart Symbol)
The clock hands—hour, minute, and second—are dedicated to the symbol on your current active chart .
Minute Hand: Displays the base currency of the current symbol (e.g., USDT, USD) at its tip.
Hour Hand: Displays the percentage of the winning volume side (buy vs. sell) at its tip.
Color Gauge: The color of the text characters at the tip of both the hour and minute hands acts as your primary volume gauge for the current symbol.
If buy volume is dominant , the text will be green .
If sell volume is dominant , the text will be red .
Tooltip: Hovering your mouse over the text at the tip of the hour or minute or other spherical elements hand will reveal a detailed tooltip with the precise Buy Volume, Sell Volume, Total Volume, Buy %, and Sell % for the current chart's symbol.
2. The Volume Scanner: Bulls & Bears (Symbols Inside the Clock) 🐂🐻
The circular symbols scattered inside the clock face are your multi-symbol volume scanner. They represent the assets you've selected in the indicator's settings.
Green Circles (Bulls - Upper Half): These represent symbols from your list where the total buy volume is greater than the total sell volume over the defined "Lookback" period. They are considered to be under bullish accumulation. The size of the circle and its text grows larger as the buy percentage becomes more dominant. The percentage shown within the circle represents the buy volume's share of the total volume, calculated over the 'Lookback (Bars)' you've set.
Red Circles (Bears - Lower Half): These represent symbols where the total sell volume is greater than the total buy volume. They are considered to be under bearish distribution or selling pressure. The size of the circle indicates the dominance of the sell-side volume. The percentage shown within the circle represents the sell volume's share of the total volume, calculated over the 'Lookback (Bars)' you've set.
3. The Bullish Watchlist (Symbols Above the Clock) ⭐
The symbols arranged neatly along the top edge of the clock are the "best of the bulls." They are symbols that are not only bullish but have also passed an additional, powerful strength filter.
What it Means: A symbol appears here when it shows signs of sustained, high-volume buying interest . It's a way to filter out noise and focus on assets with potentially significant accumulation phases.
The Filter Logic: For a bullish symbol (where total buy volume > total sell volume) to be promoted to the watchlist, its trading volume must meet specific criteria based on this formula:
ta.barssince(not(volume > ta.sma(volume, X))) >= Y
In plain English, this means: The indicator checks how many consecutive bars the `volume` has been greater than its `X`-bar Simple Moving Average (`ta.sma(volume, X)`). If this count is greater than or equal to `Y` bars, the condition is met.
(You can configure `X` (Volume MA Length) and `Y` (Consecutive Days Above MA) in the settings.)
Why it's Useful: This filter is powerful because it looks for consistency . A single spike in volume can be an anomaly. However, when an asset's volume remains consistently above its recent average for several consecutive days, it strongly suggests that larger players or a significant portion of the market are actively accumulating the asset. This sustained interest can often precede a significant upward price trend.
---
⚙️ Indicator Settings Explained
The Volume Rotor Clock is highly customizable. Here’s a detailed walkthrough of every setting available in the "Inputs" tab.
🎨 Color Scheme
This group allows you to control the entire aesthetic of the clock.
Template: Choose from a wide variety of professionally designed color themes.
Use Template: A simple checkbox to switch between using a pre-designed theme and creating your own.
`Checked`: You can select a theme from the dropdown menu, which offers 20 unique templates like "Cyberpunk Neon" or "Forest Green". All custom color settings below will be disabled (grayed out and unclickable).
`Unchecked`: The template dropdown is disabled, and you gain full control over every color element in the sections below.
🖌️ Custom Appearance & Colors
These settings are only active when "Use Template" is unchecked.
Flame Head / Tail: Sets the start and end colors for the dynamic flame effect that traces the clock's border, representing the second hand.
Numbers / Main Numbers: Customize the color of the regular hour numbers (1, 2, 4, 5...) and the main cardinal numbers (3, 6, 9, 12).
Sunburst Colors (1-6): Controls the six colors used in the gradient background for the "sunburst" effect inside the clock face.
Hands & Digital: Fine-tune the colors for the Hour/Minute Hand, Second Hand, central Pivot point, and the digital time display.
Chain Color / Width: Customize the appearance of the two chains holding the clock.
📡 Volume Scanner
Control the behavior of the multi-symbol scanner.
Show Scanner Labels: A master switch to show or hide all the bull/bear symbol circles inside the clock.
Lookback (Bars): A crucial setting that defines the calculation period for buy/sell volume for all scanned symbols. The calculation is a sum over the specified number of recent bars.
`0`: Calculates using the current bar only .
`7`: Calculates the sum of volume over the last 8 bars (the current bar + 7 historical bars).
Symbols List: Here you can enable/disable up to 20 slots and input the ticker for each symbol you want to scan (e.g., BINANCE:BTCUSDT , NASDAQ:AAPL ).
⭐ Bullish Watchlist Filter
Configure the criteria for the elite watchlist symbols displayed above the clock.
Enable Watchlist: A master switch to turn the entire watchlist feature on or off.
Volume MA Length: Sets the lookback period `(X)` for the Simple Moving Average of volume used in the filter.
Consecutive Days Above MA: Sets the minimum number of consecutive days `(Y)` that volume must close above its MA to qualify.
Symbols Per Row: Determines the maximum number of watchlist symbols that can fit in a single row before a new row is created above it.
Background / Text Color: When not using a template, you can set custom colors for the watchlist symbols' background and text.
📏 Position & Size
Adjust the clock's placement and dimensions on your chart.
Clock Timezone: Sets the timezone for the digital and analog time display. You can use standard formats like "America/New_York" or enter "Exchange" to sync with the chart's timezone.
Radius (Bars): Controls the overall size of the clock. The radius is measured in terms of the number of bars on the x-axis.
X Offset (Bars): Moves the entire clock horizontally. Positive values shift it to the right; negative values shift it to the left.
Y Offset (Price %): Moves the entire clock vertically as a percentage of your screen's price pane. Positive values move it up; negative values move it down.

Digital Clock with Candle Alert📊 Digital Clock with Candle Alert
A sleek, customizable digital clock for your trading charts that displays real-time with seconds and provides visual alerts before new candles form. Never miss a candle entry again!
✨ Key Features:
- Real-time Digital Clock - Shows hours, minutes, and seconds in your chosen timezone
- Visual Candle Alerts - Blinking notification before new candles form
- Multi-Timeframe Alerts - Get alerts for any timeframe regardless of your chart period
- Fully Customizable - Colors, size, position, and alert timing all configurable
- Half-Second Blinking - Eye-catching 2Hz blink rate for maximum visibility
- 6 Timezone Options - Exchange, UTC, New York, London, Tokyo, Sydney
🎯 Use Cases:
- Scalping - Know exactly when the next candle will form
- Entry Timing - Perfect for strategies that enter on new candles
- Multi-Timeframe Trading - Monitor higher timeframe candles while on lower timeframes
- General Awareness - Always know the current time in your trading timezone
⚙️ Settings:
Time Settings:
- Timezone selection (Exchange default or specific zones)
Display Options:
- Text and background colors for normal operation
- Alert colors for blinking state
- Text size (tiny to huge)
- Position (9 locations on chart)
Alert Configuration:
- Enable/disable blinking alerts
- Select timeframe to monitor
- Alert lead time (5 seconds to 1 hour)
📝 Important Notes:
- Clock updates depend on incoming price ticks
- During low-volume periods, updates may be less frequent
- Works best on liquid instruments during active market hours
- Alert timeframe is independent of your chart timeframe
💡 Tips:
- Use contrasting alert colors for maximum visibility
- Set lead time based on your reaction needs
- Position clock where it won't obstruct price action
- Try red background with white text for urgent alerts
🔄 Version 1.0 - Initial release

Bitcoin Power Law Clock [LuxAlgo]The Bitcoin Power Law Clock is a unique representation of Bitcoin prices proposed by famous Bitcoin analyst and modeler Giovanni Santostasi.
It displays a clock-like figure with the Bitcoin price and average lines as spirals, as well as the 12, 3, 6, and 9 hour marks as key points in the cycle.
🔶 USAGE
Giovanni Santostasi, Ph.D., is the creator and discoverer of the Bitcoin Power Law Theory. He is passionate about Bitcoin and has 12 years of experience analyzing it and creating price models.
As we can see in the above chart, the tool is super intuitive. It displays a clock-like figure with the current Bitcoin price at 10:20 on a 12-hour scale.
This tool only works on the 1D INDEX:BTCUSD chart. The ticker and timeframe must be exact to ensure proper functionality.
According to the Bitcoin Power Law Theory, the key cycle points are marked at the extremes of the clock: 12, 3, 6, and 9 hours. According to the theory, the current Bitcoin prices are in a frenzied bull market on their way to the top of the cycle.
🔹 Enable/Disable Elements
All of the elements on the clock can be disabled. If you disable them all, only an empty space will remain.
The different charts above show various combinations. Traders can customize the tool to their needs.
🔹 Auto scale
The clock has an auto-scale feature that is enabled by default. Traders can adjust the size of the clock by disabling this feature and setting the size in the settings panel.
The image above shows different configurations of this feature.
🔶 SETTINGS
🔹 Price
Price: Enable/disable price spiral, select color, and enable/disable curved mode
Average: Enable/disable average spiral, select color, and enable/disable curved mode
🔹 Style
Auto scale: Enable/disable automatic scaling or set manual fixed scaling for the spirals
Lines width: Width of each spiral line
Text Size: Select text size for date tags and price scales
Prices: Enable/disable price scales on the x-axis
Handle: Enable/disable clock handle
Halvings: Enable/disable Halvings
Hours: Enable/disable hours and key cycle points
🔹 Time & Price Dashboard
Show Time & Price: Enable/disable time & price dashboard
Location: Dashboard location
Size: Dashboard size

Simple Candle Countdown TimerDescription:
This lightweight and customizable TradingView indicator displays a real-time countdown timer for the current candle directly on your chart. The timer updates every second and shows the time remaining until the current candle closes, in the format MM:SS.
🔧 Features:
Adjustable X/Y offset to position the timer anywhere on the chart
Customizable text color, background color, and text size
Clear and minimal design for easy visibility
Ideal for scalpers, intraday traders, or anyone who wants precise awareness of candle close timing.

Market Clock with Inline HoursThis script displays a powerful, configurable market session clock that shows the open/closed status and trading hours for major global financial markets — including specialized logic for NY Futures (Globex).
🔑 Key Features:
✅ Real-Time Session Status:
Shows whether each selected market is currently OPEN or CLOSED, based on the user’s selected time zone.
✅ NY Futures Weekend Logic:
Built-in logic ensures NY Futures are marked CLOSED:
Friday after 5:00 PM ET
All of Saturday
Sunday until 6:00 PM ET
This reflects the true CME Globex trading schedule.
✅ 12-Hour Format + Timezone Labels:
Session hours are displayed in 12-hour AM/PM format alongside their associated timezone (EST, GMT, JST, etc.) for clarity.
✅ Fully Configurable Markets:
You can choose to display:
NY Market (RTH)
NY Futures (Globex)
London
Tokyo
Frankfurt
And you can easily toggle them on/off in the settings.
✅ Text Size & Position Customization:
Easily control the text size (tiny → huge) and screen position (top/bottom, left/center/right).
✅ Auto Timezone Offset Support:
Select from a list of common time zones (EST, UTC, JST, etc.), or enter your own custom UTC offset for global flexibility.
✅ Compact & Clean Design:
The layout groups each market’s:
Real-time OPEN/CLOSED status
Trading hours
All into a single column, making the layout clean and dashboard-ready.
🧠 Who is this for?
Day traders
Futures traders
Forex traders
Anyone who tracks multiple time zones or global markets
📌 Notes:
Clock updates based on chart timeframe (e.g., every 1m on a 1-minute chart)
Pine Script doesn't support real-time per-second updates, but works well for market status tracking
💬 Feedback Welcome!
This script was designed to be lightweight and user-friendly. Suggestions and improvements are always welcome — feel free to leave a comment or reach out directly.

World Clock [VHX]Keeping track of local times across different time zones has always been a challenge, especially when working with global markets.
But worry no more, as we now have a solution tailored for this very need. With this indicator, you can effortlessly add two different time zones to your chart, making it easier than ever to stay on top of market activity. The indicator not only shows the current date and time for the selected time zones but also integrates seamlessly with your chart, ensuring that you’re always aligned with the right market timings, no matter where you or your trades are based.
Unfortunately, the clock won't function when the market is closed.

4C Data Table SuiteOverview
The 4C Data Table Suite is a versatile TradingView indicator, designed for traders who focus on the critical role of prior bar levels in their strategy. By highlighting the high and low points of previous bars, this tool aids in pinpointing crucial support and resistance zones, which often act as psychological triggers for market participants. The unique feature of this indicator is its dual-color coding: it colors bars green for bullish closes and red for bearish closes in the Prior Bar Table, and for the current timeframe, it highlights whether the current price is above (green) or below (red) these levels.
Concepts
1 — This sophisticated indicator is not just about visual cues; it provides a rich tableau of data including:
• Current timeframe countdown to bar close
• GMT-adjusted clock for precise trade timing
• Real-time updates on market internals and volatility measures such as the NYSE TICK and ATR
2 — The configuration is highly customizable, allowing users to:
• Adjust the table's positioning and text size
• Choose color settings for text, background, and borders to suit their visual preference
• Toggle the display of various data components based on their trading needs
3 — The Prior Bar Table is particularly valuable for:
• Traders using prior bar levels as triggers for trade entries and exits
• Quick visual assessment of market sentiment
• Real-time decision-making supported by dynamic color coding based on current price movements relative to prior highs and lows
Features
• Prior Bar Levels Table: Visualizes high and low levels of prior bars with intuitive color coding, aiding traders in assessing market trends.
• Dynamic Color Coding: Updates colors based on the closure of the previous bar and current price positions relative to the past bar's highs and lows.
• Comprehensive Market Data: Includes a suite of essential data such as market internals, the prior bar’s range, and the latest price information.
• Customizable Visuals: Offers extensive options for customizing the appearance and data presented, ensuring the tool fits seamlessly into any trader's strategy.
How to Use
1. To add the indicator, search for "4C Data Table Suite" under indicators on TradingView and apply it to your chart.
2. Navigate to the indicator settings to customize the display properties, including table position, color schemes, and which data points to display.
3. Utilize the toggles within the "Prior Bar Levels Table" settings to adjust the visibility and behavior of the table, depending on your trading approach.
Limitations
• This indicator is optimized for use on time-based charts and may not perform as intended on tick charts or non-standard timeframes.
• The color coding is based on the closure of bars, which may not always reflect intrabar movements, potentially affecting real-time decision-making in highly volatile markets.
Notes
• Ensure your TradingView interface is set to the correct timezone settings to align the GMT clock accurately.
• The dynamic color updates are designed to provide at-a-glance insights but should be used in conjunction with other analysis tools for best results.
*If you find that the indicator is blocking some of the candles at the bottom of the screen, go to (Chart) Settings, Canvas, and then adjust the Bottom/Top margin by increasing the % Amount.
Thanks
Special thanks to the TradingView community and developers whose feedback and insights have helped refine the functionalities of the 4C Data Table Suite. Your collaborative spirit is what makes continuous improvement possible.

TimeFiesta by Billy Rock
Introducing TimeFiesta, a unique and fun digital clock timer for TradingView charts, created by Billy Rock. TimeFiesta is designed to help traders, especially scalpers, stay on top of multiple time frame closes with ease.
Features of TimeFiesta:
Customizable display of timer for Current Time Frame, 15 Minutes, 1 Hour, and 4 Hours.
Options to turn ON/OFF each time frame display as per the user's preference.
Adjustable digital clock text size: Small, Medium, and Large.
Multiple location options for the digital clock timer: Top Center, Top Right, and Bottom Right.
TimeFiesta is the perfect companion for those who need to keep an eye on multiple time frames while trading. Its sleek design and user-friendly interface make it a must- have tool for traders of all levels. With TimeFiesta, you'll never miss a crucial time frame close again!
Give credit where it's due: TimeFiesta is created by the talented Billy Rock. Be sure to try this fantastic tool and enhance your trading experience!

MILK (My Intraday Lazy Kit)I made this script to group information considered useful in forex day trading, of course it can be used on crypto or other markets.
First of all, feel free to suggest any improvement/new feature you would consider interesting for such an use. This is not especially a final version and I'm sure other relevant information can be added in this tool.
Current features are the following
An international clock showing time and session status (open/closed) for 5 different cities. You can modify it in parameters.
Drawings of previous days/weeks open/high/low/close prices, which will be often used as supports and resistances zones.
The Clock shows
City
Time (with a bgcolor corresponding to the "period" of the day (Morning, Afternoon, Evening, Night)
Session status (Cyan when the corresponding session is open, blue when it's closed)
Price levels names are
YTD-H : Yesterday's high
YTD-L : Yesterday's low
YTD-C : Yesterday's close
YTD-O : Yesterday's open
PWH : Previous week high
PWL : Previous week low
PWO : Previous week open
PWC : Previous week close
Levels width and colors can be modified.
You can also enable/disable the clock, and daily or weekly levels in the options panel.
Nothing more to say for now, I mainly integrated information I like to have, but I'll probably add new features in it if I get some.

[5F] Multi clocks📋 Description :
This script displays three customizable clocks.
You can use it on chart too.
Works only in real time, not for replay.
🛠 Options :
Activate or not each clock
Time zone
Color and size in % of text and background
The script can be placed on the chart and in this case it is possible to change the position of each clock
Thanks to all Pinecoders who share their work with the community, in particular (non exhaustive list) :
LonesomeTheBlue, RafaelZioni, dgtrd, allanster, JayRogers , ChuckBanger, cheatcountry, NeoButane, ChrisMoody, QuantTherapy, J-Streak, makit0, john_everist, JustUncleL, everget, Duyck, KivancOzbilgic, LucF, HammondB3, blackcat1402, alexgrover, Mohamed3nan, DonovanWall, RicardoSantos, LazyBear, PRO_Indicators, theheirophant, midtownsk8rguy, e2e4mfck, SeaSide420, xel_arjona, RagingRocketBull, yatrader2, racer8, xdecow, Daveatt, QuantNomad, ceyhun, BigBitsIO, tista, aamonkey, rthomson, bgeraghty, pAulseperformance, rumpypumpydumpy
Another example :

TWP Next Bar Close Countdown█ OVERVIEW
This script displays the time remaining for your charts current timeframe.period or a higher timeframe with the ability to create alerts that ping on the opening of the new bar that you have selected. It can be very easy to get bogged down in the charts when day trading on smaller timeframes and forgetting that it is the wave of longer timeframe traders that are setting the tone. This script was born out of this pitfall that I was noticing in my own trading.
█ CONCEPTS
The script uses a series of functions to get produce the time remaining and texts for the top and bottom rows within the table display.
█ FEATURES
1 — Resolution
• Auto / Manual selection
• There is tooltip explains how the automatic time selection operates (see below)
AUTO_TIMEFRAME_TOOLTIP = "When the Auto option is selected, the timeframe of the indicator is chosen automatically based on the chart timeframe. The Timeframe dropdown is ignored. The automated timeframes are:
'10 minutes' for any chart timeframes below '1 minute'
'1 hour' for any chart timeframes starting from '1 minute' up to '5 minutes'
'4 hours' for any chart timeframes starting from '5 minutes' up to '60 minutes'
'1 day' for any chart timeframes starting from '1 hour' up to '4 hours'
'1 week' for any chart timeframes starting from '4 hours' up to '1 day'
'1 month' for any timeframes starting from '1 day' up to '1 week'
'3 months' for any timeframes starting from '1 week' up to '1 month'
'12 months' for any timeframes above '1 month'"
2 — Text
• Size selection
• Color selection
3 — Display
• Frame color selection
• Display position selection
4 — Alerts
• Market session selection
█ HOW TO USE
• Add it to your chart, select your timeframe, change up your colors, and enjoy yourself
█ NOTES
• We have no control over when realtime updates occur. A realtime bar can open, and then no realtime updates can occur until the open of the next realtime bar. The time between updates can vary considerably. For more please check out Pine's execution model and bar states.
• As a reminder, I did make this script for myself so if you find that you are using a 2-hour alert or countdown the formatting for the words may not be succinct as they should be. We will write that loss off to my growing pine skills
█ LIMITATIONS
• You will not be able to retrieve the time from a timeframe smaller than what is currently selected for the chart.

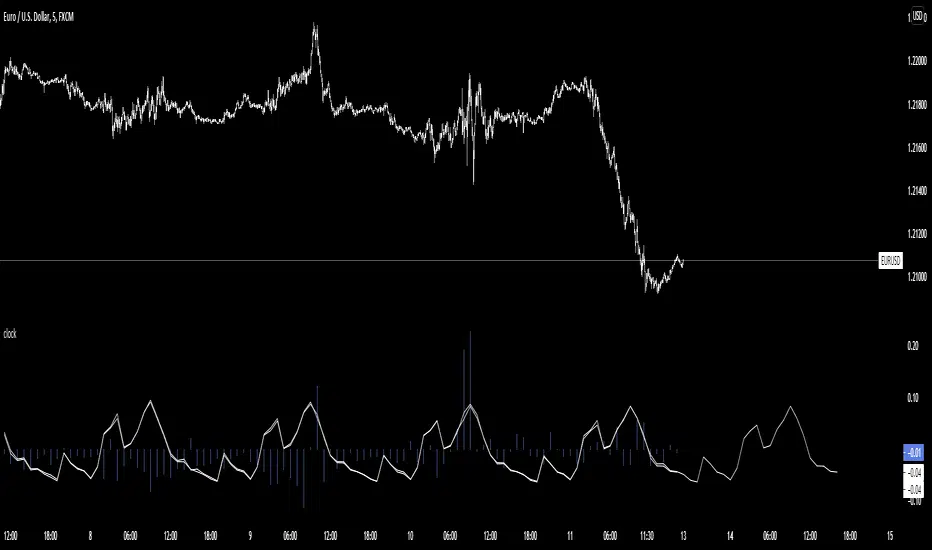
CUSTOM intraday volatility chart clockChart clock showing an overview of the day's expected and actual intraday volatility.
In white are only the expected volatility scores. The expected increase or decrease in volatility at any given hour of day compared to the average of the whole day's expected volatility. A 0.5 score two hours from now means that you can expect that hour to be 0.5% more volatile than the average of whole day's volatility.
In blue are the actual or realized volatility scores; the difference between that hour's volatility and what was expected to be its volatility is displayed as a blue bar. If two three hours ago was expected to be a more volatile hour of the day but no movement occurred, a large down bar will print for that hour.
Large swings of daily volatility (i.e. this month is much more or much less volatility than the last) will bias the clock usually only a little higher or lower, although historical volatility peaks/depressions will show the blue realized volatility score to be consistently high/low.
If requested I can change the look of the indicator or add input settings for the input length of clock, which for now is set to 20 bars, which is an approximation of the last month's realized volatility.
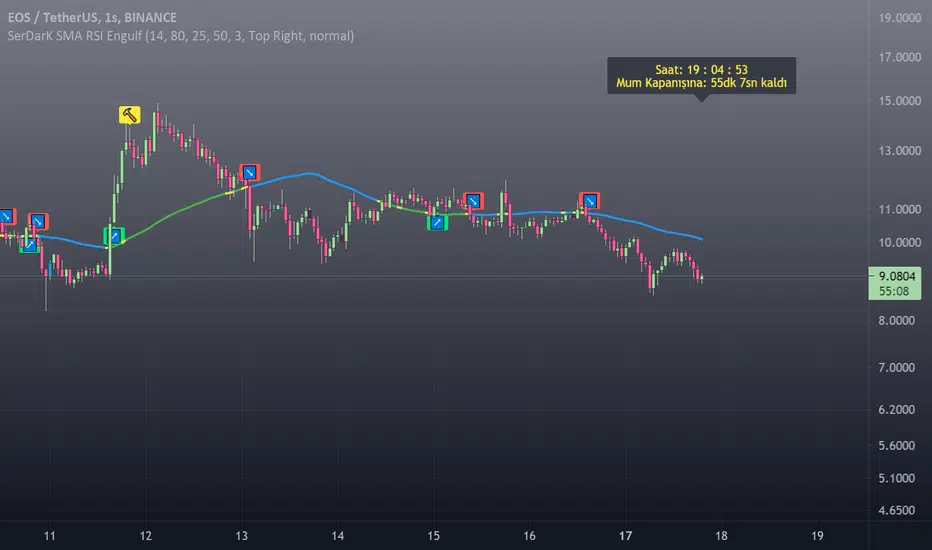
[SerDarK] SMA RSI Engulfing BarENG: This indicator includes the SMA line colored according to the price position, the RSI to identify the bearish or the bullish points, the Engulfing bars, the clock and the information panel showing the countdown to the candle closing.
SMA: default period is set to 50. It can change from the settings.
Definition of SMA line default colors: When the price is below the SMA line, its color is blue. It is green when the price is above the SMA line. It is yellow in RSI alerts and when the price hits the SMA line.
RSI: default period 14 is set. It can be changed in the settings.
🔨 Hammer Emoji: RSI is located at the overbought turnaround point. This sign does not mean that the trend will definitely return.
🚀Rocket Emoji: Tries to catch the "RSI oversold point turn".This sign does not mean that the trend will definitely return.
↗️↘️Up and Down arrows emojis. After the price crosses the SMA line, it indicates that it is closing a candle in that direction.
Engulfing candles: bullish engulfing candle is blue color. Bear engulfing candle is black in color.colors can be changed in settings.
Note that this indicator is only an indicator. It does not give advice on buying or selling.
Enjoy
TUR: Bu indikatör, fiyat konumuna göre renklendirilmiş SMA çizgisi, RSI ile düşüş veya yükseliş noktalarını belirleme, Engulfing (Yutan) barlar , saat ve mum kapanışı için geri sayım gösteren bilgi paneli içermektedir.
SMA: varsayılan periyodu 50 ayarlıdır. Ayarlardan değiştirebilir.
SMA çizgisi varsayılan renklerinin tanımı: Fiyat SMA çizgisi altında iken rengi mavidir. Fiyat SMA çizgisi üstünde iken yeşildir. RSI uyarılarında ve fiyat SMA çizgisine temas ettiğinde sarı renktedir.
RSI: varsayılan periyodu 14 ayarlanmıştır. Ayarlardan değiştirilebilir.
🔨 Çekiç Emojisi: RSI aşırı alım dönüş noktasında bulunur. Bu işaret trendin kesin döneceği anlamına gelmez.
🚀Roket Emojisi: "RSI aşırı satım noktası dönüşünü "yakalamaya çalışır. Bu işaret trendin kesin döneceği anlamına gelmez.
↗️↘️Yukarı ve Aşağı yönlü okl emojileri. Fiyat SMA çizgisini kestikten sonra, o yönde mum kapattığını gösterir.
Engulfing mumları: bullish engulfing (yutan boğa) mumu mavi renktir. Bear engulfing (yutan ayı) mumu siyah renktir. Renkler ayarlardan değiştirilebilir.
Not: Bu indikatörün yalnızca gösterge olduğunu unutmayın. Alma satma tavsiyesi vermez.
Kalan süre etiketi BIST gibi sınırlı süreli sembollerde, gün ve daha üstü periyotlarda doğru çalışmayabiliyor.
Analog/Digital World Clock by DGTWorld Clocks - something for fun
Happy New Year!
ps: in case no update on the charts then the clock will not update too and will lag or stop till a new update is received

Clock [Example]Hello All,
I published this script as an example. it calculates/show current Hour, Minute and Second by using timenow function, it also show remaining time to close of the candle. You can freely use the source code in your scripts if you need.
"A man who dares to waste one hour of time has not discovered the value of life" - Charles Darwin
Enjoy!

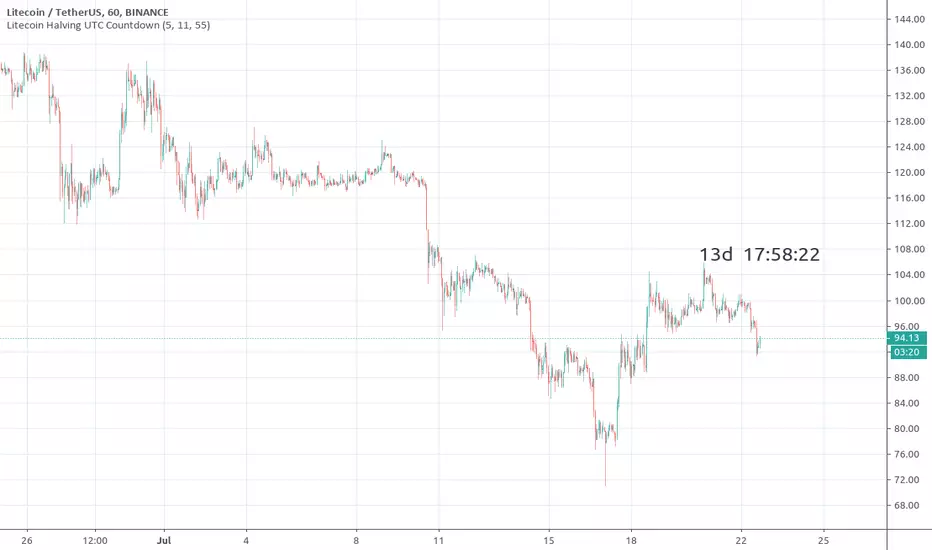
[RESEARCH] Litecoin Halving UTC CountdownAccording to this source www.litecoinblockhalf.com
The day, hour and minute of the halving date can be customized manually in case of mining troubles.
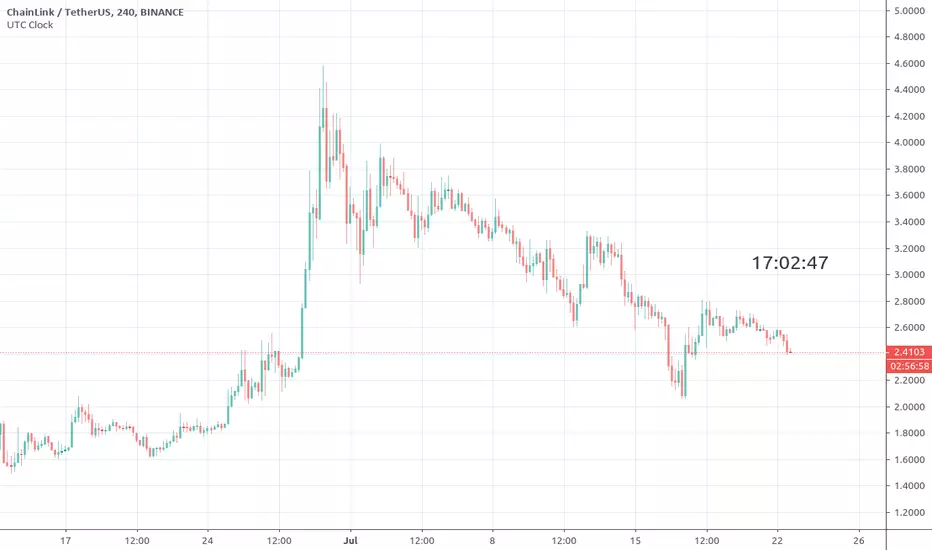
[RESEARCH] UTC ClockThe one of the most important indicators every trader must use is time :)
Sometimes it has a lag due to the script recalculation per each candle tick (not every second)
Clock on 7 segment displayIt's a old fashion clock, don't ask me why I'have done this... but it work ^^
Just 7 segment display, is you would like to display numbers you can use this code.
Of course you can the same logique with 10 plotchar (for 0123456789) for each digit but tradingview limit at 64 the number of plots, so you will be limited at 6 digits.
The advantage of 7 segment display it's that you can display 9 digits :)
