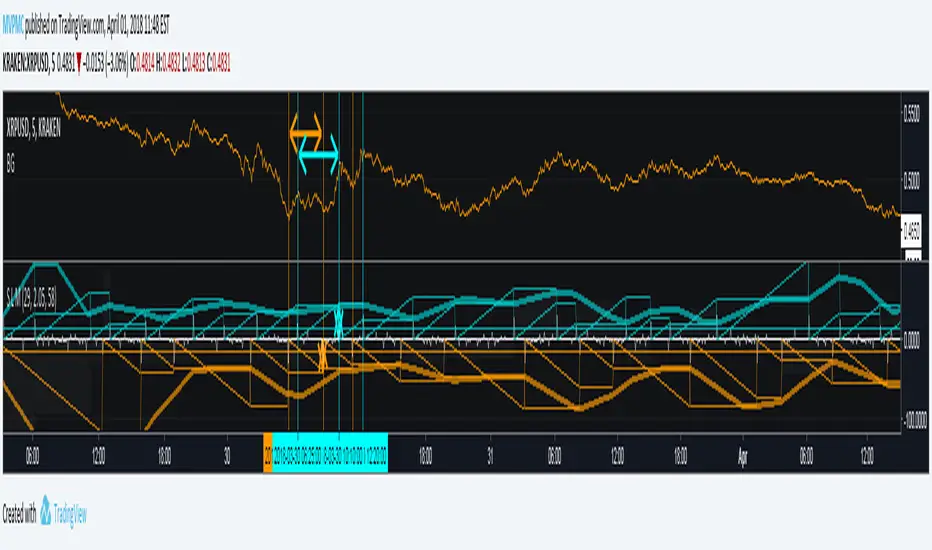
CMYK  RYTHM ◊ Introduction  
This script makes use of a sliding matrix, to search the highest/lowest point in the slider, it then counts the amount of times it was high/low, giving the distance from a previous high/low.
Every High/low are granted values, being a lower value for shorted periods, and a larger value for Longer periods.
This reveals the different period lengths of active frequencies.
Doing this with different slider lenghts would result in measuring with different mean period lenghts.
 ◊ Origin  
From my dream last night.
 This is a part of Project XIAM.  
 ◊ Theoretical Approach  
Philosophy β :: Rythmic 
 Searching for the period lenght of several frequencys at once. 
 ◊ Usage  
This is an alalythical tool, to be used for Automatically adjusting settings on Indicators that presume a period length for calculation.
Calculations are based on Past values, and no reversal measures or fail-safes are applied, so it will only be useful during a continuation of trend.
 ◊ Features  
Matrix Calculation of Lowest/Highest points in a sliding series with Steady Length.
In the future Several slider lenghts will be applied to search for Frequencies of different magnitudes.
Lenght between TOPS, DIPS , and an SMA that smoothens this.
BIAS Is TOP to DIP Minus DIP to TOP, to uncover Bullish/Bearish index of market movements.
 ◊ Community  
 CMYK ::  discord.gg 
 AUTOVIEW ::  discordapp.com 
 TRADINGVIEW UNOFFICIAL ::  discord.gg 
Cmyk
CMYK RMI TRIPLE◊ Introduction  
This script makes use of three RMI's, to indicate Overbought/Oversold.
Adjustments can easily be made, through its settings or script. 
 ◊ Origin  
The Relative Momentum Index was developed by Roger Altman and was introduced in his article in the February, 1993 issue of Technical Analysis of Stocks & Commodities magazine. 
While RSI counts up and down days from close to close, the Relative Momentum Index counts up and down days from the close relative to a close x number of days ago. 
This results in an RSI that is smoother. 
 This is a part of Project XIAM.  
 ◊ Theoretical Approach  
Philosophy γ :: consequential 
 ◊ Usage  
You can use this as an indicator for manual trading, or apply AUTOTVIEW to automate your trading.
My advice is to combine this with another indicator before you do this.
The script is written in an organized and flexible manner to do this.
 ◊ Features  
 
 3 RMI's with seperately adjustable HIGH / LOW levels.
 Trend adjustment on the SLOW RMI.
 Adjustable Interval between entries / Once per dip-top entry.
 Take Profit & Stop loss 
 
 ◊ Community  
Wanna share your findings ? or need help resolving a problem ? 
 CMYK ::  discord.gg 
 AUTOVIEW ::  discordapp.com 
 TRADINGVIEW UNOFFICIAL ::  discord.gg
CMYK  MOVEMENT / FORCE ◊ Introduction  
Price Movement / Force
A script that uses Volume and price movement to indicate Bullish/Bearish momentum, like a hindsight MACD.
 ◊ Origin  
 This is a part of Project XIAM.  
◊ Theoretical Approach 
Philosophy γ :: consequential
 ◊ Usage  
Early Indication of Bullish/Bearish momentum, before price reversal.
 CLEANSIGNAL  can be used as input source, for more reliable results.
 Currently BTC◊USD ETH◊USD XRP◊USD Are available in my scripts. 
Otherwise the ticker's volume is used as input.
 My own indicators will be updated soon, to include source selection in their settings.  
 ◊ Features  
 BULL / BEAR Phase  to open orders.   ( HINT : combine with RSI ? )
 EXIT sweep  : to find appropriate exit moments, to close opened orders.
Sweep is muffled if Phase continues.
Sweep Finalize send final EXIT signal.
 ◊ Community  
Wanna share your findings ? or need help resolving a problem ? 
CMYK :: discord.gg 
AUTOVIEW :: discordapp.com 
TRADINGVIEW UNOFFICIAL :: discord.gg
CMYK  CLEANSIGNAL  XRPUSD ◊ Introduction  
This is CLEANSIGNAL 
A script that combines Ticker data from multiple exchanges to create a more reliable source. 
 ◊ Origin  
 This is a part of Project XIAM.  
◊ Theoretical Approach 
Philosophy a :: Cleansignal 
 ◊ Usage  
This is a source script intended to replace your current ticker. 
 You can apply Indicators on this script , just select the source in their settings. 
 My own indicators will be updated soon, to include source selection in their settings.  
 ◊ Features  
Close / High / Low /  Volume  data from 6 exchanges ! 
 BITFINEX ◊ BITSTAMP ◊ BITTREX ◊ BINANCE ◊ POLONIEX ◊ KRAKEN  
 ◊ Community  
Wanna share your findings ? or need help resolving a problem ? 
 CMYK :: discord.gg 
AUTOVIEW :: discordapp.com 
TRADINGVIEW UNOFFICIAL :: discord.gg
CMYK CLEANSIGNAL  ETHUSD ◊ Introduction  
This is CLEANSIGNAL 
A script that combines Ticker data from multiple exchanges to create a more reliable source. 
 ◊ Origin  
 This is a part of Project XIAM.  
◊ Theoretical Approach 
Philosophy a :: Cleansignal 
 ◊ Usage  
This is a source script intended to replace your current ticker. 
 You can apply Indicators on this script , just select the source in their settings. 
 My own indicators will be updated soon, to include source selection in their settings.  
 ◊ Features  
Close / High / Low /  Volume  data from 10 exchanges ! 
 BITFINEX ◊ BITSTAMP ◊ COINBASE ◊ CEXIO ◊ WEX ◊ HITBTC ◊ GEMINI ◊ POLONIEX ◊ OKCOIN ◊ KRAKEN  
 ◊ Community  
Wanna share your findings ? or need help resolving a problem ? 
 CMYK :: discord.gg 
AUTOVIEW :: discordapp.com 
TRADINGVIEW UNOFFICIAL :: discord.gg
 CMYK  CLEANSIGNAL  BTCUSD◊ Introduction  
This is CLEANSIGNAL 
A script that combines Ticker data from multiple exchanges to create a more reliable source. 
 ◊ Origin  
 This is a part of Project XIAM.  
◊ Theoretical Approach 
Philosophy a :: Cleansignal 
 ◊ Usage  
This is a source script intended to replace your current ticker. 
 You can apply Indicators on this script , just select the source in their settings. 
 My own indicators will be updated soon, to include source selection in their settings.  
 ◊ Features  
Close / High / Low /  Volume  data from 10 exchanges ! 
 BITFINEX ◊ BITSTAMP ◊ COINBASE ◊ CEXIO ◊ WEX -0.71% ◊ HITBTC ◊ GEMINI ◊ ITBIT ◊ BITMeX ◊ KRAKEN  
 ◊ Community  
Wanna share your findings ? or need help resolving a problem ? 
 CMYK :: discord.gg 
AUTOVIEW :: discordapp.com 
TRADINGVIEW UNOFFICIAL :: discord.gg
CMYK XIAM  OPEN◊ Introduction  
This is project XIAM, a work in progress.
Recently i came across the repainting problem.
Since then i haven't seen any bot-code that makes > 5% profit in two weeks with 0.25% fees/trade.
People who make good bots either bluff or don't share the code.
they let you rent it.
I aim to understand, learn it, write it myself. And share my findings with whoever shares with me.
 ◊ Origin  
Based on RMI (RSI with momentum) and SMA, and values derived from those.
 ◊ Usage  
Currently an investigative script.
 ◊ Theoretical Approaches  
 Philosophy α :: Cleansignal 
:: Cleaning up the signal, from irregularities that cause unpredictable results.
 
  Merging available tickers of a pair into one. 
  Merging available tickers of different coins into one in the correct proportion. (eg. Crypto market cap)
  Removing Jitter, and smoothing signal without delay.
 
 Philosophy β :: Rythmic 
:: Syncing into the rythm's, to never miss the que, and trade on every theoretical low/high
 
  Searching Amplitude, Period, Phase Shift, Frequency's of the carrier waves.
  Marking Acrivity/inactivity of the carrier waves.
  Partial Fractal repetition asses-able with above data?
 
 Philosophy γ :: consequential 
:: Seeking for Indicatory events and causal relations
 
  Probability / reward.
  Confirmation and culmination.
  ...
 
 ◊ Community 
Wanna share your findings ? or need help resolving a problem ?
 CMYK  :: discord.gg
 AUTOTVIEW  :: discordapp.com
CMYK VRMI◊ Introduction  
This script indicates the relative movement of  price x volume.
 ◊ Origin  
Based on 'The Relative Momentum Index' by Roger Altman : February, 1993 issue of Technical Analysis of Stocks & Commodities magazine. 
While RSI counts up and down days from close to close, the Relative Momentum Index counts up and down days from the close relative to a close x number of days ago. 
This results in an RSI that is smoother. The input has been changed to the change of a smoothed close multiplied by a smoothed volume.
The polarity of VRMI indicates bearish/bullish movement.
 ◊ Adjustments  
CMYK color theme applied. 
 ◊ Usage  
VRMI indicates the force the market moves with.
 ◊ Future Prospects  
-
 ◊ ◊ ◊ ◊ ◊ ◊ ◊ ◊ ◊ ◊ ◊ ◊ ◊ ◊ ◊ ◊ ◊ ◊ ◊ ◊ ◊ ◊ ◊ ◊ ◊ ◊ ◊ ◊ ◊ ◊ ◊ ◊ ◊ ◊ ◊ ◊ ◊ ◊ ◊ ◊ ◊ ◊ ◊ ◊ ◊ ◊ ◊ ◊ ◊ ◊ ◊ ◊ ◊ ◊ ◊ ◊ ◊ ◊ ◊ ◊ ◊ ◊ ◊ ◊ ◊ ◊ ◊ ◊ ◊ ◊ ◊ ◊ ◊ ◊ ◊ ◊ ◊ ◊ ◊ ◊ ◊ ◊ ◊ ◊ ◊ ◊ ◊ ◊ ◊ ◊ ◊ ◊ ◊ ◊ ◊ ◊ ◊ ◊ ◊ ◊ ◊ ◊ ◊ ◊ ◊ ◊
CMYK VRMI RAYS ◊ Introduction  
Introducing VRMI in this script, an RMI based on price movement and volume, to indicate bullish and bearish trends.
This script marks the background depending on RMI <> VRMI , VRMI polarity and large buy/sell sprees.
 ◊ Origin  
Based on 'The Relative Momentum Index'  by Roger Altman : February, 1993 issue of Technical Analysis of Stocks & Commodities magazine. 
While RSI counts up and down days from close to close, the Relative Momentum Index counts up and down days from the close relative to a close x number of days ago. 
This results in an RSI that is smoother.
In addition VRMI reacts quick, it is used to cut off latency from RMI, and it's polarity indicates the beginning and end of a trend.
Large buy sell sprees and detected in their proportion with an sma on the volume
 ◊ Adjustments  
CMYK color theme applied. 
 ◊ Usage  
This indicator can be used to detect trends and mark reversals.
 ◊ Prospects  
◊ ◊ ◊ ◊ ◊ ◊ ◊ ◊ ◊ ◊ ◊ ◊ ◊ ◊ ◊ ◊ ◊ ◊ ◊ ◊ ◊ ◊ ◊ ◊ ◊ ◊ ◊ ◊ ◊ ◊ ◊ ◊ ◊ ◊ ◊ ◊ ◊ ◊ ◊ ◊ ◊ ◊ ◊ ◊ ◊ ◊ ◊ ◊ ◊ ◊ ◊ ◊ ◊ ◊ ◊ ◊ ◊ ◊ ◊ ◊ ◊ ◊ ◊ ◊ ◊ ◊ ◊ ◊ ◊ ◊ ◊ ◊ ◊ ◊ ◊ ◊ ◊ ◊ ◊ ◊ ◊ ◊ ◊ ◊ ◊ ◊ ◊ ◊ ◊ ◊ ◊ ◊ ◊ ◊ ◊ ◊ ◊ ◊ ◊ ◊ ◊ ◊ ◊ ◊ ◊ ◊ 
CMYK  VOLUME CROPPED ◊ Introduction  
This is a simple volume script, colored in the CMYK theme.
Cropping occurs when VOLUME > 5 * EMA, and is Shown with a transparant bar across the screen.
This way, large volume peaks don't influence scaling anymore.
 ◊ Adjustments  
CMYK color theme applied. 
Crops volume peaks, to preserve scaling.
 ◊ Usage  
Indicates Volume
 ◊ Future Prospects  
None
 ◊ ◊ ◊ ◊ ◊ ◊ ◊ ◊ ◊ ◊ ◊ ◊ ◊ ◊ ◊ ◊ ◊ ◊ ◊ ◊ ◊ ◊ ◊ ◊ ◊ ◊ ◊ ◊ ◊ ◊ ◊ ◊ ◊ ◊ ◊ ◊ ◊ ◊ ◊ ◊ ◊ ◊ ◊  CMYK SCRIPTS  ◊ ◊ ◊ ◊ ◊ ◊ ◊ ◊ ◊ ◊ ◊ ◊ ◊ ◊ ◊ ◊ ◊ ◊ ◊ ◊ ◊ ◊ ◊ ◊ ◊ ◊ ◊ ◊ ◊ ◊ ◊ ◊ ◊ ◊ ◊ ◊ ◊ ◊ ◊ ◊ ◊ ◊ ◊ ◊ ◊ ◊ ◊ ◊ ◊ ◊ ◊  
░▒▓█ CMYK ◊ VOLUME █▓▒░ 
░▒▓█ CMYK ◊ RMI █▓▒░ 
░▒▓█ CMYK ◊ RMI ARROWS █▓▒░ 
░▒▓█ CMYK ◊ HIGH LOW █▓▒░ 
CMYK VOLUME ◊ Introduction  
This is a simple volume script, colored in the CMYK theme.
 ◊ Adjustments  
CMYK color theme applied. 
 ◊ Usage  
Indicates Volume
 ◊ Future Prospects  
None
 ◊ ◊ ◊ ◊ ◊ ◊ ◊ ◊ ◊ ◊ ◊ ◊ ◊ ◊ ◊ ◊ ◊ ◊ ◊ ◊ ◊ ◊ ◊ ◊ ◊ ◊ ◊ ◊ ◊ ◊ ◊ ◊ ◊ ◊ ◊ ◊ ◊ ◊ ◊ ◊ ◊ ◊ ◊  CMYK SCRIPTS  ◊ ◊ ◊ ◊ ◊ ◊ ◊ ◊ ◊ ◊ ◊ ◊ ◊ ◊ ◊ ◊ ◊ ◊ ◊ ◊ ◊ ◊ ◊ ◊ ◊ ◊ ◊ ◊ ◊ ◊ ◊ ◊ ◊ ◊ ◊ ◊ ◊ ◊ ◊ ◊ ◊ ◊ ◊ ◊ ◊ ◊ ◊ ◊ ◊ ◊ ◊  
░▒▓█ CMYK ◊ RMI █▓▒░ 
░▒▓█ CMYK ◊ RMI ARROWS █▓▒░ 
░▒▓█ CMYK ◊ HIGH LOW █▓▒░ 
CMYK  RMI ARROWS◊ Introduction  
I started using this script because of its fast reaction, and good tell for buy/sell moments. 
For larger timescales, the overall trend should be taken into account regarding the levels. 
In the future i will update this indicator, to automatically adjust those. 
This is the Overlay expansion of the Indicator Linked below.
 ◊ Origin  
The Relative Momentum Index was developed by Roger Altman and was introduced in his article in the February, 1993 issue of Technical Analysis of Stocks & Commodities magazine. 
While RSI counts up and down days from close to close, the Relative Momentum Index counts up and down days from the close relative to a close x number of days ago. 
This results in an RSI that is smoother. 
 ◊ Adjustments  
CMYK color theme applied. 
Four levels to indicate intensity. 
Two Timescales, to overview the broader trend, and fast movements. 
 ◊ Usage  
RMI indicates overbought and oversold zones, and can be used for divergence and trend analysis. 
 ◊ Future Prospects  
Self adjusting levels, relative to an SMA trend. 
Alternative RMI, which functions as an overlay. 
◊ ◊ ◊ ◊ ◊ ◊ ◊ ◊ ◊ ◊ ◊ ◊ ◊ ◊ ◊ ◊ ◊ ◊ ◊ ◊ ◊ ◊ ◊ ◊ ◊ ◊ ◊ ◊ ◊ ◊ ◊ ◊ ◊ ◊ ◊ ◊ ◊ ◊ ◊ ◊ ◊ ◊ ◊ ◊ ◊ ◊ ◊ ◊ ◊ ◊ ◊ ◊ ◊ ◊ ◊ ◊ ◊ ◊ ◊ ◊ ◊ ◊ ◊ ◊ ◊ ◊ ◊ ◊ ◊ ◊ ◊ ◊ ◊ ◊ ◊ ◊ ◊ ◊ ◊ ◊ ◊ ◊ ◊ ◊ ◊ ◊ ◊ ◊ ◊ ◊ ◊ ◊ ◊ ◊ ◊ ◊ ◊ ◊ ◊ ◊ ◊ ◊ ◊ ◊ ◊ ◊
░▒▓█ CMYK ◊ RMI █▓▒░
 
CMYK HIGH LOW◊ Introduction 
This script is intended do display High and Low values, alongside Highest and Lowest of an adjustable period  
◊ Adjustments 
CMYK color theme applied. 
Price color changes if EMA  >< EMA 
◊ Usage 
For those who use Line, Break, or Area Type Charts.
Usefull to quickly display proper levels for buying selling on minute-term trading
◊ Future Prospects 
Somehow displaying the highest & Lowest values in a large font.
◊ ◊ ◊ ◊ ◊ ◊ ◊ ◊ ◊ ◊ ◊ ◊ ◊ ◊ ◊ ◊ ◊ ◊ ◊ ◊ ◊ ◊ ◊ ◊ ◊ ◊ ◊ ◊ ◊ ◊ ◊ ◊ ◊ ◊ ◊ ◊ ◊ ◊ ◊ ◊ ◊ ◊ ◊ ◊ ◊ ◊ ◊ ◊ ◊ ◊ ◊ ◊ ◊ ◊ ◊ ◊ ◊ ◊ ◊ ◊ ◊ ◊ ◊ ◊ ◊ ◊ ◊ ◊ ◊ ◊ ◊ ◊ ◊ ◊ ◊ ◊ ◊ ◊ ◊ ◊ ◊ ◊ ◊ ◊ ◊ ◊ ◊ ◊ ◊ ◊ ◊ ◊ ◊ ◊ ◊ ◊ ◊ ◊ ◊ ◊ ◊ ◊ ◊ ◊ ◊ ◊
CMYK  RMI◊ Introduction 
I started using this script because of its fast reaction, and good tell for buy/sell moments on a short timescale.
For larger timescales, the overall trend should be taken into account regarding the levels.
In the future i will update this indicator, to automatically adjust those.
 ◊ Origin  
The Relative Momentum Index was developed by Roger Altman and was introduced in his article in the February, 1993 issue of Technical Analysis of Stocks & Commodities magazine. 
While RSI counts up and down days from close to close, the Relative Momentum Index counts up and down days from the close relative to a close x number of days ago.
This results in an RSI that is smoother. 
 ◊ Adjustments 
CMYK color theme applied.
Four levels to indicate intensity.  
Two Timescales, to overview the broader trend, and fast movements.
 ◊ Usage 
RMI indicates overbought and oversold zones, and can be used for divergence and trend analysis.
 ◊ Future Prospects 
Self adjusting levels, relative to an SMA trend.
Alternative RMI, which functions as an overlay.
 ◊ ◊ ◊ ◊ ◊ ◊ ◊ ◊ ◊ ◊ ◊ ◊ ◊ ◊ ◊ ◊ ◊ ◊ ◊ ◊ ◊ ◊ ◊ ◊ ◊ ◊ ◊ ◊ ◊ ◊ ◊ ◊ ◊ ◊ ◊ ◊ ◊ ◊ ◊ ◊ ◊ ◊ ◊ ◊ ◊ ◊ ◊ ◊ ◊ ◊ ◊ ◊ ◊ ◊ ◊ ◊ ◊ ◊ ◊ ◊ ◊ ◊ ◊ ◊ ◊ ◊ ◊ ◊ ◊ ◊ ◊ ◊ ◊ ◊ ◊ ◊ ◊ ◊ ◊ ◊ ◊ ◊ ◊ ◊ ◊ ◊ ◊ ◊ ◊ ◊ ◊ ◊ ◊ ◊ ◊ ◊ ◊ ◊ ◊ ◊ ◊ ◊ ◊ ◊ ◊ ◊ 


