Spearman Rank Correlation CoefficientI'm pleased to introduce this script in honor of the new array functions introduced to PineScript version 4.0. This update is a long time coming and opens the door to amazing scripting possibilities!
Definition
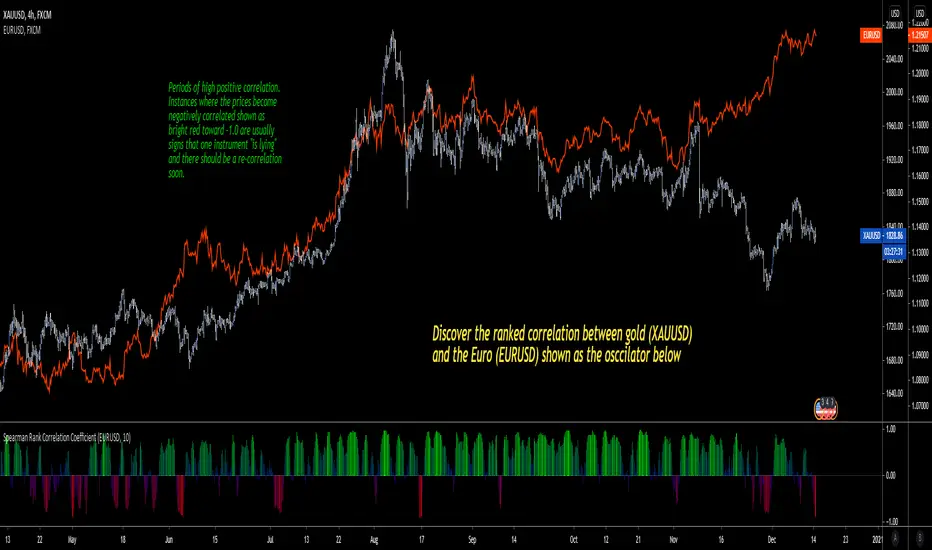
Named after Charles Spearman and denoted by the Greek letter ‘ ρ ’ (rho), the Spearman rank correlation coefficient is the nonparametric version of the Pearson correlation coefficient . Use the Spearman rank correlation when you have two ranked variables, and you want to see whether the two variables covary. That is, as one variable increases/decreases, the other variable tends to increase/decrease respectively.
It is best used to discover if two variables (and in this first version of the indicator, two ticker symbols) increase and decrease together. There are advantages to using this version of correlation vs. the Pearson R.
Interpretation
The value oscillates between +1 and -1.
A value of +1 means the two variables are perfectly correlated, that is they are increasing and decreasing together in perfect harmony.
A value of -1 means the two variables exhibit a perfect negative correlation, that is they increase and decrease oppositely.
A value of zero means the two variables are not correlated at all (noise).
Correlations
Correlation MATRIX (Flexible version)Hey folks
A quick unrelated but interesting foreword
Hope you're all good and well and tanned
Me? I'm preparing the opening of my website where we're going to offer the Algorithm Builder Single Trend, Multiple Trends, Multi-Timeframe and plenty of others across many platforms (TradingView, FXCM, MT4, PRT). While others are at the beach and tanning (Yes I'm jealous, so what !?!), we're working our a** off to deliver an amazing looking website and great indicators and strategies for you guys.
Today I worked in including the Trade Manager Pro version and the Risk/Reward Pro version into all our Algorithm Builders. Here's a teaser
We're going to have a few indicators/strategies packages and subscriptions will open very soon.
The website should open in a few weeks and we still have loads to do ... (#no #summer #holidays #for #dave)
I see every message asking me to allow access to my Algorithm Builders but with the website opening shortly, it will be better for me to manage the trials from there - otherwise, it's duplicated and I can't follow all those requests
As you can probably all understand, it becomes very challenging to publish once a day with all that workload so I'll probably slow down (just a bit) and maybe posting once every 2/3 days until the website will be over (please forgive me for failing you). But once it will open, the daily publishing will resume again :) (here's when you're supposed to be clapping guys....)
While I'm so honored by all the likes, private messages and comments encouraging me, you have to realize that a script always takes me about 2/3 hours of work (with research, coding, debugging) but I'm doing it because I like it. Only pushing the brake a bit because of other constraints
INDICATOR OF THE DAY
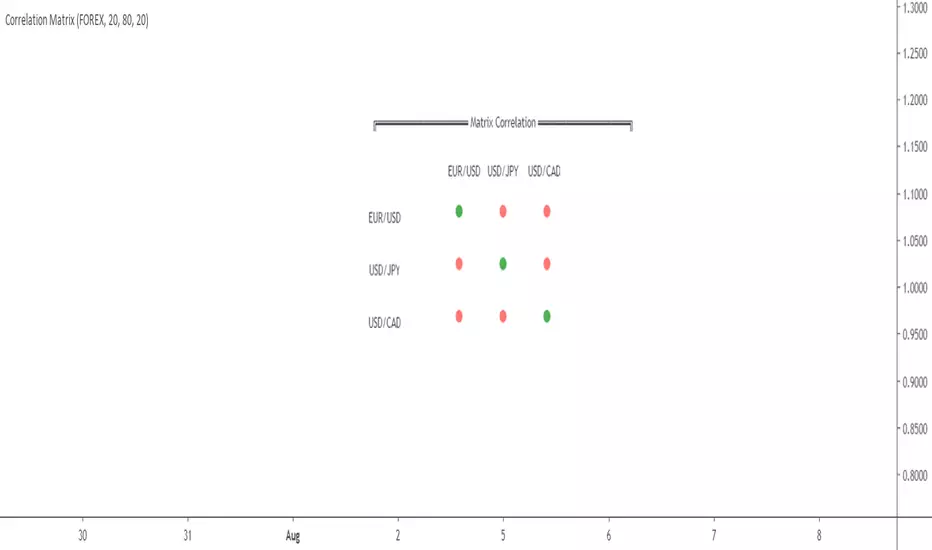
I made a more flexible version of my Correlation Matrix .
You can now select the symbols you want and the matrix will update automatically !!! Let me repeat it once more because this is very cool... You can now select the symbols you want and the matrix will update automatically :)
Actually, I have nothing more to say about it... that's all :) Ah yes, I added a condition to detect negative correlation and they're being flagged with a black dot
Definition : Negative correlation or inverse correlation is a relationship between two variables whereby they move in opposite directions.
A negative correlation is a key concept in portfolio construction, as it enables the creation of diversified portfolios that can better withstand portfolio volatility and smooth out returns.
Correlation between two variables can vary widely over time. Stocks and bonds generally have a negative correlation, but in the decade to 2018, their correlation has ranged from -0.8 to 0.2. (Source : www.investopedia.com
See you maybe tomorrow or in a few days for another script/idea.
Be sure to hit the thumbs up to cheer me up as your likes will be the only sunlight I'll get for the next weeks.... because working on building a great offer for you guys.
Dave
____________________________________________________________
- I'm an officially approved PineEditor/LUA/MT4 approved mentor on codementor. You can request a coaching with me if you want and I'll teach you how to build kick-ass indicators and strategies
Jump on a 1 to 1 coaching with me
- You can also hire for a custom dev of your indicator/strategy/bot/chrome extension/python

Correlation Matrix by DaveattHi everyone
A co-pinescripter friend told me this was impossible to do and we bet a free dinner tomorrow. Guess who's going to be invited to a very fancy restaurant tomorrow :) :) :) (hint: not him)
What's the today script is about?
This script is based on this MT4 correlation matrix
Asset correlation is a measure of how investments move in relation to one another and when. ... Under what is known as modern portfolio theory, you can reduce the overall risk in an investment portfolio and even boost your overall returns by investing in asset combinations that are not correlated.
I did it because it wasn't existing before with this format. What I discovered was only correlations shown as plot lines... #this #is #not #pretty
How does it work?
The correlation matrix will not be based on the current asset of the chart BUT will be based on the current timeframe (confusing? if yes, read it again until you'll get it)
- Numbers of bars back: numbers of bars used for the correlation calculation
- High correlation level: Correlation upper threshold. If above, then the correlation will be green
- Low correlation level: Correlation lower threshold. If below, then the correlation will be red
If the correlation is between the high and low levels, then it will be displayed in orange
- FOREX/INDEX: You can choose between displaying the correlation matrix between 3 FOREX or 3 INDEX assets
Also...
So far the scale doesn't respond too well to the matrix so you'll have to adapt the scale manually. I'll publish a V2 if I'll find a way to solve this issue from the code directly #new #challenge
A quick final note on why I'm sharing so much?
It challenges me to think out of the norm, get out of my bubble and explore areas of Pinescript that I still don't know. This "a script a day" challenge allows me to speed up my learning curve on Pinescript by a billion factor (and I get a few interesting gigs as well)
Let's bring this indicator to 100 LIKES guys !!!!! I think it deserves it, don't you think? :)
PS
Before all copy/pasters will add a version with crypto tomorrow, don't bother, I already did it and will post it in a few minutes for FREE :p
____________________________________________________________
Be sure to hit the thumbs up as it shows me that I'm not doing this for nothing and will motivate to deliver more quality content in the future.
- I'm an officially approved PineEditor/LUA/MT4 approved mentor on codementor. You can request a coaching with me if you want and I'll teach you how to build kick-ass indicators and strategies
Jump on a 1 to 1 coaching with me
- You can also hire for a custom dev of your indicator/strategy/bot/chrome extension/python
Asset Correlation Tool v3, improvedI found this useful tool among the indicators but it wasn't doing the correlation study correctly.
Everything in markets, with only a few exceptions, are rising in value over time and therefore trended to time. The simplest method I found is to use link relative or first difference detrending, before calculating a correlation between assets.
I also updated it to include more assets, to use the latest Cryptocap indices like BTC.D/ETH.D/TOTAL2 and the top 100 crypto index CIX100. I improved the colour schemes, too
Included in the source code are some other ideas like the FRED:M1 and FRED:M2 (only on daily charts), the Yuan/Yen/EUR/USD, etc. There's lots of scope for correlating unrelated markets.
I'll keep updating it as I use it to find truly correlated assets. Some kind of signal line of known correlations, to subtract from the baseline fuzz of market activity.
Any improvements are most welcome; I'm a novice at best at statistics and build on others' work.
- mabonyi
