• 產品
  • 社群
  • 市場
  • 經紀商
  • 更多
立即開始
  • 社群
  • /指標和策略
  • /Corssover

Corssover

Roc & Atr Roc & Atr Orders 
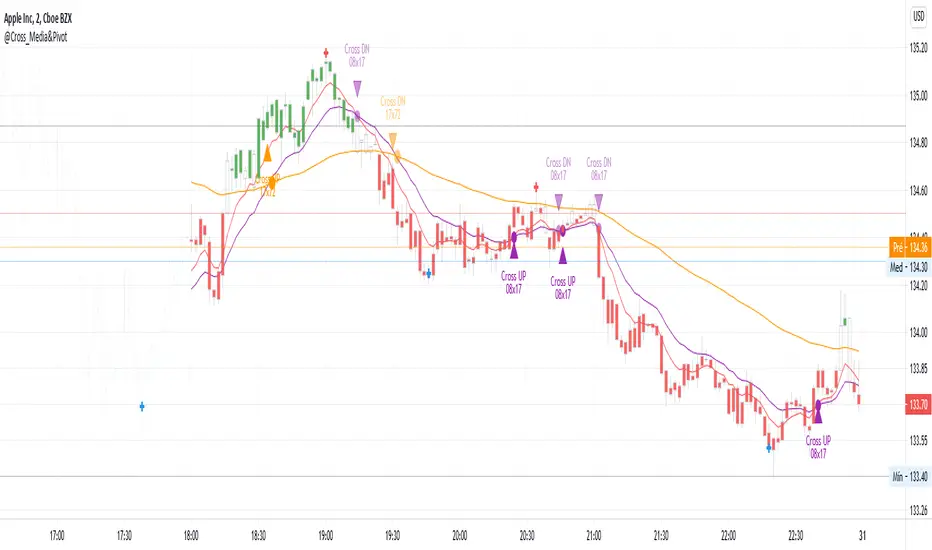
My indicator, where I compare the 20 bar change percentage with the 14 bar atr band, I hope it will be useful to everyone. the green zones can be interpreted as BUY and the red zone as SELL zone. In graphs with high motion and low atr, the channel narrowing can be interpreted as BUY and the channel opening as SELL. No indicator shows you the right way ... The best way is your own thoughts
Pine Script®指標
由dadashkadir提供
@Cross_Media&Pivot&TRADE_Entry_and_ExitThis script uses the functions plot(), cross(), plotcandle(), pivothigh() and pivotllow(). You can see the candles in the color green, above EMA 72 (Exponetional Move Average), and the color red, below EMA72. You can identify the position of the crossing UP and DOWN of the EMA 08 x EMA 17, EMA 17 x EMA72. You can identify the TRADE ENTRY points with the pivot high and TRADE EXIT with the pivot Low.
Pine Script®指標
由DalmarSantos提供
33

選擇由ICE Data提供的市場數據。選擇由FactSet提供的參考數據。版權所有©2025FactSet Research Systems Inc.©2025TradingView, Inc.

不僅是產品
  • 超級圖表
篩選器
  • 股票
  • ETF
  • 債券
  • 加密貨幣
  • 加密貨幣對
  • CEX對
  • DEX對
  • Pine
熱圖
  • 股票
  • ETF
  • 加密貨幣
日曆
  • 經濟
  • 收益
  • 股息
更多產品
  • 殖利率曲線
  • 期權
  • 新聞流
  • Pine Script®
App
  • 行動裝置
  • 電腦版
社群
  • 社交網路
  • 愛心牆
  • 推薦朋友
  • 網站規則
  • 版主
投資想法
  • 交易
  • 教育
  • 編輯精選
Pine腳本
  • 指標與策略
  • 大師
  • 自由開發人員
工具與訂閱
  • 功能特色
  • 價格
  • 市場數據
交易
  • 概要
  • 經紀商
特別優惠
  • CME期貨
  • Eurex期貨
  • 美國股票包
關於公司
  • 我們是誰
  • 宣言
  • 運動員
  • 部落格
  • 職涯
  • 媒體工具包
商品
  • TradingView商店
  • 交易者塔羅牌
  • C63 TradeTime
政策與安全
  • 使用條款
  • 免責聲明
  • 隱私政策
  • Cookies政策
  • 無障礙聲明
  • 安全漏洞
  • 狀態頁面
企業解決方案
  • 小工具
  • 圖表庫
  • Lightweight Charts™
  • 高級圖表
  • 交易平台
成長機會
  • 廣告
  • 經紀商整合
  • 夥伴計畫
  • 教育計劃
社群
  • 社交網路
  • 愛心牆
  • 推薦朋友
  • 網站規則
  • 版主
投資想法
  • 交易
  • 教育
  • 編輯精選
Pine腳本
  • 指標與策略
  • 大師
  • 自由開發人員
企業解決方案
  • 小工具
  • 圖表庫
  • Lightweight Charts™
  • 高級圖表
  • 交易平台
成長機會
  • 廣告
  • 經紀商整合
  • 夥伴計畫
  • 教育計劃
Look FirstLook First