ahax – CRT V0 ahax – CRT V0 is an enhanced CRT indicator that works on candlestick formations and generates BUY/SELL signals when certain conditions are met.
In this version, the classic CRT logic has been supplemented with additional controls for more stable operation, with a particular focus on reducing unnecessary signals. Each signal is generated based on the middle candlestick, and confirmation signals (+/-) can be displayed, if desired, based on the close of the next candle.
The indicator works based on the relationship between the left candlestick, the middle candlestick, and the right candlestick. It provides quick visual feedback on points such as trend reversals, potential manipulation, or reaction zones.
It is designed to be simple, clear, and clean, allowing you to adapt it to your own strategy.
It does not include any risk management or trading recommendations.
CRT

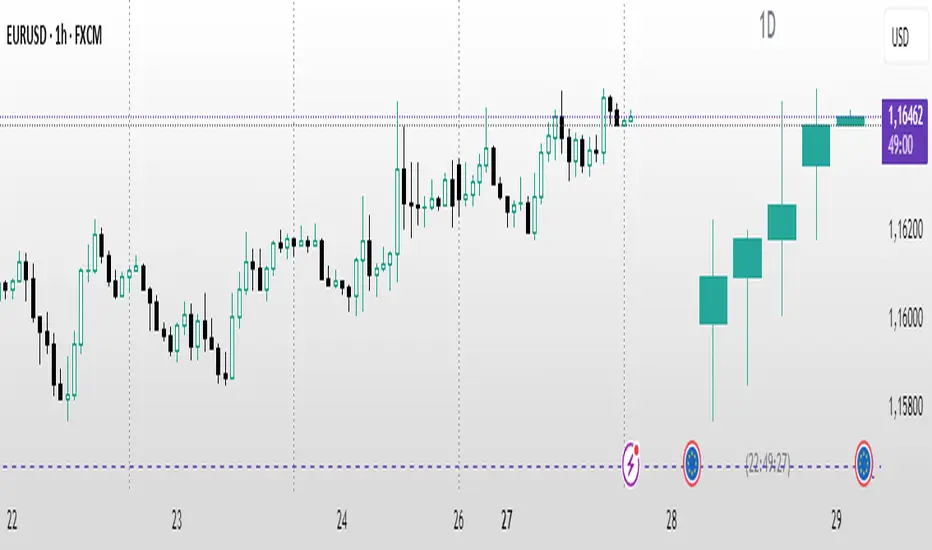
(CRT) MTF Candle Range Theory Model# 🚀 **CASH Pro MTF – Candle Range Theory (CRT) Indicator**
**The Smart Money ICT Setup Detector** 🔥
Hey Traders!
Here is the **ultimate Pine Script indicator** that automatically detects one of the most powerful Smart Money / ICT setups: **Candle Range Theory (CRT)**
---
### What is Candle Range Theory – CRT?
**CRT** is a high-probability price action model based on **liquidity grabs** and **range expansion**.
Price loves to:
1️⃣ Raid the low/high of the previous candle (take stop-losses)
2️⃣ Then reverse and run to the opposite side of the range (or beyond)
When this happens near a **key higher-timeframe level**, magic happens!
### Bullish CRT Model
- Price touches a **strong HTF support**
- Previous candle closes near that support
- Next candle **sweeps the low** (grabs liquidity)
- Current candle **closes above the raided low AND breaks the high** of the sweep candle
**Result → Aggressive bullish move expected!**
**Entry:** On close above the high (or on retest + MSS)
**Stop Loss:** Below the swept low
**Take Profit:** CRT High or next liquidity pool
### Bearish CRT Model
- Price touches a **strong HTF resistance**
- Previous candle closes near resistance
- Next candle **sweeps the high** (grabs buy stops)
- Current candle **closes below the raided high AND breaks the low** of the sweep candle
**Result → Strong bearish expansion!**
**Entry:** On close below the low
**Stop Loss:** Above the swept high
**Take Profit:** CRT Low or next downside liquidity
This whole setup can form in **just 3 candles**… or sometimes more if price consolidates after the sweep.
---
### Why This Indicator is Special
This is **NOT** a simple 3-candle pattern scanner!
This is a **true CRT + MTF confluence beast** with:
- **Multi-Timeframe Confirmation** (default 4H – fully customizable)
- **Built-in RSI Filter** (avoid fake moves in overbought/oversold)
- **Day-2 High/Low Levels** automatically drawn (the exact CRT range!)
- **Clean “LONG” / “SHORT” labels** right on the candle (no ugly arrows or offset)
- **Background highlight** on signal
- **Fully grouped inputs** – super clean settings panel
---
### Features at a Glance
| Feature | Included |
|--------------------------------|----------|
| Higher Timeframe Confirmation | Yes |
| RSI Overbought/Oversold Filter | Yes |
| Day-2 High/Low Lines + Labels | Yes |
| Clean Text Signals (no offset) | Yes |
| Background Highlight | Yes |
| Fully Customizable Colors & Text| Yes |
| Works on All Markets & TFs | Yes |
---
### How to Use
1. Add the indicator to your chart
2. Wait for a **LONG** or **SHORT** label to appear
3. Confirm price is near a **key HTF level** (order block, FVG, etc.)
4. Enter on close or retest (your choice)
5. Manage risk with the drawn Day-2 levels
**Pro Tip:** Combine with ICT Market Structure Shift (MSS) or Fair Value Gaps for even higher accuracy!

LockedEye MTF CRT Map SentinelOverview
This script provides a structured multi-timeframe display of market conditions.
It summarizes key elements from M1 up to D1 using five components:
- CRT (Continuation/Reversal Trigger)
- MA6 micro-trend filter
- Candle-close direction
- MA250 macro trend filter
- Sentiment percentage computed from the above signals
The panel is designed to present information at a glance, allowing traders to understand how different timeframes align or disagree.
The purpose is not to merge random indicators. Each row uses a specific rule-based calculation that contributes to an integrated multi-timeframe read. The focus is on market structure, micro-trend, and directional pressure as expressed across several intervals.
How the Script Works
The script does not rely on external indicators. All calculations are performed internally through candle relationships, moving averages, MTF requests, and simple classification logic.
1. CRT Logic (Continuation and Reversal)
CRT identifies two types of behavior in each timeframe:
Continuation: The current candle closes outside the previous candle’s high or low.
Reversal after a sweep: Price takes the previous high or low but closes back inside the range.
A close outside the previous range suggests continuation.
A sweep followed by a close back inside suggests a shift in pressure or reversal .
The CRT row labels these conditions as Bull, Bear, or Wait.
2. MA6 Micro-Trend
The script uses a 6-period simple moving average to understand immediate trend pressure.
Close and open both above the MA6 = Bull
Close and open both below the MA6 = Bear
Mixed = Wait
This gives a quick view of short-term momentum without repainting.
3. Candle-Close Direction
This uses a simple comparison:
Close > Open = Bull
Close < Open = Bear
Equal = Neutral
It is a raw directional signal without interpretation.
4. MA250 Macro Filter
The script applies a 250-period MA to understand the broader trend.
Break above the MA250 = BR (BullRun)
Break below the MA250 = BC(BearCrash)
Inside range = Neutral
This acts as a long-term directional filter .
5. Sentiment Computation
The script aggregates CRT, MA6, and Candle-Close across all timeframes.
Each timeframe contributes a value.
The script then calculates the percentage of bull, bear, and neutral signals.
A short text summary explains whether signals are aligned or mixed.
How to Use the Panel
Multi-Timeframe Alignment
The panel is most useful when interpreting how lower and higher timeframes behave together:
When many timeframes show the same direction, it reflects stronger alignment.
When timeframes disagree, market conditions are more mixed or range-bound.
Users can watch for shifts when multiple rows turn from mixed to aligned.
Trend-Following Context
If higher timeframes (H2–D1) show consistent directional readings in CRT, MA6, and MA250, users may treat that as broader structural context.
Lower timeframes (M1–M15) can then be used to observe pullbacks or shifts within that larger trend.
Counter-Trend Context
If higher timeframes show one direction but lower timeframes show the opposite, this may indicate short-term reactions or pullbacks.
The script does not assume these reactions will continue; it only shows the multi-frame condition so users can decide how to interpret it.
Liquidity Sweep Context
CRT will classify moments when price takes a previous high or low and re-enters the range.
This is included so users can detect areas where the market moves beyond a level and immediately rejects it.
Alerts
The script includes alert conditions for:
CRT Bull or Bear flips on the chart’s timeframe
Multi-timeframe consensus reaching a user-defined threshold
Users can create alerts through the TradingView alert menu once the indicator is added to the chart.
Note:
The script includes a non-repaint mode for alert stability. This mode ensures only confirmed candle closes are used in calculations.
Chart Use
The script displays a fixed panel on the chart.
Users may select the panel’s position to avoid covering price action.
Users are advised to publish with a clean chart where only this script is active, unless pairing is required for explanation.
Toggles:
Close Candle(Non Repaint)
Monitor: BTCUSD along w RSI
Monitor 2: Any Coin
Flip M1-D1
Fast CRT
Final Notes
This script does not forecast future price movement and does not claim accuracy, profitability, or performance results.
It is a diagnostic tool that organizes real-time price behavior across multiple timeframes.
Users should apply their own judgment and risk management.

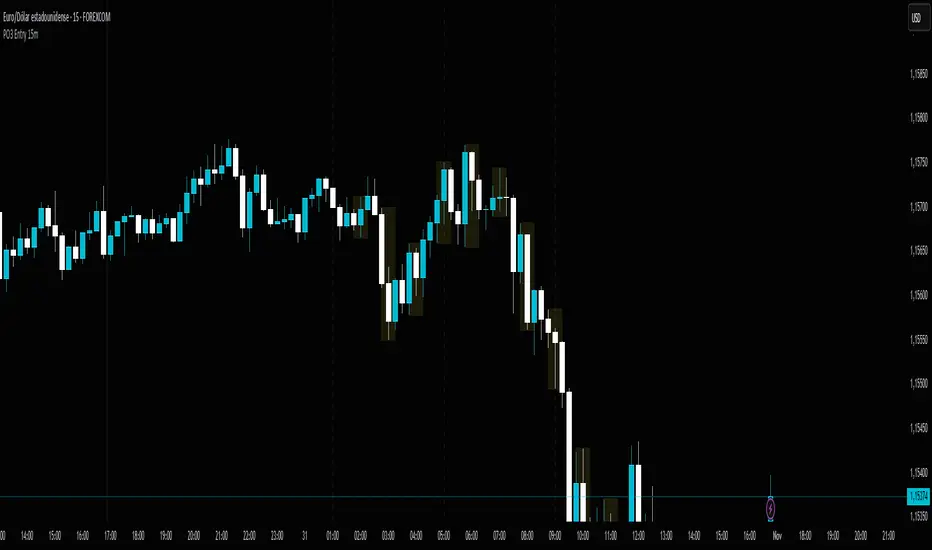
PO3 Entry 15m + Time Lines - Range Logic TradingPO3 Entry 15m + Time Lines - Professional Indicator for NY Sessions
🎯 DESCRIPTION:
Advanced indicator designed for traders operating in New York sessions. Combines customizable trading zones with key time lines for perfect visual management of your strategy.
🌟 KEY FEATURES:
🕒 STRATEGIC TIME LINES
Vertical lines at key times: 1:00 AM, 5:00 AM, and 9:00 AM (NY Time)
Perfect for identifying 4H candle openings and session changes
Configurable colors and styles (solid, dashed, dotted)
Visible only for the last 5 days to keep charts clean
📊 10 CUSTOMIZABLE TRADING ZONES
10 fully configurable zones with specific time ranges
Each zone displays an expanding box during its active period
Automatic High/Low tracking during zone duration
Informative labels with customizable names
Individual colors and styles for each zone
⚙️ COMPLETE CONFIGURATION:
Time Zone: America/New_York, UTC, Europe/London, Asia/Tokyo
Days to Show: 1-30 days (5 by default)
Individual activation for each zone and time lines
Customizable colors for every element
Line Styles: Solid, Dashed, Dotted
🎨 PROFESSIONAL VISUALIZATION:
Semi-transparent boxes that don't obstruct price action
Extendable lines from top to bottom of chart
Automatic daily reset to prevent accumulation
500 box limit for optimal performance
📈 IDEAL FOR:
NY Session traders (1:00 AM - 12:00 PM EST)
Time-based trading strategies
Visual identification of interest zones
Session management and planning
🛠️ RECOMMENDED USE:
Configure the 10 zones with your trading hours
Activate time lines for visual reference
Adjust colors according to your preference
Set days to display based on your strategy
Optimize your trading with this all-in-one indicator that combines time precision with flexible custom trading zones!
CRT Full Checklist - Range Logic Trading📊 Professional Trading Dashboard for Range-Based Trading
A comprehensive, multi-column checklist designed for systematic traders who specialize in range trading across multiple currency pairs and instruments. This visual dashboard provides an organized workflow for the Range Logic Trading methodology.
🎯 KEY FEATURES
🔄 Multi-Instrument Range Monitoring
6 customizable columns for different instruments (EUR/USD, GBP/USD, USD/CAD, XAU/USD OA, XAU/USD FX, DXY)
Individual activation/deactivation for each column
Customizable instrument names and colors
📈 Range Trading Decision Framework
R Activa - Active range assessment (SI/NO/N/A)
Direction - Range breakout direction with color-coded options (Alcista/Bajista/Ambas)
Es para Obvio - Clear range setup qualification (SI/NO/N/A)
Rango Operativo - Operational timeframes for range analysis (2-1H to 11-2h)
FS 4H> - 4-hour frame structure within ranges (EUR/GBP/DXY)
⚡ Range Trading Entry System
Buscamos - Dual dropdown system for range levels (High/Low of 1H-4H, Direct Entry)
Objetivo - Range-based targets (Range/High 4H)
Entrada - Multiple range entry conditions (TS R Activa, TS 1H/4H RO)
🚨 Range Trading Risk Management
Red Flag System - Three range-specific warning flags:
Alto/Bajo Correlacionado
Alto/Bajo 4H Inhabilita
R/A Invalidado
🎨 CUSTOMIZATION
Fully customizable colors for all range levels and conditions
Adjustable text sizes (Tiny to Large)
Individual column colors for quick range identification
Professional color coding for range breakouts and rejections
💡 PRACTICAL BENEFITS
Streamlined range trading workflow across multiple instruments
Visual range assessment with color-coded levels
Systematic approach to range identification and breakout trading
Time-saving dashboard for range-bound market conditions
Customizable reminder section with range trading principles
🎯 PERFECT FOR
Range-bound market specialists
Multi-instrument range traders
Systematic breakout traders
Risk-conscious range traders
Traders using Range Logic Trading methodology
Master range trading across multiple instruments with this professional CRT dashboard designed specifically for Range Logic Trading systems!
Note: This indicator is for educational purposes and should be used as part of a comprehensive trading plan. Always practice proper risk management in range trading.

Custom Time Separators + Hourly Open LinesThis Indicator is for those who wants to keep the chart clean and Study 1HR Profile.
best USE is : 1HR line Projected and 1 HR separator is plotted on the chart
i Use 4 Hrs. plotted and using for CRT Method to identify
SWEEP of C1 by C2 and, Entering ON C2 when its Trading back up,
or on your comfort of confirmation with MSS + FVG / OB
Lot of ICT Model can be traded and used with this including
PO3
Lumi trades : 1HR PO3
Ttrades CRT and Many more,
let me know if want to add anything if i think its useful we can add.
cheers

Auto HTF Candles [@gaucho_trader][Auto HTF Candles
(Title)
Tired of constantly switching between timeframes? 🔄 This indicator solves that problem by bringing Higher Timeframe (HTF) context directly onto your current chart.
Auto HTF Candles plots up to three different sets of HTF candles in a clean, non-intrusive panel on the right side of your screen. Now you can watch a 4H candle develop while analyzing price action on a 5-minute chart, all in one view.
Core Concept 🎯
The principle is simple: your lower timeframe (LTF) trading decisions become significantly more powerful when aligned with the HTF trend and structure. By displaying the live HTF candles, you can instantly see if the current LTF move is a weak pullback against a strong HTF candle or a powerful breakout from an HTF consolidation. This indicator provides that essential macro context without ever leaving your main chart.
Key Features 📊
📈 Display Multiple Timeframes: Plot up to three fully independent higher timeframes simultaneously (e.g., 15m, 1H, and 4H).
🤖 Automatic HTF Selection: Enable the "Auto-Adjust HTF 1" feature, and the script will intelligently select a logical higher timeframe for you based on your current chart.
⏳ Real-Time Countdown Timer: Each timeframe displayed includes a timer showing the exact time remaining until the current HTF candle closes. This is crucial for anticipating end-of-candle volatility.
🎨 Fully Customizable Appearance: You have complete control over the visual style. Adjust colors, candle width, spacing, and the padding from the live price.
✨ Clean & Organized Layout: The candles are neatly arranged to the right of the current price, ensuring your main chart remains clear and unobstructed.
How to Use It 💡
Context is King: Use the HTF candles to define your bias. If the 4H candle is strongly bullish, you can look for more confident long entries on your 5m chart.
Identify Key Levels in Real-Time: Watch the highs and lows of the HTF candles as they form. These levels often act as powerful intraday support and resistance.
Anticipate Reversals: Is the 1H candle approaching its close and printing a long upper wick? This could signal a potential reversal, giving you a heads-up before the pattern is obvious on the LTF.
Streamline Your Workflow: Use the "Auto-Adjust" feature for a dynamic analysis setup. As you switch between different charts, your most relevant HTF context will follow you automatically.
Main Settings ⚙️
HTF 1, 2, 3: Enable and select up to three custom timeframes and set how many recent candles you want to display for each.
Auto-Adjust HTF 1: The star of the show. Toggle this on to let the script automatically select the first HTF based on your chart's period.
Styling: A comprehensive section to modify all colors, candle width, and the spacing between candles and timeframes.
Label Settings: Independently control the visibility, color, and size of the HTF name labels and the countdown timers.
⚠️ Disclaimer
This indicator is a tool for market analysis and should not be considered financial advice. Trading involves significant risk. Always perform your own due diligence before making any trading decisions.
Automatic Higher Timeframe Dividers [@gaucho_trader]🧭 Overview
The HTF Separators (auto) indicator automatically draws vertical lines marking the start of each candle belonging to a higher–timeframe (HTF).
This allows you to visually identify the boundaries of higher–timeframe candles within your current chart — an essential concept for multi–timeframe (MTF) analysis.
For example:
On a 15-minute chart, each line marks the start of a new 4-hour candle.
On a 1-hour chart, the lines show where each daily candle begins.
On a daily chart, they highlight the start of each month.
These vertical separators help you recognize moments when price often reacts or shifts, since the open of a new higher-timeframe candle frequently aligns with impulses, reversals, or structural changes.
⚙️ Main Features
✅ Automatic timeframe mapping:
1m → 15m
3m → 30m
5m → 1H
15m → 4H
1H → 1D
4H → 1W
1D → 1M
✅ Full customization:
Line color
Line width
Style (solid, dashed, or dotted)
✅ Optional HTF label:
Display a small label showing the detected higher timeframe (e.g. “HTF: 4H”).
🧩 How to use
Add the indicator to your chart.
Adjust the color, width, and style to your preference.
(Optional) Enable the label to display the current HTF being tracked.
Watch how vertical lines automatically appear whenever a new higher-timeframe candle starts.
This helps you align your trades and analysis with higher-timeframe structure, giving you a clearer understanding of market cycles and timing.
💡 Practical Example
If you trade on a 15-minute chart, each separator line represents the start of a 4-hour candle.
Use it to:
Understand the context of your current candle within the larger trend.
Spot key reaction points at HTF opens.
Time entries and exits around HTF shifts.
🧠 Best for
Traders using multi-timeframe analysis (MTF)
Intraday and swing traders seeking better HTF alignment
Anyone wanting a cleaner and more structured chart view
📈 Automatic Higher Timeframe Dividers is a lightweight, practical tool that brings clarity and temporal precision to your technical analysis — helping you instantly see where each major candle begins on your chart.

Equinox Wolf - ICT MacrosEquinox Wolf – ICT Macros plots the key ICT session macro windows on your chart so you can focus on how price behaves inside each time range. The script anchors every session to America/New_York time, updates live or in backtesting, and only keeps the current trading day on screen, avoiding clutter from prior sessions. Each window can be toggled individually, the box fill, borders, and high/low/equilibrium levels share global color and style controls, and the levels extend forward until the next macro begins. Use it to highlight the ICT LND, NYAM, lunch, afternoon, and final-hour ranges and monitor how price reacts around their highs, lows, and midpoints.

Smart CRT Indicator📌 Smart CRT Indicator – Spot Trend Reversals and Continuations with Precision
The Smart CRT Indicator is a versatile price action tool that identifies Candle Range Trap (CRT) patterns—powerful setups that often precede either trend reversals or breakout continuations.
It detects and visualizes market conditions where price gets "trapped" within a prior range or breaks out deceptively, giving traders early insight into potential directional moves.
🔍 Key Features:
✅ Bullish & Bearish CRT Signals
Accurately spots both reversal and continuation setups using CRT logic across three core patterns.
✅ Flexible Range Close Filter
Customize how deeply the second candle closes within the first candle's range to fine-tune signal quality.
✅ Trend Filter (Optional)
Choose whether to only show signals aligned with the dominant trend, using a customizable SMA filter.
✅ Visual Range Mapping
Automatically draws range lines to mark key price zones for CRT patterns. Adjustable style, color, and width.
✅ Real-Time Alerts
Get notified instantly when a new CRT pattern appears on your chart.
🧠 CRT Pattern Types Detected:
Inside Bar CRT: A compression pattern inside a larger range that signals potential breakout or reversal.
Multi-Candle CRT: A group of smaller candles shrinking inside an anchor candle—often a sign of building momentum.
Purge CRT: A deceptive breakout beyond the previous candle’s range, followed by an immediate reversal.
⚙️ Best For:
Traders seeking trend continuation breakout setups
Traders looking to fade false moves or catch reversals
Price action traders who rely on candle structure and traps
Swing, intraday, or even scalping strategies
🧩 Tip:
Combine CRT signals with Key Levels, FVG, support/resistance or order block zones for high-probability confluence entries.


Candle Multi-TimeFrame CountCandle Multi-TimeFrame Count is an advanced TradingView indicator that displays real-time countdowns to candle closes across multiple timeframes, along with intelligent multi-close alerts. Perfect for traders who operate across different timeframes and need to efficiently manage their entries and exits.
⚡ Key Features
🕐 Multi-Timeframe Countdown
10 configurable timeframes: From 1 minute to 1 week
Real-time tracking: Precise countdown in HH:MM:SS format
Visual alerts: Color changes when less than 30 seconds remaining (short timeframes) or 1 hour (long timeframes)
🌍 Timezone Selector
Adjustable UTC offset: Manually configure your timezone
Pre-configured settings: NY (-5/-4), Chicago (-6/-5), London (0), Spain (+1/+2)
Manual mode: Set any hour for testing and simulation
🔔 Multi-Close Alerts
Smart prediction: Detects which timeframes will close in the next hour
Specific schedules: Based on actual closing times for each timeframe:
✅ 1H: Every hour on the hour
✅ 2H: Odd hours (01:00, 03:00, 05:00...)
✅ 3H: 02:00, 05:00, 08:00, 11:00, 14:00, 17:00, 20:00, 23:00
✅ 4H: 01:00, 05:00, 09:00, 13:00, 17:00, 21:00
✅ 6H: 05:00, 11:00, 17:00, 23:00
✅ 8H: 01:00, 09:00, 17:00
✅ 12H: 05:00, 17:00
🎨 Complete Customization
Timeframe selector: Choose which to display (up to 10 simultaneously)
Visual customization: Adjust colors, transparency, and text size
Clean interface: Organized table that integrates seamlessly with your chart
🚀 Use Cases
📈 For Day Traders
Manage entries/exits across multiple timeframes
Anticipate important candle closes
Optimize trade timing
⏰ For Swing Traders
Monitor daily and weekly closes
Plan operations based on major candle closures
Identify key temporal convergence moments
🌐 For International Traders
Adapt the indicator to any timezone
Trade global markets with time precision
Maintain consistency regardless of your location
⚙️ Quick Setup
Select timeframes: Choose up to 10 timeframes to monitor
Adjust timezone: Configure UTC offset according to your location
Customize appearance: Modify colors and transparency
Enable alerts: Observe multiple closures in the next hour
💡 Key Benefits
Time savings: No more manual close calculations
Precision: Exact alerts for convergent closes
Flexibility: Adaptable to any trading style
Clear visualization: Critical information at a glance
📋 Technical Information
Language: Pine Script v6
Compatibility: All TradingView instruments
Performance: Optimized to not slow down your charts
🎯 Ideal for: Day traders, swing traders, scalpers, and any trader who needs to efficiently manage multiple timeframes.
🔮 Enhance your trading: Never miss an important close again with Candle Multi-TimeFrame Count!
Fractal Market Model [BLAZ]Version 1.0 – Published August 2025: Initial release
1. Overview & Purpose
1.1. What This Indicator Does
The Fractal Market Model is an original multi-timeframe technical analysis tool that bridges the critical gap between macro-level market structure and micro-level price execution. Designed to work across all financial markets including Forex, Stocks, Crypto, Futures, and Commodities. While traditional Smart Money Concepts indicators exist, this implementation analyses multi-timeframe liquidity zones and price action shifts, marking potential reversal points where Higher Timeframe (HTF) liquidity sweeps coincide with Low Timeframe (LTF) price action dynamics changes.
Snapshot details: NASDAQ:GOOG , 1W Timeframe, Year 2025
1.2. What Sets This Indicator Apart
The Fractal Market Model analyses multi-timeframe correlations between HTF structural events and LTF price action. This creates a dynamic framework that reveals patterns observed historically in price behaviour that are believed to reflect institutional activity across multiple time dimensions.
The indicator recognizes that markets move in fractal cycles following the AMDX pattern (Accumulation, Manipulation, Distribution, Continuation/Reversal). By tracking this pattern across timeframes, it flags zones where price action dynamics characteristics have historically shown shifts. In the LTF, the indicator monitors for price closing through the open of an opposing candle near HTF swing highs or lows, marking this as a Change in State of Delivery (CISD), a threshold event where price action historically transitions direction.
Practical Value:
Multi-Timeframe Integration: Connects HTF structural events with LTF execution patterns.
Fractal Pattern Recognition: Identifies AMDX cycles across different time dimensions.
Price Behavior Analysis: Tracks CISD patterns that may reflect historical shifts in order flow commonly associated with institutional activity.
Range-Based Context: Analyses price action within established HTF liquidity zones.
1.3. How It Works
The indicator employs a systematic 5-candle HTF tracking methodology:
Candles 0-1: Accumulation phase identification.
Candle 2: Manipulation detection (raids previous highs/lows).
Candle 3: Distribution phase recognition.
Candle 4: Continuation/reversal toward opposite liquidity.
The system monitors for CISD patterns on the LTF when HTF manipulation candles close with confirmed sweeps, highlighting zones where order flow dynamics historically shifted within the established HTF range.
Snapshot details: FOREXCOM:AUDUSD , 1H Timeframe, 17 to 28 July 2025
Note: The Candle 0-5 and AMDX labels shown in the accompanying image are for demonstration purposes only and are not part of the indicator’s actual functionality.
2. Visual Elements & Components
2.1. Complete FMM Setup Overview
A fully developed Fractal Market Model setup displays multiple analytical components that work together to provide comprehensive market structure analysis. Each visual element serves a specific purpose in identifying and tracking the AMDX cycle across timeframes.
2.2. Core Visual Components
Snapshot details: FOREXCOM:EURUSD , 5 Minutes Timeframe, 27 May 2025.
Note: The numbering labels 1 to 14 shown in the accompanying image are for demonstration purposes only and are not part of the indicator’s actual functionality.
2.2.1. HTF Structure Elements
(1) HTF Candle Visualization: Displays the 5-candle sequence being tracked (configurable quantity up to 10).
(2) HTF Candle Labels (C2-C4): Numbered identification for each candle in the AMDX cycle.
(3) HTF Resolution Label: Shows the higher timeframe being analysed.
(4) Time Remaining Indicator: Countdown to HTF candle closure.
(5) Vertical Separation Lines: Clearly delineates each HTF candle period.
2.2.2. Key Price Levels
(6) Liquidity Levels: High/low levels from HTF candles 0 and 1 representing potential target zones.
(7) Sweep Detection Lines: Marks where previous HTF candle extremes have been breached on both HTF and LTF.
(8) HTF Candle Mid-Levels: 50% retracement levels of previous HTF candles displayed on current timeframe.
(9) Open Level Marker: Shows the opening price of the most recent HTF candle.
2.2.3. Institutional Analysis Tools
(10) CISD Line: Marks the Change in State of Delivery pattern identification point.
(11) Consequent Encroachment (CE): Mid-level of identified institutional order blocks.
(12) Potential Reversal Area (PRA): Zone extending from previous candle close to the mid-level.
(13) Fair Value Gap (FVG): Identifies imbalance areas requiring potential price revisits.
(14) HTF Time Labels: Individual time period labels for each HTF candle.
2.3. Interactive Features
All visual elements update dynamically as new price data confirms or invalidates the tracked patterns, providing real-time market structure analysis across the selected timeframe combination.
3. Input Parameters and Settings
3.1. Alert Configuration
Setup Notifications: Users can configure alerts to receive notifications when new FMM setups form based on their selected bias, timeframes, and filters. Enable this feature by:
Configure the bias, timeframes and filters and other settings as desired.
Toggle the "Alerts?" checkbox to ON in indicator settings.
On the chart, click the three dots menu beside the indicator's name or press Alt + A.
Select "Add Alert" and click “Create” to activate the alert.
3.2. Display Control Settings
3.2.1. Historical Setup Quantity
Setup Display Control: Customize how many historical setups appear on the chart, with support for up to 50 combined entries. The indicator displays both bullish and bearish FMM setups within the selected limit, including invalidated scenarios. For example, selecting "3 setups" will display the most recent combination of bullish and bearish patterns based on the model's detection logic.
Snapshot details: BINANCE:BTCUSD , 1H Timeframe, 27-Feb to 11-Mar 2025
Note: The labels “Setup 1, 2 & 3: Bullish or Bearish” shown in the accompanying image are for demonstration purposes only and are not part of the indicator’s actual functionality.
3.2.2. Directional Bias Filter
Bias Filter: Control which setups are displayed based on directional preference:
Bullish Only: Shows exclusively upward bias setups.
Bearish Only: Shows exclusively downward bias setups.
Balanced Mode: Displays both directional setups.
This flexibility helps align the indicator's output with broader market analysis or trading framework preferences. The chart below illustrates the same chart in 3.2.1. but when filtered to show only bullish setups.
Snapshot details: BINANCE:BTCUSD , 1H Timeframe, 27-Feb to 11-Mar 2025
Note: The labels “Setup 1, 2 & 3: Bullish” shown in the accompanying image are for demonstration purposes only and are not part of the indicator’s actual functionality.
3.2.3. Invalidated Setup Display
Invalidation Visibility: A setup becomes invalidated when price moves beyond the extreme high or low of the Manipulation candle (C2), indicating that the expected fractal pattern has been disrupted. Choose whether to display or hide setups that have been invalidated by subsequent price action. This feature helps maintain chart clarity while preserving analytical context:
Amber Labels: Setups invalidated at Candle 3 (C3).
Red Labels: Setups invalidated at Candle 4 (C4).
Count Preservation: Invalidated setups remain part of the total setup count regardless of visibility setting.
Below image illustrates balanced setups:
Left side: 1 bearish valid setup, with 2 invalidated setups visible.
Right side: 1 bearish valid setup, with 2 invalidated setups hidden for chart clarity.
Snapshot details: FOREXCOM:GBPJPY , 5M Timeframe, 30 July 2025
3.3. Timeframe Configuration
3.3.1. Multi-Timeframe Alignment
Custom Timeframe Selection: Configure preferred combinations of Higher Timeframe (HTF) and Lower Timeframe (LTF) for setup generation. While the indicator includes optimized default alignments (1Y –1Q, 1Q –1M, 1M –1W, 1M –1D, 1W–4H, 1D–1H, 4H-30m, 4H –15m, 1H –5m, 30m –3m, 15m –1m), users can define custom HTF-LTF configurations to suit their analysis preferences and market focus.
The image below illustrates two different HTF – LTF configuration, both on the 5 minutes chart:
Right side: Automatic multi-timeframe alignment, where the indicator autonomously sets the HTF pairing to 1H when the current chart timeframe is the 5 minutes.
Left side: Custom Timeframe enabled, where HTF is manually set to 4H, and LTF is manually set to 15 minutes, while being on the 5 minutes chart.
Snapshot details: FOREXCOM:GBPJPY , 5 minutes timeframe, 30 July 2025
3.3.2. Session-Based Filtering
Visibility Filters: Control when FMM setups appear using multiple filtering options:
Time-Based Controls:
Show Below: Limit setup visibility to timeframes below the selected threshold.
Use Session Filter: Enable session-based time window restrictions.
Session 1, 2, 3: Configure up to three custom time sessions with start and end times.
These filtering capabilities help concentrate analysis on specific market periods or timeframe contexts.
The image below illustrates the application of session filters:
Left side: The session filter is disabled, resulting in four setups being displayed throughout the day—two during the London session and two during the New York session.
Right side: The session filter is enabled to display setups exclusively within the New York session (8:00 AM – 12:00 PM). Setups outside this time window are hidden. Since the total number of setups is limited to four, the indicator backfills by identifying and displaying two qualifying setups from earlier price action that occurred within the specified New York session window.
Snapshot details: COMEX:GC1! , 5 minutes Timeframe, 29 July 2025
3.4. Annotation Systems
3.4.1. Higher Timeframe (HTF) Annotations
HTF Display Control: Enable HTF visualization using the "HTF candles" checkbox with quantity selector (default: 5 candles, expandable to 10). This displays all HTF elements detailed in the Visual Components section 2.2. above.
Customisation Categories:
Dimensions: Adjust candle offset, gap spacing, and width for optimal chart fit.
Colours: Customize body, border, and wick colours for bullish/bearish candle differentiation.
Style Options: Control line styles for HTF opens, sweep lines, and equilibrium levels.
Feature Toggles: Enable/disable Fair Value Gaps, countdown labels, and individual candle labelling.
All HTF annotation elements support individual styling controls to maintain visual clarity while preserving analytical depth. The image below shows two examples: the left side has customized styling applied, while the right side shows the default appearance.
Snapshot details: CME_MINI:NQ1! , 5 minutes Timeframe, 29 July 2025
3.4.2. Lower Timeframe (LTF) Annotations
LTF Display Control: Comprehensive annotation system for detailed execution analysis, displaying all LTF elements outlined in the Visual Components section 2.2. above.
Customization Categories:
Core Elements: Control HTF separation lines, sweep markers, CISD levels, and candle phase toggles (C2, C3, C4) to selectively show or hide the LTF annotations for each of these specific HTF candle phases.
Reference Levels: Adjust previous equilibrium lines, CISD consequent encroachment, and HTF liquidity levels.
Analysis Tools: Enable potential holding area (PHA) markers.
Styling Options: Individual visibility toggles, colour schemes, line styles, and thickness controls for each element.
All LTF components support full customization to maintain chart clarity while providing precise execution context. The image below shows two examples: the left side has customized styling applied, while the right side shows the default appearance.
Snapshot details: TVC:DXY , 5 minutes Timeframe, 28 July 2025
3.5. Performance Considerations
Higher setup counts and extended HTF displays may impact chart loading times. Adjust settings based on device performance and analysis requirements.
4. Closed-Source Protection Justification
4.1. Why This Indicator Requires Protected Source Code
The Fractal Market Model is the result of original research, development, and practical application of advanced price action frameworks. The indicator leverages proprietary algorithmic systems designed to interpret complex market behavior across multiple timeframes. To preserve the integrity of these innovations and prevent unauthorized replication, the source code is protected.
4.1.1. Key Proprietary Innovations
Real-Time Multi-Timeframe Correlation Engine: A dynamic logic system that synchronizes higher timeframe structural behaviour with lower timeframe execution shifts using custom correlation algorithms, adaptive thresholds, and time-sensitive conditions, supporting seamless fractal analysis across nested timeframes.
CISD Detection Framework: A dedicated mechanism for identifying Change in State of Delivery (CISD), where price closes through the open of an opposing candle at or near HTF swing highs or lows after liquidity has been swept. This is used to highlight potential zones of directional change based on historical order flow dynamics.
Fractal AMDX Cycle Recognition: An engineered structure that detects and classifies phases of Accumulation, Manipulation, Distribution, and Continuation/Reversal (AMDX) across configurable candle sequences, allowing traders to visualize market intent within a repeatable cycle model.
Dynamic Invalidation Logic: An automated monitoring system that continually evaluates the validity of active setups. Setups are invalidated in real time when price breaches the extreme of the manipulation phase (C2), ensuring analytical consistency and contextual alignment.
4.1.2. Community Value
The closed-source nature of this tool protects the author’s original intellectual property while still delivering value to the TradingView community. The indicator offers a complete, real-time visual framework, educational annotations, and intuitive controls for analysing price action structure and historically observed patterns commonly attributed to institutional behaviour across timeframes.
5. Disclaimer & Terms of Use
This indicator, titled Fractal Market Model , has been independently developed by the author based on their own study, interpretation, and practical application of the smart money concepts. The code and structure of this indicator are original and were written entirely from scratch to reflect the author's unique understanding and experience. This indicator is an invite-only script. It is closed-source to protect proprietary algorithms and research methodologies.
This tool is provided solely for educational and informational purposes. It is not intended—and must not be interpreted—as financial advice, investment guidance, or a recommendation to buy or sell any financial instrument. The indicator is designed to assist with technical analysis based on market structure theory but does not guarantee accuracy, profitability, or specific results.
Trading financial markets involves significant risk, including the possibility of loss of capital. By using this indicator, you acknowledge and accept that you are solely responsible for any decisions you make while using the tool, including all trading or investment outcomes. No part of this script or its features should be considered a signal or assurance of success in the market.
By subscribing to or using the indicator, you agree to the following:
You fully assume all responsibility and liability for the use of this product.
You release the author from any and all liability, including losses or damages arising from its use.
You acknowledge that past performance—real or hypothetical—does not guarantee future outcomes.
You understand that this indicator does not offer personalised advice, and no content associated with it constitutes a solicitation of financial action.
You agree that all purchases are final. Once access is granted, no refunds, reimbursements, or chargebacks will be issued under any circumstance.
You agree to not redistribute, resell, or reverse engineer the script or any part of its logic.
Users are expected to abide by all platform guidelines while using or interacting with this tool. For access instructions, please refer to the Author's Instructions section or access the tool through the verified vendor platform.

CRT + PO3 Range Theory Hey everyone, I’ve put together a little script for TradingView that tries to show the classic CRT + PO3 (Power of Three) pattern. It’s still a work in progress, so please use it on a demo account and let me know what you think!
What It Does
Accumulation Phase: On each higher‐timeframe bar (e.g. 2-hour), it draws a shaded zone where price is hanging out. That’s when we assume “big players” are quietly building positions.
Manipulation Phase: If price briefly pokes above or below that zone but then slips back inside, it marks that wick as a shake-out.
Distribution Phase: When price finally closes cleanly outside the zone, it draws another shaded area and drops a “Distribution” label plus a big LONG or SHORT arrow on that bar.
You can tweak it so it only shows signals when a bar closes (no more weird flashing mid-bar), or even allow “direct” Distribution on a clean breakout without waiting for a fake wick first.
How to Set It Up
Add the script from your Indicators list.
Pick your HTF (I like 2-hour or 4-hour).
Turn “Show Zone Labels” on or off—these are the little “Accumulation/Manipulation/Distribution” tags.
Turn “Show Entry Signals” on to get the big LONG/SHORT arrows.
If you hate flicker, check “Show signals only at bar close.”
If you want to catch a swift breakout (no fake-out needed), check “Allow direct Distribution on clean breakout.”
There are also sliders for zone colors, transparency, label size, and how far above/below the bars the labels sit.
Why It’s Still a Beta
I’m not a CRT/PO3 guru—this is more of a hobby project and a little facination for this strategy.
There might be edge cases where it misses a shake-out or flags a Distribution too early.
I take no responsibility for your trades—please only run it on a demo account until we’ve worked out the quirks.
Feedback Wanted!
If you try it out, I’d love to hear:
Did the Manipulation wicks line up where you expected?
Were the Distribution arrows on the right bars?
Any ideas for easier settings or extra alerts?
Thanks for testing and helping me turn this into something solid!

Candle Range Trading (CRT) with Alerts
📌 Description:
The Candle Range Trading (CRT) indicator identifies potential reversal or continuation setups based on specific two-candle price action patterns.
It analyzes pairs of candles to detect Bullish or Bearish CRT patterns and provides visual signals (triangles) and alert notifications to support scalp or swing trading strategies.
🔍 How It Works:
🔻 Bearish CRT Pattern:
Candle 1 is bullish
Candle 2 is bearish
Candle 2's high > Candle 1's high
Candle 2 closes within Candle 1’s range
🔺 Red triangle above candle
🔺 Bullish CRT Pattern:
Candle 1 is bearish
Candle 2 is bullish
Candle 2's low < Candle 1's low
Candle 2 closes within Candle 1’s range
🔻 Green triangle below candle
📈 Visual Features:
🔺 Red triangle = Bearish CRT
🔻 Green triangle = Bullish CRT
📏 Optional box showing CRT High and CRT Low
🔔 Built-in Alerts:
Bullish CRT Alert: "Bullish CRT Pattern Detected"
Bearish CRT Alert: "Bearish CRT Pattern Detected"
Set alerts to get notified instantly when a pattern is detected.
⚠️ Note:
Use in conjunction with trend filters, support/resistance, or volume for best results.
Ideal for scalping or short-term trades.
Avoid trading in choppy or low-volume markets.
⚠️ Disclaimer:
This script was generated with the assistance of ChatGPT by OpenAI and is intended for educational and informational purposes only.
All strategies, alerts, and signals derived from this indicator should be thoroughly backtested and validated before using in live trading.
Trading involves substantial risk, and past performance is not indicative of future results. The author and ChatGPT bear no responsibility for any trading losses or financial decisions made using this script.
Users are solely responsible for the risks associated with their trading actions. Always apply proper risk management and perform your own due diligence before making any financial decisions.

Failed 2s - The StratDescription:
This indicator detects and highlights "Failed 2" candlestick patterns from The Strat methodology — key price action setups signaling potential reversals or continuation points. It automatically identifies Failed 2 Down (Failed 2D) and Failed 2 Up (Failed 2U) signals by analyzing two consecutive bars, with special attention to price interaction at the 50% midpoint of the previous candle.
Visuals:
- Green upward triangles mark Failed 2 Down signals (bullish setups).
- Red downward triangles mark Failed 2 Up signals (bearish setups).
- Special signals that touch the 50% midpoint of the previous candle are emphasized but use the same shapes.
Alerts:
Built-in alert conditions let you receive notifications when these patterns occur, so you never miss a trade opportunity.
How to Use ALERTS in TradingView
- Paste this code into Pine Editor on TradingView.
- Click Add to Chart.
Set alerts:
- Click "Alerts" → "Condition" = your indicator name
- Choose the alert type (e.g. "Failed 2D Bar Alert")
- Set "Once per bar close"
- Customize the notification method (pop-up, app, email, etc.)
GoldenPocket & CRT IndicatorWith this script, you will be able to see Golden Pocket Fibonacci Levels and Candle Range Theory Highs, Lows and EQs.
You can set lookback bar numbers to define Fibonacci highs and lows.
You can set CRT High Time-frame.
Simple and effective script. Please let me know if you have any comments and support me if you like it.
CRT with Trend FilterExplanation of Functionality
The CRT RED DOG with Trend Filter indicator is a tool used to identify buy and sell signals on a price chart. It filters signals based on the market trend to ensure higher accuracy.
Main Components of the Indicator
Moving Average (EMA) Settings
Users can set the moving average (EMA) length as desired, with a default value of 50 days.
This moving average is used to determine the market trend.
Determining Market Trend
Uptrend: Occurs when the closing price is above the moving average.
Downtrend: Occurs when the closing price is below the moving average.
Identifying Buy and Sell Signals
Buy Signal: Occurs when the current bar's low is lower than the previous bar's low, and the closing price is higher than the previous bar's close, during an uptrend.
Sell Signal: Occurs when the current bar's high is higher than the previous bar's high, and the closing price is lower than the previous bar's close, during a downtrend.
Displaying Signals on the Chart
Buy signals are displayed with a green arrow below the candlestick.
Sell signals are displayed with a red arrow above the candlestick.
Time frame Day >> 15M

CandelaCharts - CRT Model📝 Overview
Candle Range Theory (CRT) is a framework that treats every candle as a tradable range. A candle defines high/low, the next candle often sweeps one side (manipulation), reclaims back inside, and distributes toward the opposite side with 50% of the range as a common first target.
It posits that each candlestick represents a distinct range of price action, defined by its high, low, open, and close, and that price movements are structured within these ranges.
📦 Features
Timeframe Pairing: This indicator highlights movements on lower timeframes within higher timeframe candles, providing insights into micro trends, structural changes, and potential entry points.
Bias Selection: This feature allows analysts to manage bias and identify setups, displaying bullish, bearish, or neutral models that align with higher timeframe trends.
Double Purge Sweeps: A double purge is a type of sweep where the price breaks both the high and low of the previous candle (through the wicks) before closing within the range of that same candle.
CRT Times: Times when high-probability CRTs occur.
HTF Candles: The CRT Model is rooted in the ICT Power of Three, assisting traders in identifying key turning points and market transitions across multiple timeframes.
Auto-bias: Identify models using the HTF candle bias
Dashboard: Create a customizable table that displays key details such as timeframe pairing, time to next candle close, bias, and time filter settings.
Any Market: Ideal for all markets - stocks, forex, crypto, futures, commodities and more - delivering consistent results and insights across diverse trading environments.
⚙️ Settings
Core
Status: Filter models by status — All, Successful, Invalidated, or Active.
Real-time Models: Enable models formed and shown in real-time (before HTF candle close).
Bias: Choose model bias — Automatic, Neutral, Bearish, or Bullish.
Fractal: Select timeframe pairing like 1m - 15m, 4H - 1W, or Custom.
Custom Fractal TFs: Set LTF (e.g. 5) and HTF (e.g. 60) timeframes.
Model Labels: Show model labels (C1, C2, etc.) and choose label size and background color.
Exclude Non-profitable: Hide models deemed non-profitable based on CISD position.
Sweep
Sweep Line: Show model sweep lines with style, width, and color.
Sweeps with CISD: Filter sweeps that are linked with CISD models.
Invalidated Sweeps: Show invalidated sweeps (I-sweep), including LTF and HTF options.
D-purge Sweeps: Display double purge sweeps with customization options.
CISD
CISD Line: Display CISD (Change in State of Delivery) on the chart with style, width, and length.
CISD Colors: Set line colors for Bullish and Bearish CISD.
CRT
Box High/Low: Show CRT box high/low with style, width, and color for bullish, bearish, and current.
High/Low Mean: Enable the mean line of the CRT H/L range with line customization and color.
CRT Labels: Show CRT box labels and choose label size.
Hide Overlapped: Option to hide overlapping CRT boxes.
History
Model History Lookback: Define how many past CRT models to retain and show.
Time
2-3-4: Filter models based on 2-3-4 AM hours.
7-8-9: Filter models based on 7-8-9 AM hours.
8-9-10: Filter models based on 8-9-10 AM and PM hours.
1-5-9: Filter models based on 1-5-9 AM and PM hours.
2-6-10: Filter models based on 2-6-10 AM and PM hours.
Custom: Filter models based on a user-defined custom session.
HTF
Show Candles: Display HTF candles with number, colors, and spacing.
Offset: Adjust the HTF candle offset from the current chart.
Space: Adjust the HTF candle spacing.
Size: Choose HTF candle size (e.g., Small, Large).
Labels: Show HTF candle labels with size and color options.
Open Trace Line: Show line for HTF open with style, width, and color.
True Day Open: Toggle display of TDO line.
PD Array: Enable and configure HTF PD arrays (FVG, IFVG), with style, color, threshold, line, and border.
LTF
High/Low Lines: Show H/L lines with line style, width, and color.
Open/Close Lines: Show O/C lines with style, width, and color.
Dashboard
Information Panel: Toggle visibility and choose position.
Display Mode: Select between Pro or Stack display layout.
Alerts
Model Formed: Alert when a model is formed.
Model Completed: Alert when a model is successfully completed.
Model Invalidated: Alert when a model becomes invalid.
Sweep: Alert on sweep events.
D-purge: Alert on double purge events.
💡 Framework
The CRT Model is designed to analyze and interpret price action patterns through various components, each of which plays a critical role in identifying market trends and providing actionable insights.
The model incorporates the following timeframe alignments:
15s - 5m
1m - 15m
2m - 20m
3m - 30m
5m - 1H
15m - 4H
30m - 12H
1H - 1D
4H - 1W
1D - 1M
1W - 3M
Below are the key components that make up the model:
Sweep
D-purge
CISD
Mean
CRT H/L
The CRT Model follows a specific lifecycle, which highlights the current state of the model and determines whether a trade opportunity is valid.
The model's lifecycle includes the following statuses:
Formation (grey)
Invalidation (red)
Success (green)
By utilizing the phases of Formation, Invalidation, and Success, traders can efficiently manage their positions, reduce risk, and take advantage of high-probability setups offered by the CRT Model.
Trading Candle 2 (The Reversal)
Use Candle 2’s wick, body, and context to judge whether the next leg trends or mean-reverts.
Expansion vs. reversal
Expansion candle: Small wicks, strong body, one-way momentum.
Reversal (Candle 2): Drives opposite, prints a long opposing wick, closes near open—context decides if it’s tradable.
Key idea: Small wicks favor continued expansion; large wicks often cap expansion because the range was “spent” building the wick.
Why wick size matters
Small-wick reversal: More “runway”—target prior highs/lows, liquidity pools, standard-deviation projections.
Large-wick reversal: Range consumed—expect mean-reversion toward the open or session extremes.
Think of wick size as a fuel gauge: less wick → more potential.
Trading Candle 3 (The Continuation)
Candle 2 flips bias; Candle 3 aims to capture the follow-through (Candle 4 often offers secondary continuation).
Wick size on Candle 2 decides the play:
Small wick → you can trade Candle 2 directly.
Large wick → let Candle 2 close and trade Candle 3 instead.
Avoid chasing weak continuations:
If Candle 2 has already expanded hard, Candle 3 can become a chase into retrace/chop.
Demand extra LTF confluence: protected swings, SMT divergence, and multiple continuation cues aligning.
⚡️ Showcase
Introducing the CRT Model is a powerful trading tool designed to elevate your market analysis and boost your trading success. Built with precision and advanced algorithms, this indicator helps you identify key trends, potential entry and exit points, and optimize your strategy for better decision-making.
Bearish Models
Bullish Models
Active Models
HTF PD Arrays
Lead with context, not the pattern: set a clear higher-timeframe bias, then sync the intermediate and lower timeframes to it.
🚨 Alerts
This script offers alert options for all model types. The alerts need to be set up manually from TradingView.
The CRT Model supports the following alert types, each designed to signal key moments in the model’s development and execution:
Model Formation: Signals the initial setup of the CRT Model with a bullish (+B) or bearish (-B) bias, indicating a potential trade opportunity is developing.
Model Successful: Confirms that the CRT setup has played out successfully.
Model Invalidated: Indicates the model has failed or been broken.
Model Sweep: Alerts when a liquidity sweep occurs during model formation.
Model D-Purge Sweep: Occurs when a single candle is swept on both sides (high and low).
⚠️ Disclaimer
These tools are exclusively available on the TradingView platform.
Our charting tools are intended solely for informational and educational purposes and should not be regarded as financial, investment, or trading advice. They are not designed to predict market movements or offer specific recommendations. Users should be aware that past performance is not indicative of future results and should not rely on these tools for financial decisions. By using these charting tools, the purchaser agrees that the seller and creator hold no responsibility for any decisions made based on information provided by the tools. The purchaser assumes full responsibility and liability for any actions taken and their consequences, including potential financial losses or investment outcomes that may result from the use of these products.
By purchasing, the customer acknowledges and accepts that neither the seller nor the creator is liable for any undesired outcomes stemming from the development, sale, or use of these products. Additionally, the purchaser agrees to indemnify the seller from any liability. If invited through the Friends and Family Program, the purchaser understands that any provided discount code applies only to the initial purchase of Candela's subscription. The purchaser is responsible for canceling or requesting cancellation of their subscription if they choose not to continue at the full retail price. In the event the purchaser no longer wishes to use the products, they must unsubscribe from the membership service, if applicable.
We do not offer reimbursements, refunds, or chargebacks. Once these Terms are accepted at the time of purchase, no reimbursements, refunds, or chargebacks will be issued under any circumstances.
By continuing to use these charting tools, the user confirms their understanding and acceptance of these Terms as outlined in this disclaimer.

CandelaCharts - Fractal Range Model📝 Overview
The Fractal Range Model (FRM) is an all-encompassing and sophisticated trading framework that incorporates multiple market dynamics to provide a deeper understanding of price movements.
This model is built around several key principles, including Market Swing Points, Sweeps, Candle Mean, and Change in State of Delivery (CISD), which together offer a nuanced and effective approach to trading.
At its core, the model focuses on Market Swing Points, which represent crucial turning points in the market where price action shifts direction.
These points provide insight into potential reversals and momentum changes, allowing traders to identify key support and resistance areas.
Recognizing these swings is critical in anticipating future price movements and understanding the market’s underlying structure.
The Fractal Range Model (FRM) is a versatile trading strategy that adapts to various styles, whether you're into scalping, day trading, swing trading, or long-term investment. Its flexibility makes it suitable for traders with different time horizons and risk preferences, allowing it to be effectively applied across multiple market conditions.
📦 Features
Timeframe Alignment: This indicator reveals lower Timeframe movements within higher Timeframe candles, offering insights into micro trends, structure shifts, and key entry points.
Bias Selection: This feature lets analysts control bias and setup detection, viewing bullish, bearish, or neutral formations to align with higher Timeframe trends.
Double Purge Sweeps: A double purge is a type of Sweep where the price exceeds both the high and low of the previous candle (via wicks) and then closes within the range of the prior candle.
Time Filters: Sync Time and price by selecting custom Time windows to focus on relevant formations.
Higher Timeframe Candles: The Fractal Range Model integrates ICT Power of Three, helping traders spot key turning points and market transitions across Timeframes.
Higher Timeframe PD Arrays: The HTF PD Arrays (FVG, IFVG) are key points of interest that indicate significant market levels where valid sweeps are likely to occur.
Lower Timeframe PD Arrays: The LTF PD Arrays (FVG, IFVG), on the other hand, are used for identifying entry points.
Smart Money Technique: In the context of the Fractal Range Model (FRM), the SMT (Smart Money Technique) serves as a crucial confluence indicator that strengthens the reliability of a formed model.
Info Panel: Display a customizable table with key details like timeframe pairing, time to next candle close, bias, and time filter settings, with full control over size, location, and borders.
Suitable for any Market: Ideal for all markets - stocks, forex, crypto, futures, commodities and more - delivering consistent results and insights across diverse trading environments.
⚙️ Settings
Core
Status: Filter models based on status
Bias: Controls what model type will be displayed, bullish or bearish
Fractal: Controls the timeframe pairing will be used
Mean: Plots the equilibrium of the previous HTF candle
Liquidity: Displays the liquidity levels that belongs to the model
Sweep: Shows the sweep that forms a model
I-sweep: Controls the visibility of invalidated sweeps
D-purge: Plots the double purge sweeps
CISD: Displays the Change In State of Delivery for a model
Labels: Adjust the HTF candle label size
C-area: Highlights the region between current candle open and previous candle equilibrium
History
History: Controls the mount of past models displayed on the chart
Filters
Asia: Filter models based on Asia Killzone hours
London: Filter models based on London Killzone hours
NY AM: Filter models based on NY AM Killzone hours
NY Launch: Filter models based on NY Launch Killzone hours
NY PM: Filter models based on NY PM Killzone hours
Custom: Filter models based on user Custom hours
HTF
Candles: Controls the number of HTF candles that will be visible on the chart
Open: Highlights with a line the open price of current HTF candle
Show True Day Open: Display True Day Open line
Offset: Controls the distance of HTF from the current chart
Space: Controls the space between HTF candles
Size: Controls the size of HTF candles
PD Array: Displays ICT PD Arrays
CE Line: Style the equilibrium line of PD Array
Border: Style the border of PD Array
LTF
H/L Line: Displays on the LTF chart High and Low of each HTF candle
O/C Line: Displays on the LTF chart Open and Close of each HTF candle
PD Array: Displays ICT PD Arrays
CE Line: Style the equilibrium line of PD Array
Border: Style the border of PD Array
Projections
StDev: Controls standard deviation available levels
Labels: Controls the size of standard deviation levels
Anchor: Controls the anchor point of standard deviation levels (wick, body)
Lines: Controls the line widths and color of standard deviation levels
SMT
Show: Display SMT
Symbol: Symbol 1
Symbol: Symbol 2
Style: Controls the color of Bearish and Bullish SMTs
Dashboard
Panel: Display information about current model
💡 Framework
The model includes the following timeframe parings:
15s - 5m
1m - 15m
1m - 30m
2m - 20m
3m - 30m
3m - 60m
5m - 1H
15m - 4H
15m - 8H
30m - 9H
30m - 12H
1H - 1D
2H - 2D
3H - 3D
4H - 1W
8H - 2W
12H - 3W
1D - 1M
2D - 2M
1W - 3M
2W - 6M
3W - 9M
1M - 12M
The Fractal Range Model follows a specific lifecycle, which highlights the current state of the model and determines whether a trade opportunity is valid.
The model's lifecycle includes the following statuses:
Formation (grey)
Invalidation (red)
Success (green)
1. Formation
The Formation phase marks the initial setup of the Fractal Range Model. During this stage, the model identifies and plots key components, such as:
Sweeps: Market movements that indicate a potential reversal or strong shift in trend.
CISD (Change In State of Delivery): A structural change that provides insight into trend shifts.
Once these components are detected, the model automatically calculates and displays Projections and Liquidity Levels , offering insights into potential price action movements.
At this stage, the model also identifies and displays the following key elements:
HTF PD Arrays (Higher-Timeframe Price Delivery Arrays)
LTF PD Arrays (Lower-Timeframe Price Delivery Arrays)
Smart Money Technique (SMT)
If any of these elements are present, they will be automatically displayed on the chart.
2. Invalidation
A Fractal Range Model is considered invalidated when the price does not reach the 2 Standard Deviation level or the first identified liquidity level, and when the price breaks above the high that formed the Sweep.
Invalidation signals that the original setup is no longer reliable, and traders should avoid taking action based on the model's original parameters.
Key invalidation conditions:
Price fails to reach the 2 Standard Deviation level.
Price fails to reach the first liquidity level.
Price breaks the high/low that initiated the Sweep.
A potentially invalidated model is marked with a purple color above the label, indicating the sweep is invalidated by the next candle, but not the high that formed the sweep.
3. Success
A Fractal Range Model is considered successful when the price reaches the 2 Standard Deviation level or the first identified liquidity level. This indicates that the model's predictions align with actual market movements, confirming the setup's validity and providing a potential trading signal.
At this stage, alongside Projections and Liquidity levels, you'll also notice the C-area — the region between the current candle's open and the previous candle's mean. If respected, price action will follow the model's direction.
Key success conditions:
Price reaches the 2 Standard Deviation level.
Price reaches the first liquidity level.
By leveraging these phases, Formation, Invalidation, and Success, traders can effectively manage their positions, minimize risk, and capitalize on high-probability setups based on the Fractal Range Model.
⚡️ Showcase
Introducing Fractal Range Model is a powerful trading tool designed to elevate your market analysis and boost your trading success. Built with precision and advanced algorithms, this indicator helps you identify key trends, potential entry and exit points, and optimize your strategy for better decision-making.
History
HTF Candles
HTF PD Arrays
LTF PD Arrays
SMT
Unlock your full trading potential and experience the difference with Fractal Range Model — your ultimate tool for smarter, more informed trading decisions.
🚨 Alerts
This script offers alert options for all model types. The alerts need to be setup manually from Tradingview.
Bearish Model
A bearish model alert is triggered when a model forms, signaling a high sweep and CISD.
Bullish Model
A bullish model alert is triggered when a model forms, signaling a low sweep and CISD.
⚠️ Disclaimer
These tools are exclusively available on the TradingView platform.
Our charting tools are intended solely for informational and educational purposes and should not be regarded as financial, investment, or trading advice. They are not designed to predict market movements or offer specific recommendations. Users should be aware that past performance is not indicative of future results and should not rely on these tools for financial decisions. By using these charting tools, the purchaser agrees that the seller and creator hold no responsibility for any decisions made based on information provided by the tools. The purchaser assumes full responsibility and liability for any actions taken and their consequences, including potential financial losses or investment outcomes that may result from the use of these products.
By purchasing, the customer acknowledges and accepts that neither the seller nor the creator is liable for any undesired outcomes stemming from the development, sale, or use of these products. Additionally, the purchaser agrees to indemnify the seller from any liability. If invited through the Friends and Family Program, the purchaser understands that any provided discount code applies only to the initial purchase of Candela's subscription. The purchaser is responsible for canceling or requesting cancellation of their subscription if they choose not to continue at the full retail price. In the event the purchaser no longer wishes to use the products, they must unsubscribe from the membership service, if applicable.
We do not offer reimbursements, refunds, or chargebacks. Once these Terms are accepted at the time of purchase, no reimbursements, refunds, or chargebacks will be issued under any circumstances.
By continuing to use these charting tools, the user confirms their understanding and acceptance of these Terms as outlined in this disclaimer.

ICT CRT Model Range with EquilibriumICT CRT Model Range with Equilibrium Indicator
This indicator calculates and displays the high, low, and equilibrium levels within a custom-defined session (9:00 am to 10:00 am New York Time and the lines will stop appearing at 16:00pm ). It draws horizontal lines to represent the session's range and marks the equilibrium point as a reference.
What is CRT (Candle Range Theory)?
Candle Range Theory (CRT) is based on the concept that every candle on any timeframe forms its own range. These ranges can either be manipulated—through strategies like Turtle Soup—or broken, resulting in price movements such as engulfing patterns, breakouts, and retests beyond the candle's high or low.
CRT is commonly visualized as a 3-candle model, but it can include more candles due to the presence of inside bars. An inside bar is a candle whose high is not higher than the previous candle's high and whose low is not lower than the previous candle's low.
The CRT model follows the A-M-D structure:
Accumulation (A): The first candle or group of candles (inside bars) represents market consolidation.
Manipulation (M): The second candle signals a false move, often a Turtle Soup setup designed to trap traders.
Distribution (D): The third candle confirms the true market move, breaking out of the range and establishing the trend.
Customizable Settings:
Line Colors: Choose your preferred colors for the high, low, and equilibrium lines.
Line Widths: Adjust the thickness of the lines for better visibility.
Line Styles: Select from solid, dotted, or dashed styles for each line.
Label Settings: Customize the text and colors of the labels for the high, low, and equilibrium points.
Traders can easily modify these settings to suit their visual preferences and trading strategies. This indicator is ideal for identifying price action within a specific range, offering clear visual cues for potential CRT Setup.

CANDLE RANGE THEORY (H1 Only)Hello traders.
This indicator identifies CRT candles
-Each candle is a range.
-Each candle has its own po3.
-Focus on specific times of the day. By recognizing the importance of time and price, we can capture high-quality trades. Together with HTF PD array, Look for 4-hour candles forming at specific times of the day. (1am - 5am - 9am EST)
-After the 1st candle, wait for the 2nd candle to clear the high/low of the 1st candle and then close inside the 1st candle range at a specific time (1-5-9) and look for entries in the LTF
Why choose 1 5 9 hours EST?
### **1. 1:00 AM (EST)**
- **Trading Session:** This is the time between the Tokyo (Asian) session and the Sydney (Australian) session. The Asian market is very active.
- **Characteristics:**
- Liquidity: Moderate, as only the Asian market is active.
- Volatility: Pairs involving JPY (Japanese Yen), AUD (Australian Dollar), and NZD (New Zealand Dollar) tend to have higher volatility.
- Trading Opportunities: Suitable for traders who like to trade trends or news in the Asian region.
- **Note:** Volatility may be lower than the London or New York session.
### **2. 5:00 AM (EST)**
- **Trading Session:** This is the time near the end of the Tokyo session and the London (European) session is about to open.
- **Characteristics:**
- Liquidity: Starts to increase due to the preparation of the European market.
- Volatility: This is the time between two trading sessions, there can be strong fluctuations, especially in major currency pairs such as EUR/USD, GBP/USD.
- Trading opportunities: Suitable for breakout trading strategies when liquidity increases.
- **Note:** The overlap between Tokyo and London can cause sudden fluctuations.
### **3. 9:00 AM (EST)**
- **Trading sessions:** This time is within the London session and near the beginning of the New York session.
- **Characteristics:**
- Liquidity: Very high, as this is the period between the two largest sessions – London and New York.
- Volatility: Extremely strong, especially for major currency pairs such as EUR/USD, GBP/USD, USD/JPY.
- Trading opportunities: Suitable for both news trading and trend trading, as this is the time when a lot of economic data is released (usually from the US or the European region).
- **Note:** High volatility can bring big profits, but also comes with high risks.
### **Summary of effects:**
- **1 AM (EST):** Moderate volatility, focusing on Asian currency pairs.
- **5 AM (EST):** Increased liquidity and volatility, suitable for breakout trading.
- **9 AM (EST):** High volatility and high liquidity, the best time for Forex trading.
==> How to trade, when the high/low of CRT is swept, move to LTF to wait for confirmation to enter the order
Only sell at high level and buy at discount price.
Find CE at specific important time. Trading CRT with HTF direction has better win rate.
The more inside bars, the higher the probability.
Place a partial and Move breakeven at 50% range.
Do a backtest and post your chart.

4H CRT (1AM and 5AM)This TradingView script is designed to assist traders in implementing the "4-Hour Candle Ranges Theory Strategy (CRT)" by identifying key levels and setups based on the 1am and 4am (5am) 4-hour candles. This strategy is particularly effective for trading high-volatility assets such as Gold, EUR/USD, NAS100, US30, and S&P500, with US30 showing a notably high win rate. Here's how the strategy works:
Key Features:
1. Marking 1am and 4am 4-Hour Candle Ranges
- The script highlights the high and low of the 1am 4-hour candle.
- It visually tracks whether the high or low of the 1am candle is taken out by the subsequent 4-hour candle (5am).
2. Entry Setup Rules
- Primary Setup: Wait for the high or low of the 1am candle to be taken out by the 5am candle. Once this sweep occurs, wait for a Market Structure Shift (MSS) on the lower time frame (15min) to confirm your entry.
- Secondary Setup: If the 5am candle fails to take out the high or low of the 1am candle, the setup focuses on the levels formed by the 5am candle.
3. Trade Execution on 15-Minute Timeframe
- The script supports a lower time frame (15min) view to identify MSS and fine-tune entries.
4. Rinse and Repeat
- This process can be applied daily for consistent opportunities across the specified assets.
Advantages:
- Provides clear visual markers for key levels based on the 4-hour candles.
- Automates level plotting, saving traders time and reducing manual errors.
- Integrates well with the 15-minute timeframe for precise entry triggers.
- Optimized for popular trading instruments, especially US30 for a higher probability of success.
This script simplifies the application of CRT by automating the process of identifying and marking critical levels, enabling traders to focus on executing high-probability setups effectively.
Created by Hamid (poraymanfx)
