Omni-Trend Analytics + Live PnL DashboardOverview
The Omni-Trend Analytics suite is an all-in-one technical command center. It integrates the battle-tested UT Bot signal logic with a sophisticated real-time dashboard, session tracking, and multi-timeframe trend analysis.
📊 The "Nexus" Dashboard
The heart of this script is the 6-row dynamic dashboard, designed to give you "at-a-glance" confluence:
RSI & RSI-MA: Tracks the standard RSI alongside a custom RSI-based Moving Average to spot momentum shifts before they hit the price.
Selectable Trend Status: Unlike static indicators, you can toggle the "Trend" source between EMA 9, 20, or 200 in the settings to match your trading style (Scalping vs. Swing).
Distance to EMA: Shows exactly how "overextended" the price is from your selected trend line.
ATR Volatility (Color-Coded): Turns Green when volatility is expanding (ideal for trend following) and Red when the market is contracting (ideal for range-trading or caution).
Live PnL Tracking: Automatically calculates the profit or loss of the most recent UT Bot signal in real-time.
🛠️ Key Features & Settings
Precision Signals: Combines UT Bot Buy/Sell labels with RSI "!" reversal warnings for high-probability entries.
Institutional Moving Averages: Includes 5 SMAs (including the 610 SMA) and 3 EMAs (9, 20, 200) all set to a professional Thickness 2 for clarity.
Session Highlighting: Automatically shades the background for London and New York sessions to help you trade when liquidity is highest.
VWAP Integration: Includes a purple VWAP line to ensure you are trading at a "fair value" relative to volume.
🔔 Strategic Alert Suite
The script comes pre-loaded with 6 specialized alert conditions:
UT Bot Signal: Standard entry alerts.
RSI Cross RSI-MA: Early warning for momentum reversals.
High-Prob UT + VWAP: Signals that only trigger when aligned with institutional volume.
EMA 9/20 Momentum Cross: Classic trend-shift notification.
ATR Volatility Spike: Alerts you to 50% increases in market volatility.
PnL Target / Break-Even: Pings you when your live trade reaches a user-defined profit threshold.
💡 Trading Pro-Tip
The Convergence Strategy: Look for a UT Bot Buy signal that occurs during the London/NY Overlap while the ATR is Green (expanding) and the RSI is crossing over its RSI-MA. This "triple confluence" is the primary design intent of the Omni-Trend suite.
Cryoptocurrency

Krown Cryptos 6 Moving AveragesCouldnt find Krown's moving average indicator so I took the time to make my own use and to aid those who follow his channel.
The moving averages are a mixed batch with mostly EMAS with the 10SMA and 200SMA included. The MAs are labelled so if you question which one is which
10SMA
21EMA
50EMA
89EMA
200SMA
200EMA
377EMA
If anyone has experience with tradingviews pineeditor and knows how to change the title of each MA so I can remove the "6 moving averages" part that would be a great help so please feel free to inbox me.

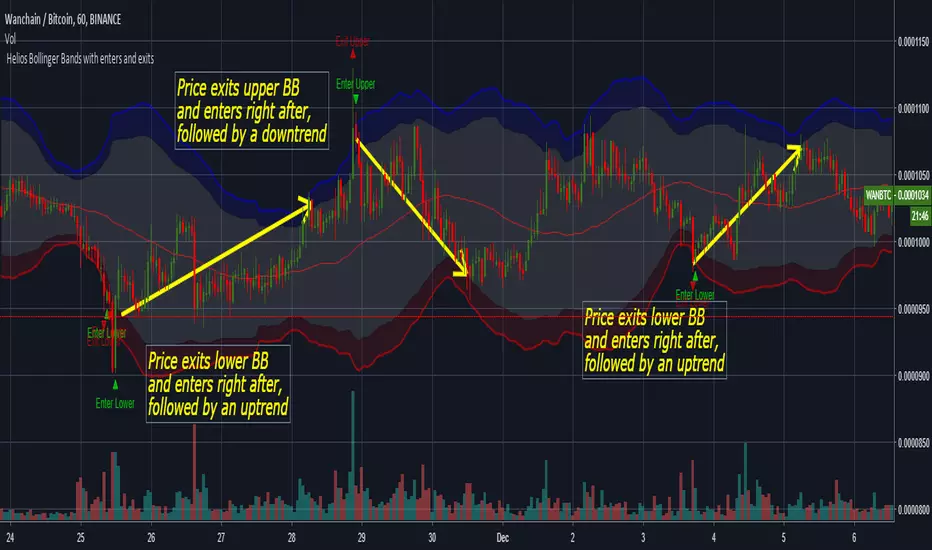
Helios Bollinger Bands with enters and exits by ZekisClassic Bollinger Bands with enters and exits from the channel
The purpose of Bollinger Bands is to provide a relative definition of high and low prices of a market. By definition, prices are high at the upper band and low at the lower band. This definition can aid in rigorous pattern recognition and is useful in comparing price action to the action of indicators to arrive at systematic trading decisions
The use of Bollinger Bands varies widely among traders. Some traders buy when price touches the lower Bollinger Band and exit when price touches the moving average in the center of the bands. Other traders buy when price breaks above the upper Bollinger Band or sell when price falls below the lower Bollinger Band . Moreover, the use of Bollinger Bands is not confined to stock traders; options traders, most notably implied volatility traders, often sell options when Bollinger Bands are historically far apart or buy options when the Bollinger Bands are historically close together, in both instances, expecting volatility to revert towards the average historical volatility level for the stock.
When the bands lie close together, a period of low volatility is indicated. Conversely, as the bands expand, an increase in price action/market volatility is indicated. When the bands have only a slight slope and track approximately parallel for an extended time, the price will generally be found to oscillate between the bands as though in a channel.
Traders are often inclined to use Bollinger Bands with other indicators to confirm price action. In particular, the use of oscillator-like Bollinger Bands will often be coupled with a non-oscillator indicator-like chart patterns or a trendline . If these indicators confirm the recommendation of the Bollinger Bands , the trader will have greater conviction that the bands are predicting correct price action in relation to market volatility .
en.wikipedia.org
Enjoy!
@Zekis