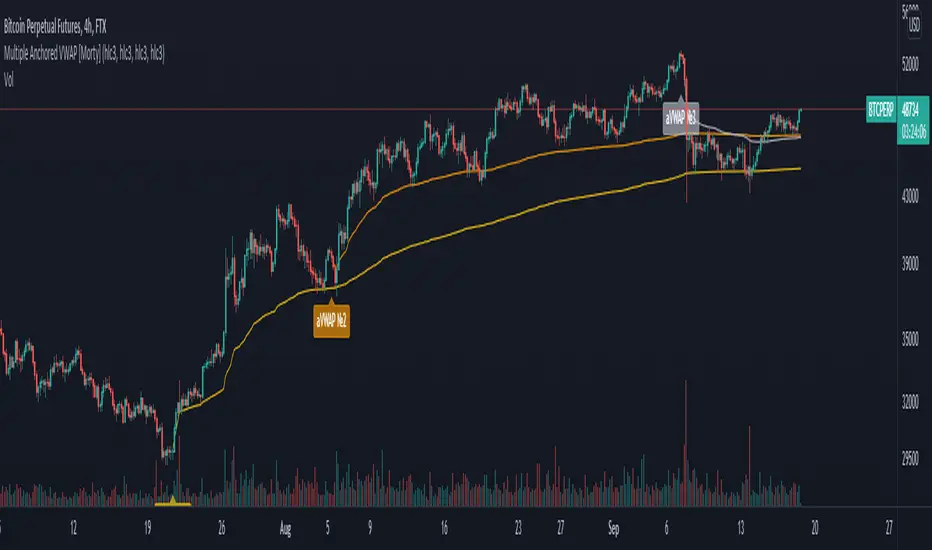
Multiple Anchored VWAP [Morty]The Anchored VWAP (aVWAP) indicator ties VWAP calculations to a specific price bar chosen by the trader. Anchored VWAP allows you to specify the price bar where calculations begin, making it easy to see whether the bulls or bears have been in charge since a very specific point in time. The starting price bar that is chosen generally marks a shift in market psychology, such as a significant high or low, earnings, news, or other announcements. The Anchored VWAP line is charted using price and volume data from that significant event onward.
This indicator plots up to 4 aVWAP lines in the chart.
Features:
- plot up to 4 aVWAP lines
- custom start date of aVWAP
- custom line color
- optional label of starting price bar
- optional custom resolution
----------------------------------------------------
锚定VWAP(aVWAP)指标将VWAP的计算与交易者选择的特定价格柱联系起来。锚定VWAP允许你指定计算开始的价格柱,使你很容易看到自一个非常具体的时间点以来,是牛市还是熊市在起作用。所选择的起始价格条通常标志着市场心理的转变,如一个重要的高点或低点、收益、新闻或其他公告。锚定VWAP线是使用从该重大事件开始的价格和成交量数据绘制的。
该指标在图表中最多绘制了4条aVWAP线。
特色:
- 绘制多达4条aVWAP线
- 自定义aVWAP的开始日期
- 自定义线的颜色
- 可选的起始价格条的标签
- 可选的自定义分辨率
加密貨幣
Aggregated Volume Indicator - Across biggest exchangesThis indicator allows you to view the total volume across multiple exchanges at the same time.
Currently, the indicator is pulling volume from these exchanges
COINBASE
FTX
BINANCE
BITFINEX
KUCOIN
KRAKEN
The script will pull data from coins that are available on those exchanges and sum up the volume.

Exponential MA Channel, Daily Timeframe (Crypto)Moving averages are some of the most common tools for traders. Some of the most widely used ones are simple moving averages (e.g. 20SMA, 50 SMA, 100 SMA, 200SMA,...). There are endless combinations of moving averages that can be used. I prefer to use exponential moving averages because they react more quickly to price data (essentially they filter back through the data over a discrete number of timesteps, with more recent history receiving the highest weighting in the final calculation).
This script uses a combination of the 21EMA, 53 EMA, and 100EMA. The idea of this script is to provide insight into when an asset might be close to a local top/bottom by monitoring price within the middle channel (yellow, blue, and orange lines), as well as identifying longer timeframe opportunities to buy/sell by examining the upper (green) and lower (red) bands. Disclaimer: this is not a guarantee that if price enters a region, that it will be a top or bottom, it is simply an indicator to get an idea based on price history.
As far as I know, this particular combination of exponential moving averages has not yet been published. I do not have an infinite amount of time to check through the entire library of published scripts. If someone else has already done this, I was unaware. Numerical computations were performed on ETHBTC price data in order to find the coefficients used in this script. Essentially, each EMA has a multiplier of either 1, a fraction of 1, or a number larger than 1 (these are the numbers in the script being multiplied by 'out1', 'out2', 'out3'; feel free to change these and see how this changes the indicator). I have found it to be useful for myself, and hope other people can tinker with this idea. My only wish is to allow other people to use this starting point to explore for themselves. I hope that I am allowed to publish this script without it being taken down so that others can freely use it.
Recommendations: although this was fit specifically for ETHBTC, it appears useful for many crypto pairs, specifically alt-BTC pairs and crypto-USD pairs. For example, I have found it useful for BTCUSD, ETHUSD, LINKUSD, LINKBTC, ETHBTC, ADABTC, etc. Only use on the DAILY timeframe.

Trend System Oscillator Averages RatingThis is a trend system made with multiple oscillator averages designed especially for trending markets such as stocks or crypto.
It can be used with any timeframe.
Its made of multiple moving oscillators such as
RSI
Stochastic
ADX
CCI
AO
MACD
MOM
STOCH RSI
WPR
BP
UO
Avg of all oscillators
It has also a rating, making an avg from all of the oscillators , going from -100 (all ma's are telling to go short ) to 100 ( all ma are telling to go long).
If you have any questions let me know !

Trend System Multiple Moving Averages RatingThis is a trend system made with multiple moving averages designed especially for trending markets such as stocks or crypto.
It can be used with any timeframe.
Its made of multiple moving averages such as
Simple
Weighted
Volume Weighted
Exponential
Double EMA
Arnaud Legoux
Hull MA
Smoothed
Least Squares
Kaufman Adaptive
Triple EMA
Zero Lag
Fractal Adaptive
Variable Index Dynamic Average
Jurik Moving Average
Tillson
Triangular
Avg of all moving averages
It has also a rating, making an avg from all of the moving averages , going from -100 (all ma's are telling to go short ) to 100 ( all ma are telling to go long).
If you have any questions let me know !

CryptoFall v1.0.0Category: Trend Analysis
Timeframe:
- Best on 4H, D
- Faster on 30M, 1H
Suggested Use: In uptrend.
Input option: Is possible to use "Alternative Time Frame" using other candles on different Time Frame charts.
Logic: The tradable market range is calculated, on which the Fibonacci levels are automatically calculated, at this point the entries could be defined entering on the important zone levels.
The calculation takes into account a combination of indicators such as:
- Fibonacci Retracement ( FibRetr )
- Theory of W. D. Gann .
Entry: The indicator uses Fibonacci levels to identify a good time to enter using the Buy the Dip approach (i.e. considering that a typical pullback is in the range between 0.382 and 0.618).
Tips: The best way to enter the market is always to split the positions so as not to enter entirely and expose yourself with all your capital, @TheSocialCryptoClub insists on a careful management of the orders so as to be able to mediate the price depending on the depth of the retracements.
Exit: Defined by the investor's long-term objective.
Thanks for attention.

Current to BTC [Morty]This indicator helps you find strong bull altcoin, it shows the ratio of the current symbol to BTC.
Donchian Channels help to identify trends.
Alts Bull coins:
When BTC goes sideway, they pump first.
Alts Bear coins:
When BTC goes sideway, they move sideway.
When BTC goes down, they go down harder.

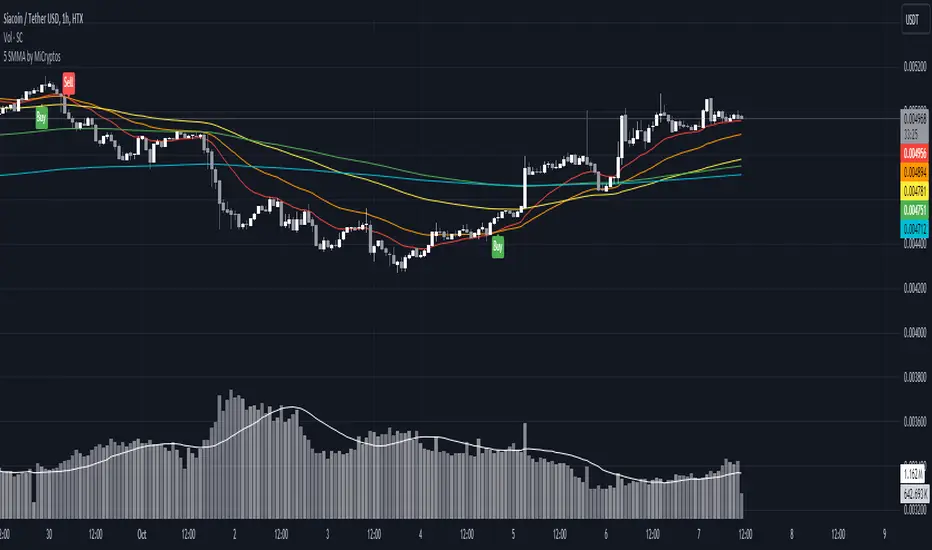
5 SMMA - by MiCryptoGives you the 5 most common SMMA for crypto in day trading:
- 10
- 21
- 50
- 100
- 200
This can be configured as you want.
Hope this can help you to get more indicators in a free plan.
CryptoKiller Support ResistanceThe CK family is ready to welcome a new indicator: CryptoKiller Support Resistance.
Our oscillator determines the levels where the price has congestion, both up and down.
This is why we decided to exploit these signals so as to make an indicator capable of tracking supports and resistances.
The indicator marks the support and resistance levels found by CryptoKiller Oscillator, the blue / light blue lines are found
during bullish movements; purple and magenta lines are found during bearish movements.
The light blue and magenta colors indicate probable support levels, the blue and purple colors indicate probable resistance levels.
If multiple lines occur in a narrow price range, the price is in an area where there is a high probability of reversal (probable market top or bottom).
As well as CryptoKiller and CryptoKiller Oscillator it is optimized for ETHUSDTPERP 30 min, BTCUSDTPERP 30 min and BNBUSDTPERP 30 min, but it can be used on any chart and timeframe, there is a custom mode with which to change the input parameters.
This script is provided together with CryptoKiller and CryptoKiller Oscillator. It is also possible to have it separately from the others, as always with a free trial week.

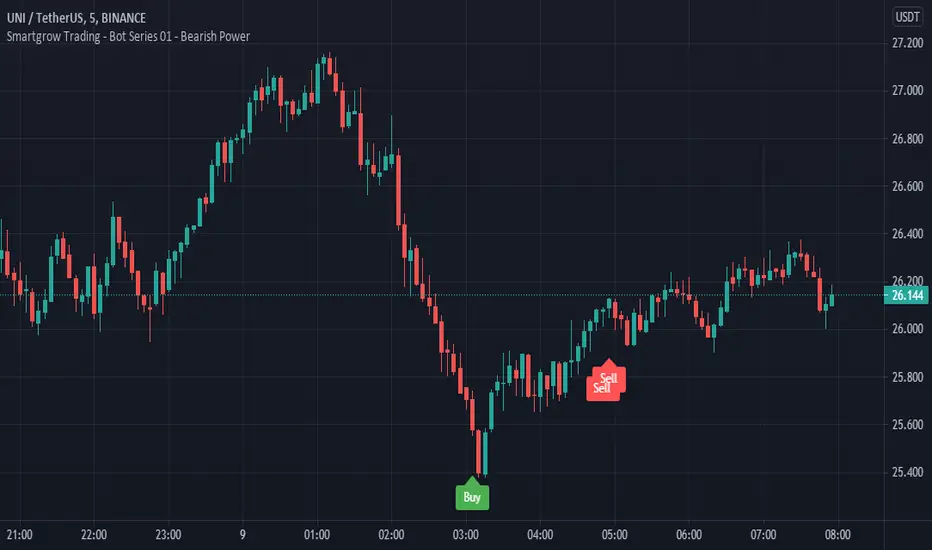
Smartgrow Trading - Bot Series 01 - Bearish PowerWelcome to our first Tradingview trading bot.
We develop signals which have been specially developed for crypto trading bots. We publish new indicators at regular intervals.
The main idea behind the bot is to use custom created indicators in a short and longer term timeframe to signal potential trendreversals in downtrends or ranging markets. The bot is not waiting for a trend confirmation signal before entering a trade, on the contrary, the bot waits for statistical extreme values to open a trade. When potential signals are detected we are trailing price to find the best spot to enter a trade. With this approach we buy in strong oversold areas as these have great potential to move in the other direction again. The sell signals are also generated by this custom indicator only selling off, if a stronger recovery in the market has occured. The potential profit margin is therefore between the best possible entry into a heavily oversold market and a recovery of the market.
So this tradingbot isnt designed to work with take profit, stop loss or trailing stop loss. This would result in a long term loss and is therefore not recommented. Also the bot is not tested in any other market like futures or stocks. So we recommend to use it in crypto spot market only.
Depending on market situations, potential losses can occur when a market is strongly bearish and does not want to recover over a long range, or when the bot has entered a trade to early. We have built in a safety mechanism for detecting further downtrends to avoid major losses. This mechanism is part of the needed risk management Therefore we are suggesting to use a proper risk management so only use 2-5% of your funds per trade. We use this bot with 2,5% funds per trade for our personal use. The study needs to be set up in the 5 min chart to work and you need to set up one buy alarm and one sell alarm per pair. The Signals are very picky therefore it is suitable to apply it on all possible pairs on your exchange excluding stable and shitcoins. You could test it in other financial markets but the bot was developed especially for crypto markets. If you have questions regarding pairs or want to see real life performance, feel free to contact us.
This indicator using different timeframes so it is sending a repainting warning. Cause it calculates values in a different timeframe. But thats normal and it wont recalculate results.
We sell this indicator so it is invite only. But of cause you can test it before buying.
If there are questions, write them into the comments or contact us directly over the direct message. Happy Trading!
Skript nur auf Einladung
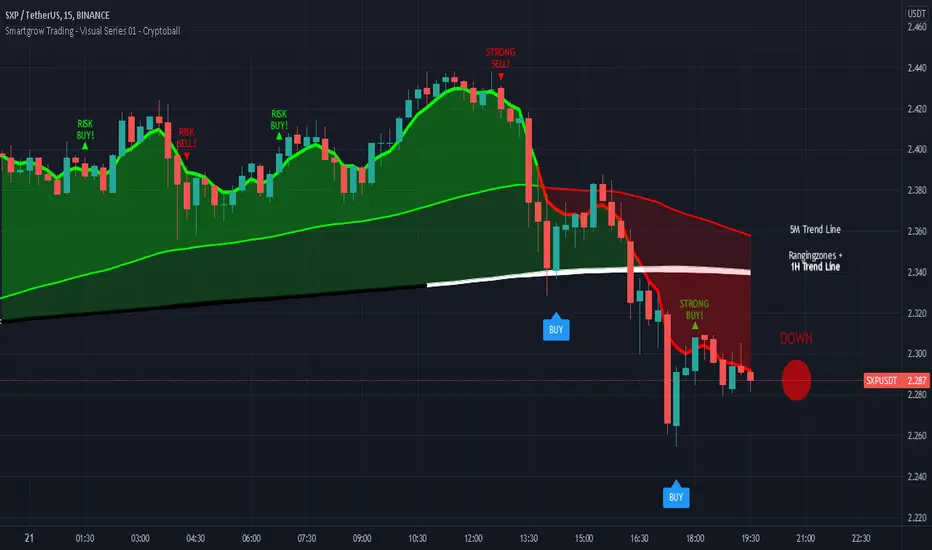
Smartgrow Trading - Visual Series - CryptoballWelcome to our Tradingview buy signal indicator with visual support.
We develop signals which have been specially developed for crypto trading bots. We will publish new indicators at regular intervals.
At the moment our all-in-one indicator includes the following indicators:
- "Crypto Bot Signal 01 - Optimized RSI Momentum"
- "Trading Bot Buy Signal 02 - MTF Stochastic"
- "Trading Bot Buy Signal 03 - MTF StochRSI"
- "Smartgrow Trading - Bearish Power Signals"
The basic idea of this all-in-one indicator is to decrease the needed number of alarms and to provide an all-in-one script for our users trading long direction only. We only include indicators which are relatively robust against false breakouts, even if these can of course never be avoided. These signals alone occur relatively rare, but you can set an alarm up on different pairs simultaneously. The strategy can only be used in 5 min chart and in crypto pairs. It wasnt tested in Forex etc. but feel free to test it.
The main idea behind the signals is to identify strong oversold areas as these have great potential to move in the other direction again. To determine this, we use custom oversold indicators to create buy signals. You could automate these buy signals but we suggest to use these instructions instead:
If an alarm is triggered it is showing points with a strong reversal chance for long signals. We recommend watching the chart closely and finding a good entry point. For visual support, we have visualized the basic trend in color on the one hand. If the 5 minute trend line is above the 1 hour trend line , then there is an upward trend which is marked with a corresponding note. If the 5 minute trend line is below the 1 hour trendline, then there is a downward trend. If you only want to look at the trend line of the 5 minute chart, deactivate the 1 hour trendline in the settings. When the 5 period Exponential Moving Average is higher then the 90 period Exponential Moving Average then the area between them is colored in green, otherwise in red. The same is the case when the 5 period Exponential Moving Average is higher then the 1 hour trendline.
As a second visual support, we have marked volatile zones in the market with the colors black and white. The color black generally denotes a market with low volatility and entry into these areas is therefore not recommended or involves risks. To show potential entry points based on market momentum we added note signs showing either buy or sell spots based on crossovers. If a crossover is within an area of low volatility we marked it as risk buy. if a crossover is within an area of higher volatility we marked it as a strong buy.
To find a good point to exit a trade we added also note signs showing possible sell spots. When these occure an crossover in momentum has allready occured and a potential trend reserval may occur. You could also use this indicator in combination with oversold indicators like RSI or Stochastic to see potential reversal spots when a market is oversold. As a last helper we implemented the Cryptoball on the right side of the chart to vizualize the currently price movement. Therefore it is looking only a few candles back to show you the smoothed price direction. When the color of the indicator is switching from green to red it is a sign that a smaller price drop may occure amd indicates a possible sell.
We sell this indicator so it is invite only. But of cause you can test the single indicators before buying.
If there are questions, write them into the comments or contact us directly over the direct message. Happy Trading!
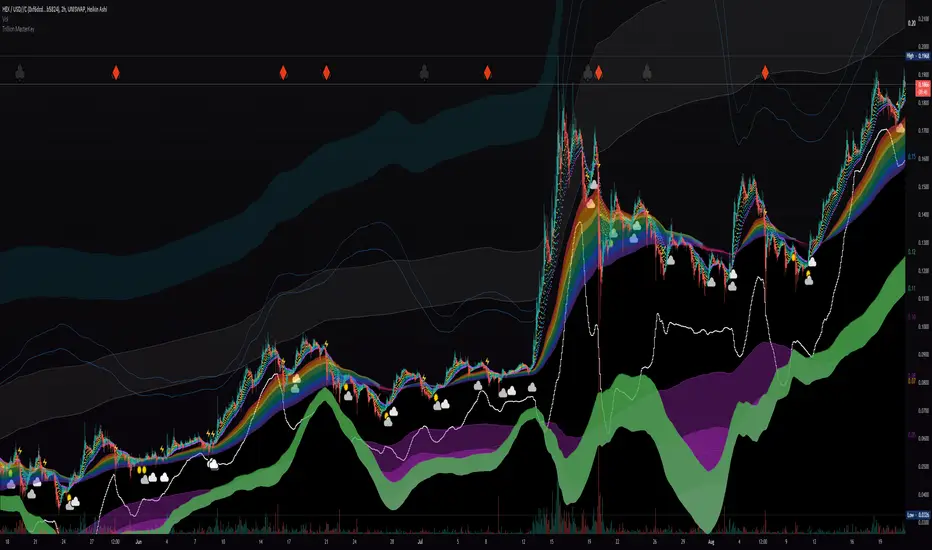
Liquidity Rainbow - Trillion ResearchThis indicator uses regression along with RSI and moving averages from multiple time frames to help you visualize the market in a single view. After learning the notations, you will be able to identify pockets of liquidity and determine high/low probability price zones without drawing a single line.
Booster symbols help confirm short term trends and breakouts based off of two waveform functions, one long period, the other with a much shorter period. You get the buy signal that everyone else sees plus the confirmation!
This is a system that is not fully developed, PNL is not available yet. Strategy version is coming soon, still back testing.
I am tuning this model for crypto specifically, although it works for anything with a price chart.
2 EMAs (configurable to MA)
Dragonskin - RGB circle plots eMA
Rainbow - RGB area plots eMA
+When you see the rainbow appear it means that the price is above the slowest ema baseline. Generally bullish as price tends to ride the rainbow. Ideally, you will see a white cloud at the origin.
-When you see white step line cutting into the upper colors of the rainbow.
Once the price has traded below the rainbow for the FIRST time, not just wicked. You can set a target that's just above the previous high bodys above the rainbow. Do not sell the dip, let the floppers flop.
The second time price cuts down through a thick rainbow is usually bearish .
What makes me so sure? Liquidity
In order to be successful, we need to understand liquidity, the juiciest pockets of profit.
I will reveal more of the strategy in the second script.
For now, use:
SUN symbol - Notice how the price always seems to come back and sweep up any SUNs that get left behind (up and down) this is a liquidity nugget
CLOUD(s) indicators of support. Meaning that on ema trend we expect a lower price but each time that happens, it gets bought up above baseline. weak->strong (little gray - light blue - white)
LIGHTNING indicator of resistance. Meaning the price is not being allowed to recover, each time it rises above baseline, it is sold down again.
YELLOW CROSS - Classically known as a whale manipulation indicator. It tends to indicate a strong bearish move incoming or the reversal of an ongoing bearish move. There's dumping. "Get ready something is happening" indicator.
HEARTS = BUY
SPADES = Buy
CLUBS = Sell
DIAMONDS = SELL
*do not use these during periods of consolidation. consolidation is a period when the price swings in both directions but not too much. In a narrow range the indicators can pop up.
Why does this happen?
Short periods, during which exchanges stabilize the prices, are necessary for the redistribution of assets over the course of trading. Sometimes they happen multiple times a week and can last 24 or 48hours. Also it is a great time to eat up algo traders and that's why you'll see noise.
You want to focus on the period immediately following a consolidations. Don't rush it, they really do take 20 hours+
If you realize that you are in one of these consolidation ranges, limit order the tips of the wicks, nothing in the middle. There is not much profit here but also there is minimal risk.
If you're confirmed in a consolidation, exchanges will work to buoy the price to the appropriate mark price even if there is a big buy/sell order. A lot of time price will go up the congruent amount afterwards to compensate the toxic vwap .
I hope this helps people see the bigger picture and become even more successful with bigger gains.
I've tested this on all the major cryptos. Bitcoin BTC Ethereum ETH HEX
Honestly, I have tested very few stonks with this, later.
-Market Enemy
RaBot V1.0.0Rabot is an indicator for new users as well as experienced users.
This indicator tries to predict both buy and sell signals. You can configure it for both scalping and swing trading.
It has two modes, one more "conservative", where the number of entries will be less than the other "greedy" mode.
Based on the famous and complex indicator "Koncorde" that combines both trend and volume knowing the manipulation of strong and weak hands, patterns, and crossing of emas customized by us; for example: a buy signal in conservative mode will only open if the trend is bullish and vice versa.
The user can configure the way they like by opening many positions or few but more secure based on their trading style.
The indicator also has the option to configure which chart we want to obtain the trend from, this is to avoid perhaps opening shorts in a very bullish trend line for example.
Rabot is a fairly complex indicator, which can be used for automatic use of inputs and outputs, as well as manual.
You also have the option of NOT opening a position if there is one currently open, and the option for the next signal to be the opposite of the last one.
5TPs, 1SL, and Breakeven after take profit achieved.
Finally version 1.0.0 is now available! :)
This version does not have backtesting (we have another that yes)
We are continuously working, testing and updating bugs and improvements.
Do not hesitate to get in touch for a feedback, it will be welcome and we will take it into account.

Volatility Adjusted Grid [Gann]█ OVERVIEW
Gann Square of 9 is one of the many brilliant concepts from W.D.Gann himself where it revolves around the idea that price is moving in a certain geometrical pattern. Numbers on the Square of 9 spiral tables, especially those lie in every 45degree in the chart act as key vibration levels where prices have tendency to react to (more on the table below).
There are few square of 9 related scripts here in Tradingview and while there's nothing wrong with them, it doesn't address 1 particular issue that i have: The numbers can be too rigid even when scaled based on current price because the levels are fixed, which makes them not tradable on certain timeframes depending on where the price currently sitting.
Heres 5min and 1hour Bitcoin chart to illustrate what i mean: Grey line on the left is based on Volatility Adjusted levels, while red/blue on the right are the standard Gann levels.
You can see that on 1hour chart, it provides a good levels (both Volatility Adjusted and the standard one happened to share the same multiplier in this case),
1Hour Chart:
On 5 min chart tells a different story as the range between blue/red levels can be deemed as to big for a short term trade, while the grey line is adjusted to suit that particular timeframe (You can still adjust to make it bigger/smaller from the settings, more on this below)
5Min Chart:
█ Little bit on Gann Square of 9 table
This is the square of nine table, the numbers highlighted in Red are known as Cardinal Cross and considered to be a major Support/Resistance while those in Blue color are known as Ordinal Cross considered as minor (but still important) Support/Resistance levels
Similarly, this script use these numbers (and certain multipliers) to print out the levels, with Cardinal numbers represented by solid lines and Ordinal numbers by dotted lines.
█ How it Works and Limitations
The Volatility Adjusted grid will go through several iterations of different multipliers to find the Gann number range that is at least bigger than times ATR. Because it's using ATR to determine the range, occasionally you'll notice that the line become smaller as ATR contracting (and vice versa). To overcome this, you can change the size range multiplier from the settings to retrieve the previous range size.
Use the size guide at the bottom left to find the multiplier that suits your need:
1st Row -> Previous Range -- Change Range Size to number lower than this to get a smaller range
2nd Row -> Next Range -- Change Range Size to number higher than this to get a larger range
Example:
Before:
After:
As you'll soon realise, the key here is to find the range that fits the historical structure and suits your own strategy. Enjoy :)
█ Disclaimer
Past performance is not an indicator of future results.
My opinions and research are my own and do not constitute financial advice in any way whatsoever.
Nothing published by me constitutes an investment recommendation, nor should any data or Content published by me be relied upon for any investment/trading activities.
I strongly recommends that you perform your own independent research and/or speak with a qualified investment professional before making any financial decisions.
Any ideas to further improve this indicator are welcome :)

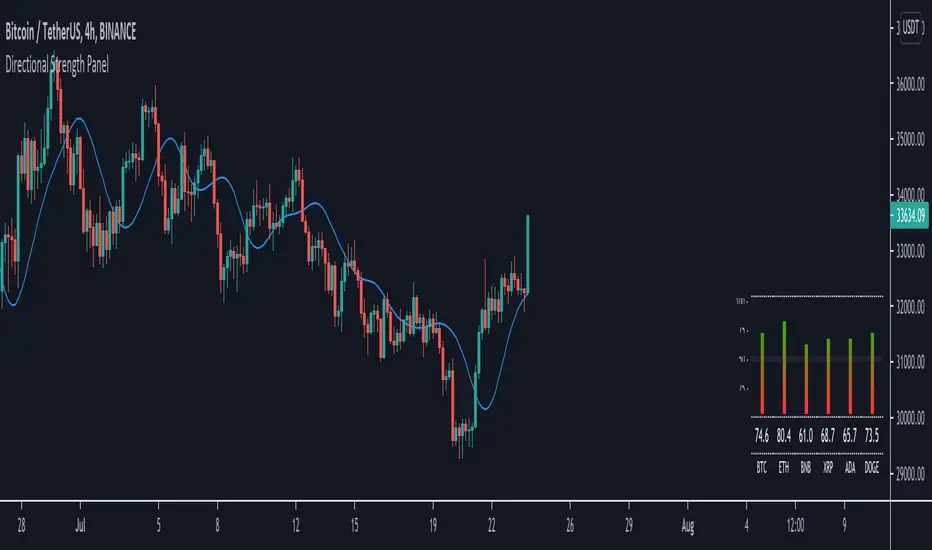
Directional Strength Panel█ OVERVIEW
The panel display trend momentum of selected coins/symbol (up to 6) based on the Arnaud Legoux Moving Average (ALMA). I'm using ALMA to measure the trend because it resolves 2 main issue of the more common moving averages, smoothing and responsiveness. By removing the minor fluctuations in price without sacrificing the responsiveness, the trend become much more clearer and easier to be measured.
In essence, as the meter approaches 100, it means the ALMA is pointing up (0 means pointing down)
█ Features
- Adjustable ALMA settings with options to turn on/off display the ALMA on current chart
- Select 6 symbols of your choice to be monitored in the settings (You have to manually update the label to display)
- Working on all timeframes
- Switch the panel color to suit background chart theme (Light/Dark)
█ Developer Notes
I'm working with table a lot lately and decided to publish this as a sample if anyone wishes to edit the script to display whatever they want. main calculation in get_data() function should be clamped to value between 0-100. As for the panel size, you can edit the row_max (currently set to 20 and 40) if you need it to be smaller or bigger (**i feel anything smaller than 16 is ugly)
█ Disclaimer
Past performance is not an indicator of future results.
My opinions and research are my own and do not constitute financial advice in any way whatsoever.
Nothing published by me constitutes an investment recommendation, nor should any data or Content published by me be relied upon for any investment/trading activities.
I strongly recommends that you perform your own independent research and/or speak with a qualified investment professional before making any financial decisions.
Any ideas to further improve this indicator are welcome :)
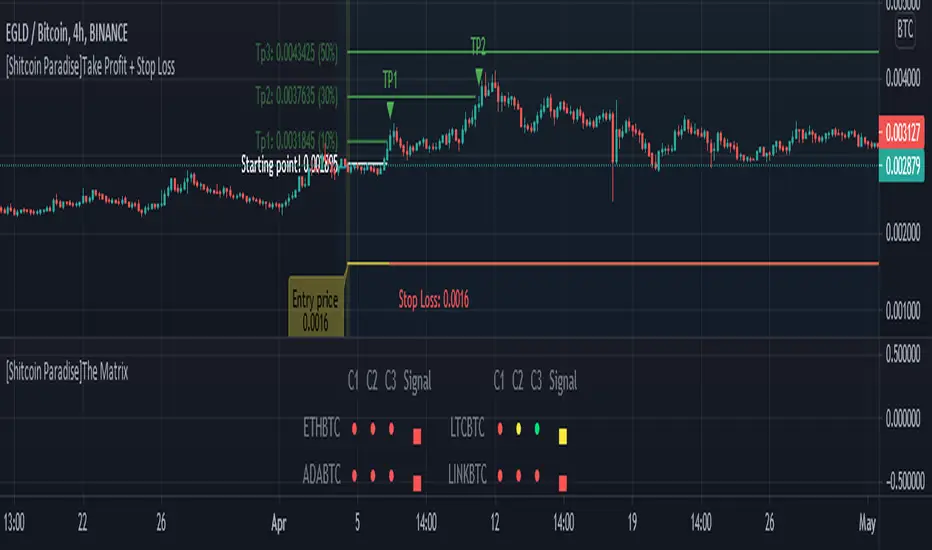
[Shitcoin Paradise]Take Profit + Stop LossThe Take profit + Stop loss indicator is built around The Matrix strategy , it is not suitable for anything else!
*Use it only on 4h charts*
How to use it:
- when a setup from The Matrix is ready, set the date and hour when that setup happened
- set the entry price
- set the targets (you can use the default ones)
- for conservative trading, check the "Use only one TP?" box
- set alert messages for every event
When the price reached the first TP, the stop loss will automatically be moved at entry price, yellow line (entry price) become red(stop loss).
The indicator can be set to have 3 take profits (it takes longer to finish a trade, the reward is greater, but also the risk is bigger), or the conservative way, with only one take profit.
The Take profit + Stop loss indicator uses 3 different stop losses in cascade, multiple algorithms and MTF to calculate them and calculate the starting point, from where the targets are calculated.
Scenario 1:
The price have a setup for continuing the trade, the price touches 1st TP, SL is moved to the entry price, the price reaches all targets => the trade is closed.
Scenario 2:
The price have a setup for continuing the trade, the price touches 1st TP, SL is moved to the entry price, the price fail to touch the other TPs and SL is triggered.
Scenario 3:
The price does not have a setup for continuing the trade, the SL is triggered.
Scenario 4 (conservative trading):
The price have a setup for continuing the trade, the price touches 1st TP => the trade is closed.
For invites, more details and questions, you can send us a private message.
Enjoy!
Shitcoin Paradise

[Shitcoin Paradise]The MatrixThe Matrix strategy is a strategy developed by @zsone and @edward_Z, that combine multiple indicators and algorithms on various time frames.
*Use it only on 4h charts*
The Matrix is built for multiple currencies/pairs and user friendly.
Features:
- possibility to choose your own crypto currencies
- setup is ready when the square from the Signal tab is green (3 green dots)
- set only 1 alert for the entire script (no need to set one alert for each pair)
- it uses multi time frames for better entries
- it uses multiple confirmations
- it have a safety net (you can set to not buy if the candle is greater than x%)
- can be easily paired with 3commas or other trading platform via webhooks
- it is user friendly, so it's ready to use/plug and play
The Matrix strategy gives setups for entries, after that you can set your own exits (take profit, stop loss, trailing stop...), or you can use our Take Profit + Stop Loss indicator , which is built for The Matrix.
For invites, more details and questions, you can send us a private message.
Enjoy!
Shitcoin Paradise
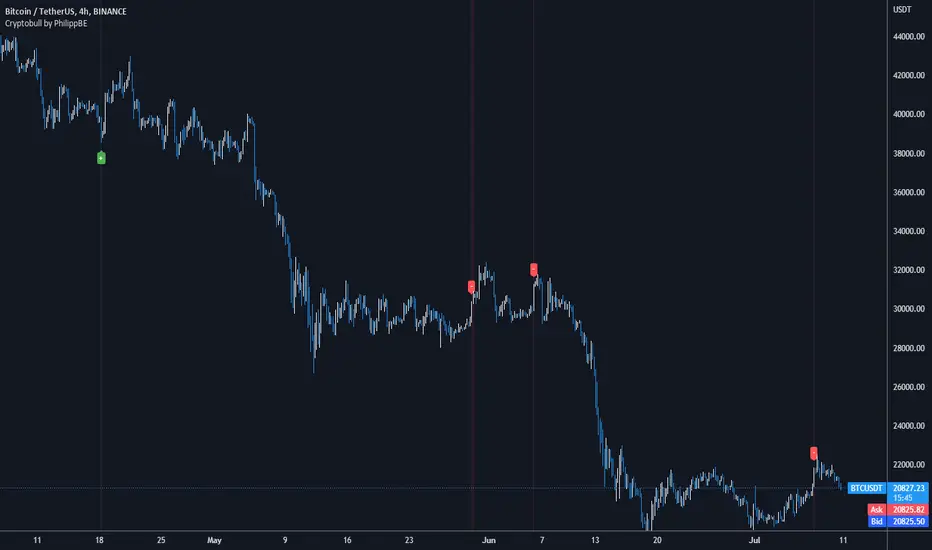
Cryptobull | Long / Short IndicatorCryptobull is a indicator based on the Williams R and Bollinger Band to find Long / Short entries (together with your strategy).
!!! The indicator is not working in every market situation -> so i recommend to add the indicator to your existing strategy !!!
Designed for:
->15m Chart
->5m Chart
->Crypto
->(Stocks)
I recommend using this indicator with Price Action or your own strategy to enter trades.
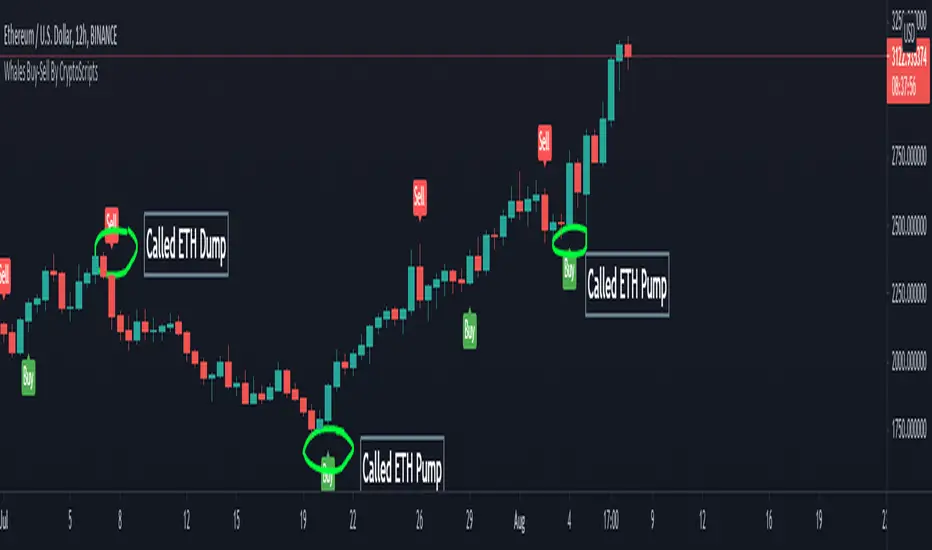
Whales Buy-Sell By CryptoScriptsThe Whales Buy-Sell indicator is very unique because it uses a combination of the smoothing range, average ranges, and hi-band/low-bands combined with various moving averages to nail whenever the overall trend is changing. This is extremely important during periods of high volatility and large moves. It helps to keep someone in a trade longer and get out fast if the trend is changing. The big caveat I can stress is waiting until the candle closes so that you know the signal is confirmed! Use the Bar Replay feature to further understand the intricacies of how the indicator produces signals. I find it is better on larger timeframes (1h and higher) because it's measuring larger trends. It can still be used on smaller timeframes but may not be as accurate. The big shortcoming is that is doesn't do well in choppy environments (i.e barely any price movement up or down) and you may get a lot of back and forth buy/sell signals so PLEASE keep that in mind. Experiment with various tickers/timeframes and see what works best for you :)
This indicator is a trend analysis indicator. Trend analysis is a technique used in technical analysis that attempts to predict future stock price movements based on recently observed trend data. Trend analysis is based on the idea that what has happened in the past gives traders an idea of what will happen in the future, but that is NOT always the case! Past performance is NOT indicative of future returns. There are three main types of trends: short-, intermediate- and long-term. Trend analysis tries to predict a trend, such as a bull market run, and then ride that trend until data suggests a trend reversal, such as a bull-to-bear market.
Alerts
You can set alerts for either a 'Buy Signal' or 'Sell Signal'. I recommend setting alerts for the candle close so that you know the signal is confirmed! If the "Add Alerts" option is greyed out for the indicator, just refresh your tradingview page and you should be able to see it :)
PM me to obtain access and please let me know if you have any questions!
3x EMA fast, 3 x MA slow + BB + PsarThis is a trend system which combines multiple fast EMA + mulitple slower SMA together with bollinger band channel and PSAR.
For entry rules the ones that I use are:
Long
We are inside BB channel, psar is ascending, and our close is above all moving averages or below all EMA'S + 1 SMA
WE can exit either when our close is below all EMA's or when PSAR is descending or when we hit upper/lower BB levels
Short
We are inside BB channel, psar is descnending, and our close is below all moving averages or below all EMA's + 1 SMA
WE can exit either when our close is above all EMA's or when PSAR is ascending or when we hit upper/lower BB levels
If you have any questions, let me know

RSVP Extractor By CryptoScriptsThis indicator has the same alerts as the VP Extractor except I overlaid the RSI on top of it (yellow line) to help take advantage when the RSI is overbought/oversold while also being able to see what the VP extractor is saying :)
It highlights yellow any time the RSI is below 30 (potential buy signal) and highlights orange anytime the RSI is above 70 (potential sell signal). You can also adjust the settings so that it'll highlight yellow when RSI is below 25 or 20 etc. so you can pick whatever value you want and the colors will adjust accordingly :) You can also set alerts for RSI overbought/oversold!
Please see the VP Extractor Alerts below! Those are still the same as before but since I now have RSI then you can be more confident in your signals if RSI is flashing a yellow shaded area (oversold) and the VP extractor is flashing a rocket symbol (buy), then both together would be a very strong buy signal. Using the RSI signals with the VP Extractor signals below will make you VERY successful with this indicator :)
The VP Extractor signals is a combination of the Volume Extractor and Price Extractor. There was a lot of coding involved in this one and it involves a Volume / Price Oscillator derived from various volume /price metrics combined with Bollinger Bands and Overbought/Oversold levels. This indicator is unique because it not only measures the standard deviations whenever the oscillator crosses outside the BBs but it does so at ranges that are most advantageous for the trader to identify KEY buy/sell levels (as shown above). I'll break down each signal below and how to best take advantage of them so you can get the best entries and capture the most profit per trade.
*This indicator works best on the Binance or Bybit exchange for crypto but also works for stocks and forex. It's best used on small-medium timeframes such as the 15min, 1h, 4h, 8hr, or 12h. It tends to give more false signals on the 1D timeframes and higher.
Red Alarm - this signal indicates that the volume and/or price oscillators are overbought and/or crossing outside of the bollinger bands . This is a STRONG sell signal but should still be combined with support/resistance levels and confirmed with other indicators.
Red Diamond - this signal indicates that the volume and price oscillators are crossing outside of the bollinger bands above the 20 level but is not yet overbought. This is a potential sell signal but should still be combined with support/resistance levels and confirmed with other indicators.
Red Shaded Area - this indicates the volume and price oscillators are overbought. This is a potential sell signal but should still be combined with support/resistance levels and confirmed with other indicators.
Rocket - this signal indicates that the volume and/or price oscillators are oversold and/or crossing outside of the bollinger bands . This is a STRONG buy signal but should still be combined with support/resistance levels and confirmed with other indicators.
Green Diamond - this signal indicates that the volume and price oscillators are crossing outside of the bollinger bands below the 20 level but is not yet oversold. This is a potential buy signal but should still be combined with support/resistance levels and confirmed with other indicators.
Green Shaded Area - this indicates the volume and price oscillators are oversold. This is a potential buy signal but should still be combined with support/resistance levels and confirmed with other indicators.
Input Options
Show 80 Levels - This checkbox will create a red zone and green zone for the 60-80 levels on the indicator. This is useful if the volume and price oscillators reaches one of these levels, you can be sure it's going to reverse soon and can have more confidence if it crosses outside of the BBs in addition to that.
VEO Length - This changes the height of the oscillator and will change how your signals flash (more or less often). Use this if you find you're getting too many signals or not enough. I find this is best at 21 but feel free to test out what works for you depending on your timeframe.
Moving Average Volume Source - This is currently set to None but you can change it to Exponential, Hull, or Simple moving average . I found that None works best but feel free to test out the different options.
Moving Average Length - Changing this length will do nothing to your chart if None is selected for the Moving Average Volume Source, therefore you will most likely keep this setting default at 9.
Alerts
I've set alerts on this indicator for each icon (Red Alarm, Red Diamond, Overbought, Rocket, Green Diamond, Oversold). I HIGHLY recommend setting the alerts for Candle Close so that you can be sure the signal is confirmed.
You may notice that the indicator can give multiple signals back-to-back or be overbought/oversold for multiple candles. When this happens, it's best to look at other indicators such as the RSI , MFI Pro, etc to nail the best entry and have confluence with your decision. With that said, having multiple signals back-to-back can also be an indication that the move is close to happening.
This indicator is a strong indicator by itself but works best when combined with my other indicators just as the Whales Buy-Sell and the MFI Pro as well as the RSI , and MACD i.e taking a trade when all indicators are showing overbought, "Buy", "Sell", etc. Measuring volume and price action is an extremely important aspect of trading and one I believe should not be overlooked. I hope I made everything as clear as possible and please let me know if I didn't.
PM me to obtain access and please let me know if you have any questions! :D

Bjorgum MTF MAScope:
Up to 3 MA's can be applied at the users discretion
Choose between 10 different average types including favorites from the Bjorgum series from HEMA to Reversal T3's
Each MA can be independently set
Go Multi-timeframe! Any MA can be set to any timeframe of reference you choose (ex. using 3 different timeframes of higher resolution to your chart reference to establish a multi-time frame trend)
RSI HEATMAP. Use the bar color or the MA color selection toggle to set your color to reference RSI on a gradient. This helps to establish clear visual reference to momentum on top of trend analysis
Assigning RSI bar color to an MA of a higher time frame can allow you to see visual reference of momentum of the greater trend that may be at play.
Example: trying to get short on a 15min while your 1hr and 4hr RSI Heatmap burns deep in oversold.
RSI color can be assigned to the bar color, the MA (1,2 or 3), or both. Alternatively, bar color can be assigned to a more simple rising/ falling MA color and price above/ below the MA for bar color.
ALL MTF FUNCTIONS ARE NON_REPAINTING.
The Idea
The original inspiration behind the script came from an observation of a constant struggle of Pinecoders of both youth or experience to find accurate multi-timeframe indicators that do not repaint, and appear as should on historical bars, while performing reliably in real time. I encourage you to scroll the Pinecoders FAQ on a recent piece explaining the difficulties and caveats of different approaches, but I would like to reference the elimination of the historical bar offset for THIS purpose. MA's are based on closing prices, that is to say they are confirmed and will not change once the bar has closed. There is no need to offset these for historical reference. The purpose of the historical offset is best exemplified, for example, with an intraday strategy involving daily breakouts. Let's entertain going long on a break to a new daily high. We would not know that in real time so we need to reference the previous bars close for BACKTESTING purposes, otherwise we get "lookahead bias". There is no shortage of strategies unintentionally employing this bias out there (I'm sure you have come across them with their unrealistic results).
There is no worry of repainting with the MTF security function included within this script, nor will it offset for something involving lookahead bias. I encourage those that are playing with the code or perhaps writing strategies of their own to borrow the functions within. There is also a function that will return the 10 MA variable selection - yours to keep.
With all that in mind, I wanted a practical script that is easily deployable in everyday trading for the average trader that gives the user a firm grip on their trading steering wheel equipped with the feel of the road. Incorporating several MA's of differing times with the RSI heatmap gives a good visual reference and feel to your trading environment, while offering a level of customization that will fit an individuals personal trading style. The RSI heatmap gradient is per percentage between 30 and 70 and your 2 colors - anything outside of those levels gives you the vibrant bias color
Below I walk through 2 examples of live trades scenarios I made using the mindset the script offers.
The Trade
LONG IZEA
Timeframe: 4hr chart
- 3 Tilson MA's of varying length are deployed at varying intraday time frames
- A bullish pattern in an uptrend offers a possible trade allowing entry from a low risk point from the pattern low
- See the chart for notes and observations using the script
- Notice how the heatmap brightens up as price extends far away from the averages - your risk has elevated for a new position
- Notice the heatmap cool off while price action consolidates sideways
The Trade
SHORT BTCUSDT
Timeframe: 4hr chart
- 3 EMAs are employed - same length (50), with 3 successive timeframe resolutions
- A downtrend is formed with a sharp move to stack the EMAs into layers
- A pull back opportunity presents itself in bearish consolidation
- Notice a Doji star at resistance establishing a swing high as RSI cools off into the EMA dynamic resistance for entry
- An '"equal legs" measured move can be used for a trade target with a stop out above the swing high.
- Again, take note of distance from EMA's, the heatmap in combination with trend development surrounding the MA's
These were just two ideas to show you an example of how to implement some strategy into your trading and to get some interesting use from the indicator. Hope you enjoyed the read and happy trading.

Compare Crypto Bollinger Bands//This is not financial advice, I am not a financial advisor.
//What are volatility tokens?
//Volatility tokens are ERC-20 tokens that aim to track the implied volatility of crypto markets.
//Volatility tokens get their exposure to an asset’s implied volatility using FTX MOVE contracts.
//There are currently two volatility tokens: BVOL and IBVOL.
//BVOL targets tracking the daily returns of being 1x long the implied volatility of BTC
//IBVOL targets tracking the daily returns of being 1x short the implied volatility of BTC.
/////////////////////////////////////////////////////////////////
CAN USE ON ANY CRYPTO CHART AS BINANCE:BTCUSD is still the most dominant crypto, positive volatility for BTC is positive for all.
/////////////////////////////////////////////////////////////////
//The Code.
//The blue line (ChartLine) is the current chart plotted on in Bollinger
//The red line (BVOLLine) plots the implied volatility of BTC
//The green line (IBVOLLine) plot the inverse implied volatility of BTC
//The orange line (TOTALLine) plots how well the crypto market is performing on the Bolling scale. The higher the number the better.
//There are 2 horizontal lines, 0.40 at the bottom & 0.60 at the top
/////////To Buy
//1. The blue line (ChartLine) must be higher than the green line (IBVOLLine)
//2. The green line (IBVOLLine) must be higher than the red line (BVOLLine)
//3. The red line (BVOLLine) must be less than 0.40 // This also acts as a trendsetter
//4. The orange line (TOTALLine) MUST be greater than the red line. This means that the crypto market is positive.
//5.IF THE BLUE LINE (ChartLine) IS GREATER THAN THE ORANGE LINE (TOTALLine) IT MEANS YOUR CRYPTO IS OUTPERFOMING THE MARKET {good for short term explosive bars}
//6. If the orange line (TOTALLine) is higher than your current chart, say BTCUSD. And BTC is going up to. It just means BTC is going up slowly. it's fine as long as they are moving in the same position.
//5. I use this on the 4hr, 1D, 1W timeframes
///////To Exit
//1.If the blue line (ChartLine) crosses under the green line (IBVOLLine) exit{ works best on 4hr,1D, 1W to avoid fakes}
//2.If the red line crosses over the green line when long. {close positions, or watch positions} It means negative volatility is wining
