Crypto Trend Following StudyThis is the study script indicator of Crypto Trend Following Strategy which can be used to automate your trading by alerts. With study script indicator, strategy can be easily automated.
To get access to the study script indicator please contact me directly by personal message.
To back test the strategy, see Crypto Trend Following Strategy indicator.
Script is using several moving averages to keep you on the right side of the trend. Signals are also filtered based on other indicators to prevent buying already overbought or selling already oversold coins and avoid ranging markets.
MAIN GOAL
Main goal of the strategy is long-term stable profit. No strategy has 100% accuracy therefore there always will be some false signals. But patience pays, with Trend Following Strategy, you will get couple of small loses while waiting to get big wins when coin is trending strongly. As you never know the right time you must sustain and be in all trades to make sure that you will not miss the big move.
BACKTEST
This script is for free to play with so you can back test and see for yourself how the strategy performs on any of your favourite coins.
Strategy is optimized and back tested for USDT and BTC pairs on 6h timeframe but it can be used on any pair and any timeframe.
RISK & REWARD
Strategy does not use safety orders as DCAs usually leads to bag holding sooner or later. It does not use take profit either as strategy will tell you when to buy and when to sell based on the actual market condition.
You should always use stop loss to protect your account from drawdown or even being liquidated.
You can change stop loss or take profit as you like or even back test the strategy with your preferred settings to find what suits you best.
STUDY SETTINGS
Important: Make sure that you use the same settings for both Strategy and Study indicators.
If you need any help with settings do not hesitate to ask. I would also appreciate any feedback and ideas how to improve the script.
==== Indicators settings ====
RSI Long < and StochRSI Long <
• used to filter out buy signals of already overbought coins - ( stoch ) RSI must be under set value to fire a BUY signal
RSI Short > and StochRSI Short >
• used to filter out sell signals of already oversold coins - ( stoch ) RSI must be over set value to fire a SELL signal
ADX >
• used to filter out buy or sell signals in ranging markets - ADX must be over set value to fire a BUY or SELL signal
MA Fast and Slow Length
• Two moving averages to indicate an actual short-term trend
Baseline Length & Type
• Baseline is a moving average which confirms the longer-term trend. You can set length and type of the moving average
Show every signal
• turn on to see signal on each candle whether strategy recommends opening long or short trade (green triangle – buy, red triangle – sell, no triangle – wait)
加密貨幣

Smoothed Pivot Reversal Alerts [QuantNomad]This is study with alerts for my "Smoothed Pivot Reversal Strategy". Strategy script is open to the public so you can use it freely.
When creating alerts - choose "Once Per Bar Close"
It's a pro indicator, you can have access to it for a small fee. Link to my PRO indicators you can find in my signature.

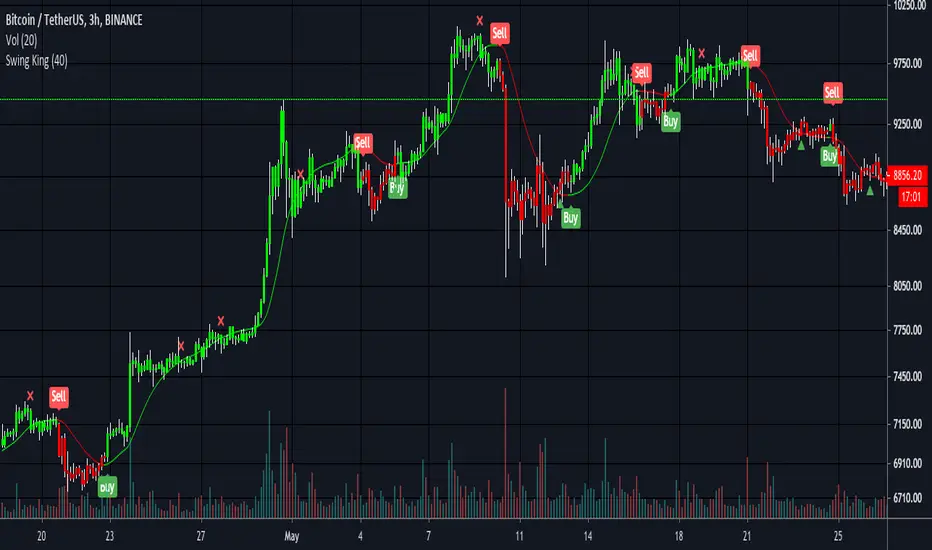
Swing King v1Utilising short and medium term trends, Swing King is perfect for riding the crypto waves. Built with the aim of smashing Bitcoin’s buy and hold return. After 5 months (Jan 2020 to May 2020) of testing and tweaking, Swing King is ready for release.
Setup with default Bitcoin settings, Swing King returned 289% in the 5 months of testing compared to buy and hold return of 29%. That’s by longing and shorting 100% of equity at 1x leverage.
Results of 5 months of testing:
1 bitcoin → 3.02 bitcoin
$7,340usd → $28,589usd
Backtesting on Ethereum had similar results. In 6 months it turned 10 eth into 14.5 eth and doubled the bitcoin value - compared to a buy and hold value of 31%.
These results were achieved with:
- Using 0.2% fees and slippage for worst case scenario
- Not using Heiken Ashi candles to fake backtest results
- No stop loss and 30% long take profit
Expect to be in trades for days and keep your losses small while letting the winners run.
Also includes trend weakening signals for manual take profit zones (cross is bullish trend weakening and triangle is bearish trend weakening) and colour coded barcolours to keep trading simple.
Green = all signals met to long
Red = all signals met to short
DM for access and pricing. Places will be limited.
Tradespot Trade PanelCryptocurrency based TA panel.
Features
- In depth trend analysis
- Momentum analysis
- Alt coin risk management
- Technical sentiment at a glance
- Much more coming as we iterate and update this panel over time

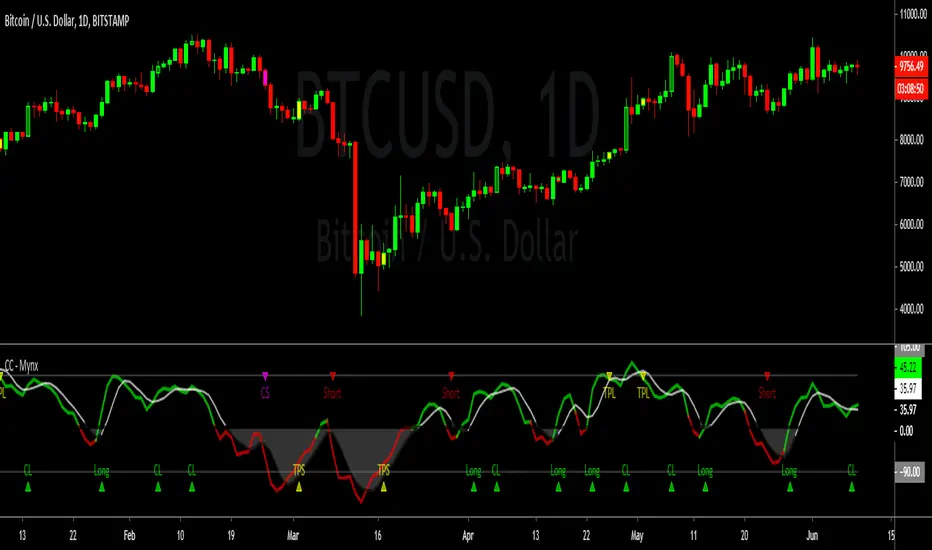
Cracking Cryptocurrency - MynxCracking Cryptocurrency - Mynx
Mynx is a powerful trend-following indicator which logic built in to facilitate nuanced aspects of PTP strategy. Continuation Trades, Early Exit Signals and Full Take Profit Signals are all built into Mynx. Mynx is designed to identify when the market is signaling that a trend is beginning as well as signalling when you may safely re-enter into a pre-existing trend. It also tells you where to exit prematurely to avoid significant capital loss on a losing trade, and when to take full profit in order to get out of a position at maximum profitability.
Should you have difficulty adding it you can search for 'Cracking' in the indicator window of your Trading View Platform, and it will appear along with the rest of our indicators.
As you will notice, Mynx is similar in nature to Time Transformation, in that it is both a Centered Oscillator and a Line Cross Indicator. This allows a wide range of possibilities which we will exploit to extract profit out of the market.
The most important line is the BPM or Mynx Line. This is going to be the thicker, brighter colored line on our indicator that will switch from green to red depending on the dominant trend. The color changing feature of this line will denote where our indicator is in relation to our zero line. If our BPM Line is green, then price is trading above our zero line, if red than it is trading below. Therefore we can quickly see what our last signal was, and whether our indicator is bullish or bearish depending upon the color of our BPM Line. If Green, we are in long territory, if red we are looking for shorts.
Our second area of importance in this indicator is our Noise Line and Area. This is the black or white line which will change color depending on where Noise is relative to our zero line. Black if above the zero line, meaning we are in long territory, and white if below, indicating we are in shorting territory. The area between the zero line and the Noise Line is shaded black or white as well, and denotes no-trade zones for us. If our BPM Line is within our Noise Area, we are not in a trade. We are only in a trade when our BPM Line is breaking away from Noise Line, either to the upside or the downside. When BPM curls back and re-enters our Noise Area, that is an indication to exit our position regardless of our Take Profits or Stop Losses.
Our Zero Line is indicated by a thick black line for easy of identification, which will be our primary signal generator when our BPM Line crosses above or below it, and our faint gray lines are going to be our Overbought and Oversold levels respectively. These will play a function in how we take profits.
Settings
Let's take a look at the settings of our Mynx Indicator.
The first field we will see is our BPM Source, how many beats per minute we want in our cycle length. The default is ten, and through back-testing I find this to be the optimum level.
Our Noise Filtration level corresponds to our Noise Line and Area. Again, I find the default settings as I have programmed them work best on all time frames, however you might find optimum signals by playing around with these settings. As in all things, nuance and experimentation is what excellence is borne of.
We can adjust our Oversold and Overbought Parameters, making it easier or harder for us to get a Full Take Profit Signal from this indicator. We can also adjust our Base Line. Keep in mind, our Base Line is going to be an Exponential Moving Average and here we can adjust the length of our desired Base Line.
To incorporate our Multi-Time Frame feature, below this section we can see that the default option will be to use a Base Line of the current time frame. If however, we want to trade on a Lower Time Frame and reference a base line of another time frame, we can simply un-check that box and input the desired Time Frame of the Base Line we wish to reference.
Now for the true appeal of Mynx in user friendliness, below this we can see that we have full control of the signals we want Mynx to generate for us. By default, we have enabled Mynx's best signals, Trending Signals. We can choose to plot Continuation Crosses and Reversals Within the Trend, both of which are trades we are allowed to take and I recommend taking in a proper PTP system. We can choose to use Mynx as a reversal indicator, to plot Raw Reversals against the trend, which I do not recommend enabling unless you want to by pass PTP entirely. We can choose to plot when Mynx gives us a Full Take Profit signal, a signal to take full profits on our position. We also have the option to plot for early exits. The Option for Sensitive Stop Loss is the same as early exits, and will plot an exit signal every time the BPM Line drifts back into the Noise Area. These are fairly easy to see upon bar closes, so I left it disabled by default. If you enable it you will get a visual signal to exit your position upon a bar close.
One final note, we can adjust the source upon which Mynx is basing her signals. By default, this value is hl2 , which I found in back-testing to be the most efficient with minimum draw down. However, there is a higher profit potential with HLC3 and OHLC4, but be warned that with that extra profit potential comes the risk of more draw down. The draw down settles out in the end, however there will be months where you drastically under perform Alpha, where as hl2 keeps you consistently outperforming the market at all times. This is a very personal choice, and I leave it upon you to make the right one.
In our Style Tab, we can adjust our Color Scheme to better accommodate the way that you trade. I have done my best to be very concise and detailed in labeling to make this task easy.
Strategy
Please let me know of your success stories with Mynx, as well as any features you think would be helpful to add. If you notice any errors within it, please notify me so I can fix them. I have back-tested this strategy many times in many different settings, and it consistently outperforms the market and generates Alpha. I now place it within your hands to achieve the same results. Trade Safely.
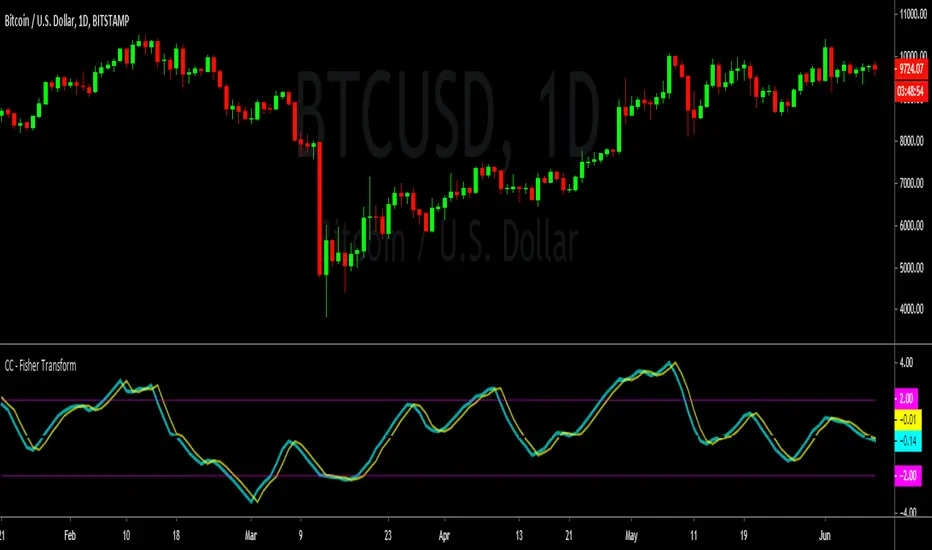
Cracking Cryptocurrency - Fisher TransformCracking Cryptocurrency - Fisher Transform
A modern spin on a classic. John Ehler's formulas helped transform a generation of traders from working with traditional indicators such as Stochastic and moving average filters to applying frequency and wave theory to their price chart analysis. There are few tools as powerful as Ehler's Fisher Transform , which transforms the behavior of price in a Gaussian Distribution, or a Normal Probability Distribution. This allows us to attain a bell curve of price, with our outliers clearly and objectively identifiable as well as accurately indicate trend direction by bisecting our wave into peaks and troughs.
Features & Functions
Simple and Clean. Only the data you want, no unnecessary information cluttering your work flow.
Adjustable Sources. Select which data source you want to compile your data from from an easy drop-down menu.
Adjustable Triggers. Standard versions of the Fisher have been unable to innovate on the Trigger Line, a vital part of utilizing this to generate trade signals and setups. In this version, choose and adjust your own Trigger and Smoothing Filter based on tried and true implementations.
Adjustable Thresholds. Most versions of the Fisher do not truly allow the customization of the algorithm to suit the asset you are analyzing. All thresholds in this version are fully adjustable to customize this indicator to work for you, not against you.
---
Purpose
To remain true to Ehler's original vision of the Fisher Transform while providing traders a functional and efficient indicator with modern innovations and conveniences.
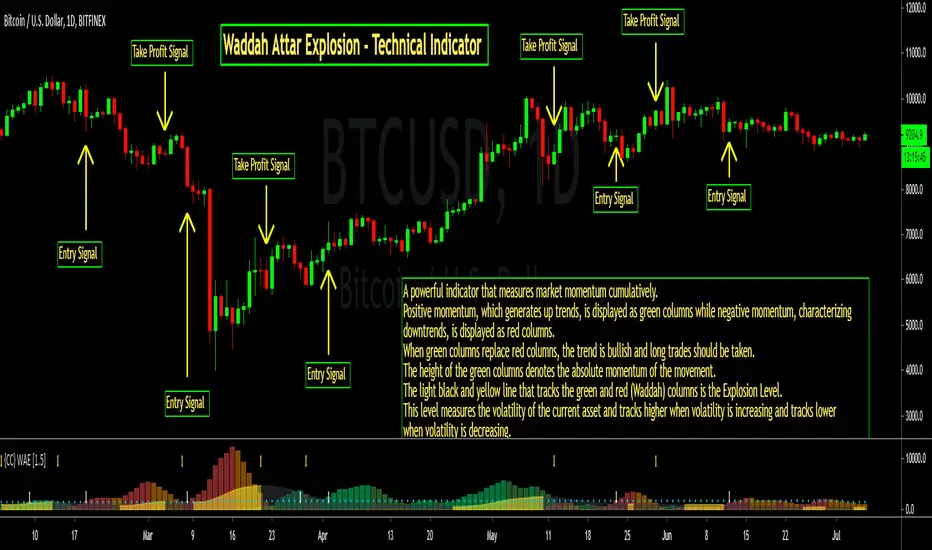
Cracking Cryptocurrency - Waddah Attar Explosion Cracking Cryptocurrency - Waddah Attar Explosion
An entry indicator that analyzes momentum and volume . This indicator is very sensitive and works very well on lower time frames for scalping, and higher time frames for confirming explosive movements or shifts in trend or rising directional momentum in the market.
This indicator can be used as an Initiator, Confirmer, or Vol. Filter. It's multiple components make it an extremely effective tool in any trader's tool belt.
Features & Functions
This indicator can be customized by adjusting the sensitivity levels, lengths, and multiplier. However, I find that the settings that I have made as default work very well. However, as with all indicators, nuance and customizing your settings to your asset class and time frame will yield greater results.
False Positive Filter - Enabling this, as it is by default, will dramatically change this indicator's sensitivity. This is designed to analyze long-term momentum and reduce the occurrence of "false positives". However, the trade off will be reduced reaction speed.
Entry Strategy - Print alerts and trading signals for many different permutations of entry strategies available with this indicator. Explosion Level Crossovers, Color Flips, Rising Explosion Level Cross, and Rising Explosion Level.
Exit Strategy - Print alerts and trading signals for many different permutations of exit strategies available with this indicator. Explosion Level Cross, Receding Delta, Color Flip, Falling Explosion Level.
Bar Coloring - This indicator colors the bars to indicate a buy or sell signal, as well as printing Up and Down arrows in the indicator pane itself. This can be disabled in the settings window.
Alerts - This indicator is programmed with Buy and Sell alerts, available from the Alerts Window.
---
Purpose
To identify likely turning points in the market, the existence of powerful momentum to confirm a directional bias, or the introduction of high volume or volatility into the market.
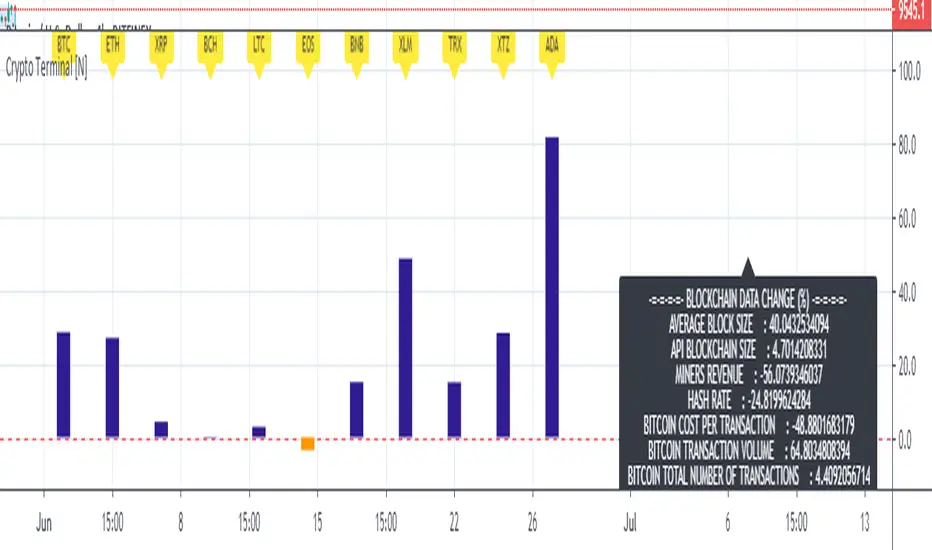
Basic Cryptocurrency TerminalHello,
This script is a simple Cryptocurrency Terminal.
It serves the same purpose as Heatmaps.
You can also set the period to look back manually in the menu.
Major Cryptocurrencies are taken into account.
And various Blockchain data are shown in the information panel.
In this way, an idea can be obtained about Cryptocurrency Market.
It is visually more convenient and clear to use in an indicator window under the chart, not on the chart, as follows:
Regards.
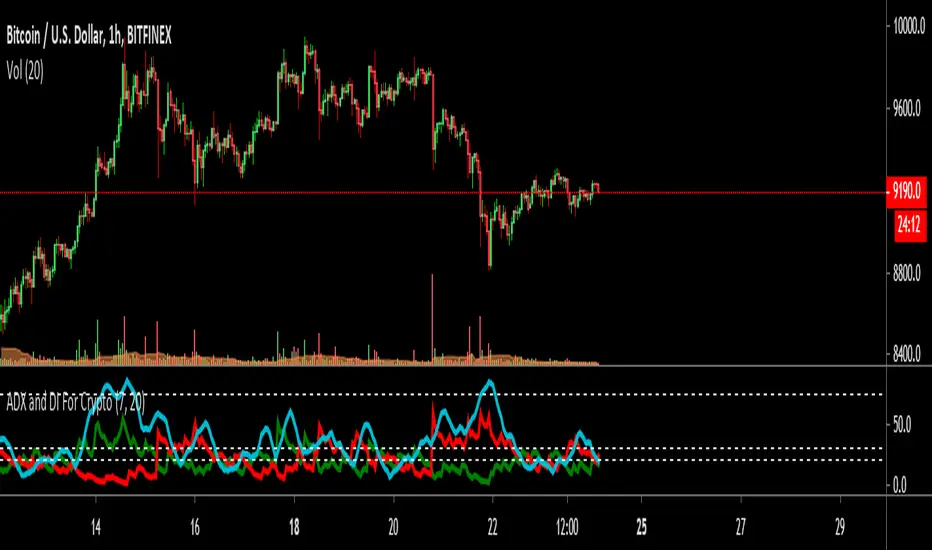
ADX and DI For Cryptocustomized version to add my favourite settings for crypto
Best time frame is daily followed by 4H
ADX Near 20 or less means trend is choppy and weak
ADX Cross over 30 means trend is starting to gain momentum
ADX Near 75 means momentum is near maximum, trend needs to rest for a while ( The area between 70~90 )
Musashi-Hidden-Wave Trading SystemThis Indicator is a full trading system that offers setups with Entries and Targets and Trade Management. This indicator is very accurate because it uses advanced setup detection and filtering logic.
The setup is triggered if the price passes the blue dash. Do not enter the trade unless price passes the blue dash. Each setup has 3 possible targets, which are dashes colored green for longs and red for shorts.
You can use the baseline (which is a trend-line that is either green for bullish or red for bearish ) to manage the trade. You should only enter long trades if the trend-line is green, and only enter short trades if the trend-line is red. One strategy would be if you enter a trade long, and reach the first target, you can take some profits, but still let the some of the position run, where a bar closing beyond the baseline or breaks a prior opposite pivot, would stop out your remaining position.
To summarize:
Blue Dash = Entry Trigger
Green Dashes = Long Targets (3 of them, for different price targets: target 1, 2 and 3)
Red Dashes = Short Targets (3 of them, for different price targets: target 1, 2 and 3)
The great thing about this indicator is that its universal, there are no settings necessary -- just put it on the chart and it finds high probability setups and paints it on the chart as they occur. There is NO Repainting with this indicator.
Of course, you can add other indicators if you wish, and even add this indicator to your existing trading system.
Again, this indicator does NOT repaint.
Once a setup is found, the indicator draws the entry trigger price and the targets at the setup bar close.
Setup Alerts are fully supported, via email, sms , and desktop notification.
*If you wish to license this indicator, please contact me via private message for details regarding access. Thank you.
LEGAL STUFF:
Risk Disclosure
Futures , forex, stock, crypto and derivative trading contains substantial risk and is not for every investor. An investor could potentially lose all or more than the initial investment. Risk capital is money that can be lost without jeopardizing ones’ financial security or life style. Only risk capital should be used for trading and only those with sufficient risk capital should consider trading. Past performance is not necessarily indicative of future results
Hypothetical Performance Disclosure
Hypothetical performance results have many inherent limitations, some of which are described below. no representation is being made that any account will or is likely to achieve profits or losses similar to those shown; in fact, there are frequently sharp differences between hypothetical performance results and the actual results subsequently achieved by any particular trading program. One of the limitations of hypothetical performance results is that they are generally prepared with the benefit of hindsight. In addition, hypothetical trading does not involve financial risk, and no hypothetical trading record can completely account for the impact of financial risk of actual trading. for example, the ability to withstand losses or to adhere to a particular trading program in spite of trading losses are material points which can also adversely affect actual trading results. There are numerous other factors related to the markets in general or to the implementation of any specific trading program which cannot be fully accounted for in the preparation of hypothetical performance results and all which can adversely affect trading results

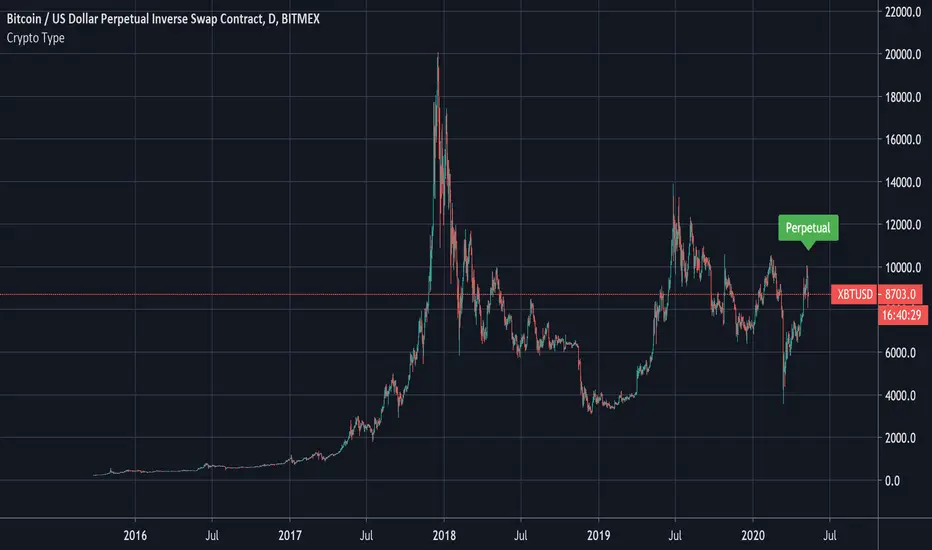
Crypto Type: Regular, Perpetual, Or Futures?A simple way to find out if the security in question is a regular, perpetual, or futures pair.
This reads the data of the security's description and sees if the word perpetual or futures is mentioned.
The method to check if a string has the letters we seek was first introduced by MichelT .
Thank you for checking this out and I hope this helps unlocking new hidden potential.
Cryptocurrency Top10 IndexThis is so called TOP10 Cryptocurrency Index. Automatically calculated from ten of biggest crypto pairs to USD: BTC, ETH, XRP, BCH, BSV, LTC, EOS, XTZ, XLM, XMR.
So far all pairs came from one exchange: Bitfinex. In the future I will add one or two more.
It is coded as Indicator, but you can make it full screen by double-click into its background.
This script is invite-only for the members of our trading group (info in signature).
Polish description:
----------------------
Niniejszy skrypt stanowi sztuczny twór imitujący indeks jednych z dziesięciu największych kryptowalut w parze do USD: BTC, ETH, XRP, BCH, BSV, LTC, EOS, XTZ, XLM, XMR.
Na początek wszystkie pary pochodzą tylko z jednej giełdy: Bitfinex. W przyszłości dodam jedną lub dwie giełdy więcej.
Skrypt jest zaprogramowany jako tzw. wskażnik/indicator ale możesz powiększyć go do pełnego ekranu, klikając dwukrotnie w tło skryptu.
Nardzędzie jest publikowane na zasadzie invite-only(konieczność przydzielenia dostępu na TradingView), a zatem dostępny jest tylko dla aktywnych użytkowników naszej grupy traderskiej, do której link można znaleść w mojej sygnaturze poniżej.

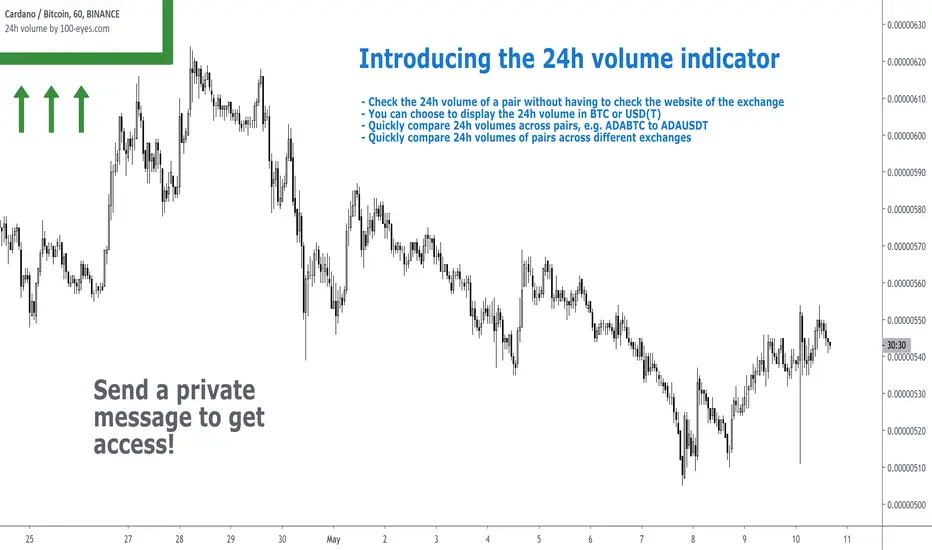
24h volume by 100eyesIntroducing the 24h volume indicator on Tradingview!
DM me (Trading-Guru) here on Tradingview to get access to this indicator.
100eyes asked me to create a new Tradingview indicator that estimates the 24h volume of a pair. Works for all BTC/USDT/USD/ETH crypto pairs. You can choose to display the 24h volume in BTC or USD(T).
This indicator allows you to:
Check the 24h volume of a pair without having to check the website of the exchange
Quickly compare 24h volumes across pairs, e.g. ADABTC to ADAUSDT
Quickly compare 24h volumes of pairs across different exchanges
Volume is an important factor in crypto trading to estimate liquidity. Use this indicator to adjust your position size according to the volume of a pair.
Even on the website of an exchange, it's difficult to compare volume since for example volumes of USDT pairs are expressed in USDT, and volumes of BTC pairs are expressed in BTC. This indicator solves that problem by expressing everything in the same currency, and also directly on Tradingview!
F.A.Q.
Q: How do I get access to the indicator?
A: DM Trading-Guru on Tradingview.
Q: Why are there different values for different timeframes?
A: That is due to Tradingview limitations. The smaller the timeframe, the more accurate the displayed value. The timeframe you're looking at equals the maximum amount of lag.
Q: I'm on the Tradingview mobile app, why is the value is not displayed next to the indicator's name?
A: Click somewhere inside the chart. Then the indicator value will appear.
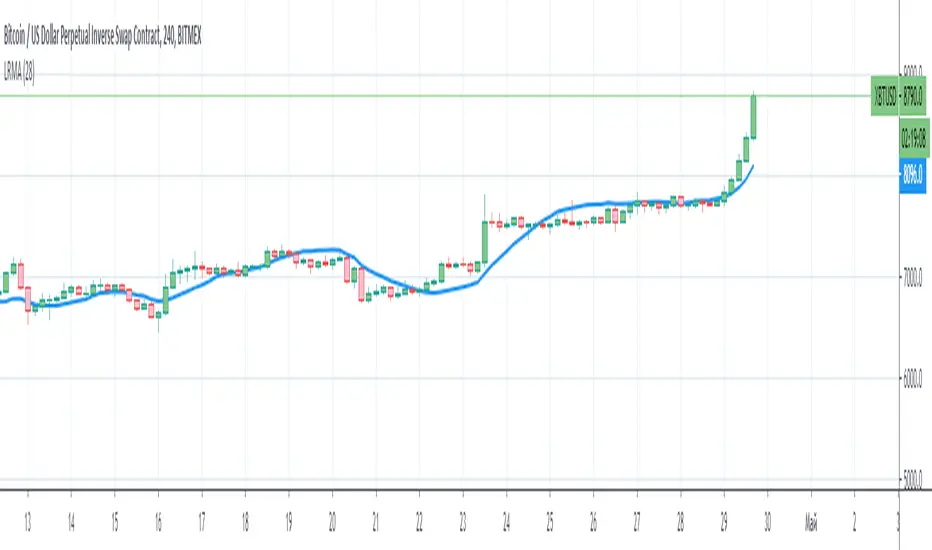
Bitcoin: Top & Bottom Mini-AlgoHere we have a mini-algorithm that tries to show absolute 4-year-cycle top and bottom zones for the case of the BraveNewCoin Liquid Index (BLX) for Bitcoin on the weekly (W) timeframe by using several oscillators as RSI, VPCI etc. employed with a custom logic. When the background gets red we might be near to a cycle peak, and when it gets green we might be near to the absolute bottom of the current cycle. Note that only absolute top/bottoms are indicated (at least since the end of 2013), so that the current strong drop in March 2020 was correctly not tagged, as it wasn't the lowest price of the current cycle.
It is best to combine this mini-algorithm with some of my boundary indicators for BLX, e.g. "Bitcoin: Price Action Integrals", for confluence . For the next peak one could then watch for the mini-algo to go red and for the price to hit the boundary. You can change the background transparency if you like to have this indicator be more unobstrusive on the chart.
For access please contact me via DM on TradingView or on Twitter (linked on my TradingView profile and my signature).

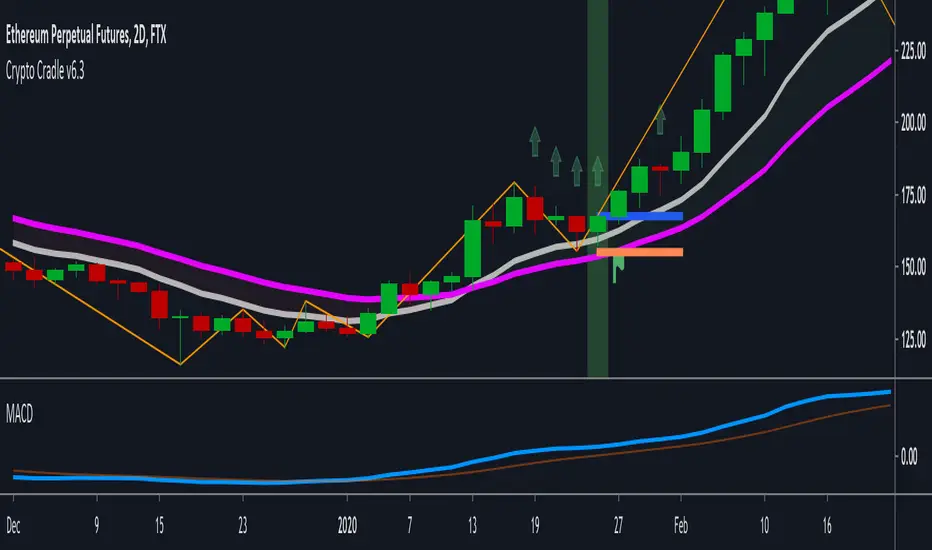
Crypto Cradle v6A long signal (green bar background) is flagged if a small bullish candle is in/around the EMA10/20 cradle.
A short signal (red bar background) is flagged if a small bearish candle is in/around the EMA10/20 cradle.
Other factors must be present such as MACD convergence and higher timeframe trend.
The blue bar is the entry. The red bar is the stop.
The strategy is designed to discretionally trade trending cryptocurrency assets.
SETTINGS:
Experiment with the zig-zag trend sensitivity (3-4 works best) to match entry timeframe trend detection.
* 'Zig Zag - Must require pullback trend' - sometimes a small bullish / bearish candle can appear in the cradle zone without a clear pullback (ie price has travelled sideways into the EMAs). Switch this on in an attempt to exclude such pull-backs.
* 'Zig Zag - Require extra trend zig' - trend is determined by a H, L, HH, HL forming (for long). Tis setting requests one more trend-aligned zig/zag (ie L, H, HL, HH, HL).
* 'Zig Zag - Show Higher Time Period Trend' - the trend sensitivity is doubled to estimate higher timeframe trend. This visualises what the algorithm has determined as the higher timeframe zig-zag pivot points .
* 'Minimum candles since outer pivot' - this attempts to exclude signals that occur after a dramatic pull-back.
* 'Entry Candle Offset Max' - how many bars to wait for entry
PROFIT TAKING:
There are many ways to take profit after entry - trailing stops, scaling out 50% at 1:1, fixed targets, fib extensions, etc. This is out of scope for this indicator.
I have included a basic 1:1 level line (dull green when enabled) and a fixed target level line ( bright green when enabled) that uses a risk/reward multiplier.
ALERT:
To create a generic alert, click the + button in the Alerts panel, select 'Crypto Cradle v6' from the first list, select 'Cradle v6 Short/Long Alert' from the second list, and select 'Once Per Bar Close'. Don't forget to add the timeframe to the message.
This indicator supersedes the open-sourced '"Crypto Cradle" trigger' / 'Crypto Cradle v2' indicator seen here:
McMillan Volatility Bands w/ Buy & Sell Signals [optstrategist]BACKGROUND
McMillan Volatility Bands are an alternative approach to John Bollinger's "Bollinger Band" study and developed by world-renowned options trader and author Lawrence G. McMillan. Given his background in options trading, it was natural for Lawrence to approach any volatility-based study in the same manner options are priced --using Black-Scholes model. This model of pricing assumes a financial asset's volatility should be measured in percentage change rather than absolute value change.
OVERVIEW
The McMillan Volatility Bands indicator for TradingView will plot the 3 and 4-standard deviation bands around a 20-day moving average. This is how Larry has always used this system. The user can, however, change the standard deviation value as well as the moving average length to their preferred setting. This indicator can be used on any asset and on any timeframe.
Furthermore, the indicator will plot buy and sell signals based on a trading system used by Larry in his flagship newsletter publication The Daily Strategist. The system gives a signal when price closes outside the 4-sigma band and then closes back within the 3-sigma band. That 'signal bar' will be colored red or green for a sell or buy signal setup, respectively.
Finally, an arrow will be plotted on the chart where the system would actually enter the trade. This is determined when price trades a little beyond the extreme of the 'signal bar'. The level by which price has to go beyond the 'signal bar' is an input parameter and can be adjusted by the user. We've chosen the default value of 0.34. This means, the indicator will not give a buy or sell entry until the price moves: 1/3 x beyond the extreme signal bar. This is to prevent getting whipsawed by some setups that never really move in your favor. We've found it successfully removes the less-valuable trade setups.
PARAMETERS
ma_length => length of the moving average that the volatility bands work off of
outside_sigma => standard deviation of outer volatility band
inside_sigma => standard deviation of inner volatility band
entry_trigger_cushion => this refers to the percentage of the signal bar's range. The default value is 0.34. This means price will need to move 1/3 (~34%) of the signal bar's range beyond the high (for a buy) or low (for a sell) of the signal bar to trigger a buy/sell entry. This entry plots the arrow on the chart. We have found requiring this extra move in price eliminates many of the less-desirable signals at the expense of entering the better signals a little later.
WANT TO PURCHASE OR NEED MORE INFORMATION ON McMILLAN VOLATILITY BANDS?
Visit the link below to see purchasing options as well as screenshots of the indicator and how we trade it at McMillan Analysis Corp.

Crypto Market CorrelationThis script utilized some new functions in Pine Script, which compares the correlation between the current symbol to a basket of crypto indexes that are listed on the FTX exchange.
By tracking these indexes we can gauge the reaction across markets that have a different market cap. By that I mean we can have a better idea about where the money is flowing into a specific market.
This script uses data from FTX:BTCPERP, FTX:ALTPERP, FTX:MIDPERP, FTX:SHITPERP, FTX:EXCHPERP, FTX:DRGNPERP.
A value closer to 1 equals to more correlation, closer to 0 equals to less correlation.

The MATRIX: Ultimate Crypto Position FinderThe Position Finder is a visual representation and additional feature of the "MATRIX Ultimate Crypto Position Strategy" and it should therefore be used alongside this script.
***You can find the main trading strategy script on our profile page***
-------------------------------------------------------------------------------
-The Position Finder is a tool that allows the user to see multiple triggers at the same time on a single chart of the "MATRIX Ultimate Crypto Position Strategy".
The Position Finder consists of 3 parts, namely an entry, a re-entry and an exit part (from top to bottom). Each of these three fields is made up of several green, black or red horizontal lines in which each line corresponds to a specific trigger.
-An entry or re-entry signal is valid once all individual triggers turn dark GREEN at the same time (for the top and middle matrix fields respectively). When this happens a bright GREEN vertical line is formed. The main trading strategy script will also print "Long Entry" label. While BLACK color indicates that a certain trigger is not valid. Yes, we know. It sounds very complicated, but once you understood it, we promise it will be the most simple and dare we say, an interesting tool to use.
-An exit signal is made once a single trigger turns RED. The main trading strategy script will also print a RED colored "Long Exit" label. While BLACK color indicates that the exit signal is not triggered.
-------------------------------------------------------------------------------
For those who are interested in the rationale of why a certain entry or exit signal was made a list with triggers can be found below. It contains the complete set of triggers for the entry, re-entry and exit signals from top to bottom.
Entry Trigger List:
1: Evaluation of short term trend: Ichimoku kinko hyo indicator, conversion line related to base line.
2: Evaluation of longer term trend: Ichimoku kinko hyo indicator, price related to the ichimoku cloud.
3: Confirmation of the longer term upward trend: Ichimoku kinko hyo indicator, lagging span related to ichimoku cloud.
4: Confirmation of short term upward trend: Ichimoku kinko hyo indicator, price related to conversion line and base line.
5: Evaluation of longer term trend projection: Ichimoku kinko hyo indicator, projected ichimoku cloud shape.
6: Confirmation of short term trend: Ichimoku kinko hyo indicator, lagging span related to the price.
7: Confirmation of short term trend: Ichimoku kinko hyo indicator, lagging span related to the price (alternative method).
8: Confirmation of the longer term trend: Ichimoku kinko hyo indicator, lagging span related to ichimoku cloud (alternative method).
9: Confirmation of the longer term trend: Moving averages.
10: Confirmation of sufficient momentum: Macd indicator.
11: Evaluation of overbought or oversold conditions in the price: RSI indicator.
12: Evaluation of price equilibrium: Ichimoku kinko hyo indicator, price related to ichimoku cloud , conversion line, base line.
13: Confirmation of general trend: Vortex indicator.
14: Evaluation of price equilibrium: Ichimoku kinko hyo indicator, price related to ichimoku cloud , conversion line, base line (alternative method).
15: Evaluation of volatility: Choppiness index indicator.
16: Evaluation of volume: Volume indicator.
Re-Entry Trigger List:
1: Confirmation of short term upward trend: Ichimoku kinko hyo indicator, price related to conversion line and base line.
2: Evaluation of short term trend: Ichimoku kinko hyo indicator, conversion line related to base line.
3: Confirmation of the longer term upward trend: Ichimoku kinko hyo indicator, conversion line and base line related to the ichimoku cloud .
4: Confirmation of sufficient momentum: Macd indicator.
5: Confirmation of sufficient momentum: Macd indicator (alternative method).
6: Evaluation of overbought or oversold conditions in the price: RSI indicator.
7: Confirmation of sufficient momentum: Macd indicator (alternative method).
8: Confirmation of general trend: Vortex indicator.
9: Confirmation of the longer term upward trend: Ichimoku kinko hyo indicator, price related to the ichimoku cloud .
10: Evaluation of bullish/bearish territory.
Exit Trigger List:
1: Confirmation of short term trend reversal: Ichimoku kinko hyo indicator, conversion line related to base line.
2: Confirmation of neutral territory: Ichimoku kinko hyo indicator, price related to the ichimoku cloud .
3: Confirmation of bearish territory: Ichimoku kinko hyo indicator, price related to the ichimoku cloud .
4: Evaluation of extremely overbought conditions in the price: RSI indicator.
5: Confirmation of bearish divergence signals.
-------------------------------------------------------------------------------
Reminder: Use this trading strategy at your own risk and trade responsibly. We are not responsible for any financial loss using this strategy.
***The script is invite-only, message us to get script access***

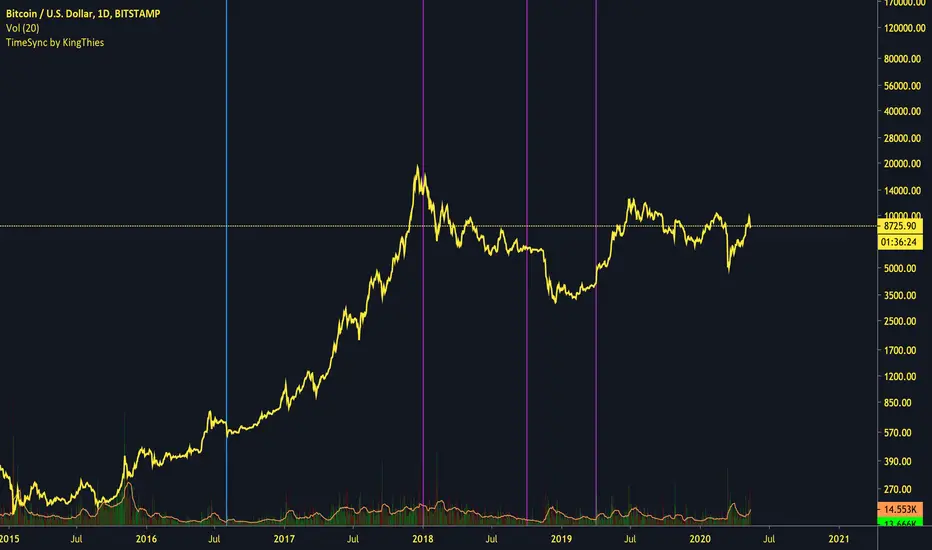
TimeSync by KingThies TimeSync by Kingthies
Written in Pine v4
Applies one function that was published in the Tradingview Pinescript Manual
The Motivation behind this script - Time is 50% of your chart. Many ignore it entirely. This should help give an idea on how to read it and incorporate it in their analysis.
TimeSync by KingThies takes a simple concept and turns it into a visual tracking system of when timeframes of significant impact, all close at the same time.
By utilizing several high time-frames, we see overlaps in periods and more significant events occurring when multiple periods close at once.
The TFs included are 3D,1W,2W and 1M. When users use the timeframes above intraday, the resolution for these HTF's is shown. When using the LTFs, anything lower than 1D/is intraday, the user sees a similar concept but comprised of the 4H, 6H,8H and 10H charts.
Users can adjust the settings to show the HTFs in sync AND also factor in if the event was on a business quarter or new year, which adds more significance to the occurrence.
By seeing when these periods end in sync, we can assume more volatility is present in a given market, presenting various opportunities for traders to take advantage of a given situation.
Apologies in advance for any questions that come up - I will do my best to reply or respond here on Tradingview.com.
Additional Resources for this topic can be found in my account signature, located at the bottom of this post.
Squeeze Momentum Strategy Signals [Bitduke]Description :
Signals based on transformed Momentum Indicator (leading indicator measuring a security's rate-of-change) with risk management system and ability and custom backtesting.
Usage:
Strategy flips long / short depending of indicator signals. There can be multiple signals of the same type, for example, 2 longs in a row, only the first of them must be taken into account.
Features :
Possible to change source: ohlc4, hl2 , hlc3, close
Enter your stop loss and take profit in %, NOT ticks
Working and robust even without take profit / stop loss
Yearly drawdown lower than 20%
Backtesting:
Backtested on BTCPERP ( FTX ).
It shows much better results on 1h timeframe (about 200% yearly, 55% in 2020) and relatively low drawdown to date.
Strategy doesn't repaint.

Bitcoin Stock To Flow Rainbow IndicatorHello everyone,
I have finished to create the Bitcoin stock to flow indicator, rainbow version.
It's a Bitcoin price prediction model.
What is Stock To Flow ?
Stock is the size of the existing stockpiles or reserves and flow is the yearly production.
The formula is : Stock divided by flow ( Stock_to_flow = STOCK / FLOW )
The supply of bitcoins is fixed in the source code.
What we know :
Blocks are created every 10 minutes ( average )
In 2009, 50 Bitcoins was created every 10 minutes , so 300 Bitcoins per hour, 7200 per day, 2628000 per year
The Halving happened each 210000 blocks , the average time between halving is around 1300-1400 days.
The mathematical formula that I used for the rainbow line is : exp(-1,84) * (Stock_to_flow ^ 3,36)
And the mathematical formula that I used for the " top price line " is : 1.2 * (Stock_to_flow ^ 3)
The rainbow line IS the prediction model .
We can observe that :
The price follow the rainbow line
After each halving, the price grow and touch few month after the rainbow line
When the price is between the rainbow line and the " top price line ", habitually, it's followed by a drop of the price below the rainbow line.
Special thanks to PlanB.

Crypto Scalper Pro Study / Alerts===========
Crypto Scalper Pro Study Script with Alerts
===========
Our Crypto Scalper Pro Study with Alerts Script is a carbon copy of our tried and tested Crypto Scalper Pro Strategy , but now with the option of setting TradingView Alerts for your chosen trading plan. Making missing trades a thing of the past, and helping you to automate your own trading strategy using AutoView, 3Commas or similar 3rd party Auto Trading Software.
-----------
Crypto Scalper Pro is a scalping strategy developed to work alongside our Crypto Tipster Strategy, now you can trade the D markets with our Tipster, and Intra-Day markets with our Scalper!
This strategy works very well on shorter time frames across multiple crypto pairs, everything from 4H all the way down to a 5m chart, our Crypto Scalper will find the best Entry and Exit points for consistent and reliable returns.
We've added a few variables for you to play with to fine tune this scalper to suit your chosen trading plan - however, these will only adjust the strategy to a certain degree, as there are many algorithms and indicators doing their thing hidden in the background that take precedence.
-----------
What's Included?
Crypto Scalper Pro comes with a host of features and is being continually updated, these features include (but are not limited to):
- Date Range Settings
Setting custom Start/End dates can help hone your strategy to suit the current times, or get a general overview of the market over the years.
- Heikin Ashi Confirmation
We added HA confirmation for both Entry & Exit of trades. This started as a form of "Safe Mode", we have since adapted our safe mode far beyond Heikin Ashi; but kept this confirmation as an added extra.
- Variable Indicator Settings
As well as our Fixed Indicators and Price Action analysis going on in the background of the strategy, we've also included some Variable Indicators that you have access to edit.
Lookback Period will help establish how far back you'd want to be confirming price indications on the strategy - the higher the number the further back it will look, making the Scalping Strategy appear smoother with less trades during choppy times, the downside with a higher lookback is you might miss the start of a potentially epic trade, and only be shown an Entry after the event has already happened.
We find Lookback Lengths of between 5 and 100 could work depending on various other settings, the market being traded, and the timeframe being used.
MA Length (Length of Moving Average) - We use a few MA's to best determine various factors involved with successfully scalping a market, overall trend direction, current price movements and fake-out detection to name just a few. You've got the option of determining a good average length for a few of these variables.
Again, a short MA Length will catch every big move right at the start, but you're almost guaranteed a Negative Expected Value with that method, due to the vast quantity of losing trades in times of chop/ranging markets. A Higher MA Length will remove a lot of chop, reduce the quantity of trades, and therefore (should) result in a higher Percent of Trades Profitable; it will however add a certain lag to the strategy, meaning those highly profitable trades we're looking for may turn out to be not so highly profitable!
- Safe Mode
Enabling Safe Mode will add a couple more confirmation indicators to the strategy - the aim of Safe Mode is, in essence, to remove any trading signals that would end of being false/bad moves. Usually resulting in less Overall Trades, a higher Net Profit, higher % Profitable, higher Profit Factor AND a lower Drawdown. Use Safe Mode to help eliminate orders that would otherwise be placed in choppy markets.
- Stop Loss/Take Profit Settings
This is where Crypto Scalper Pro really proves itself, Money Management. We have an editable Fixed SL/TP, as well as Trailing Stops for Long or Short orders, all of which you can use on their own, or combined with each other. Playing with these settings can turn an un-profitable system into a very-profitable trading plan!
-----------
What's Included within Crypto Scalper Study / Alerts Script?
Our Study script will find Entry and Exit points exactly as our Pro Strategy would find them. The same indicators, methods and chart reading techniques are used, there are 2 big differences however...
The first difference is that our Pro Strategy has the ability to manage your money, Fixed Stops, Take Profit and Trailing Stops to name just a few. Our Study does not (yet) have these functions added due to the way TradingView's charting platform operates.
That's the bad news, the good news for our Crypto Scalper Study Script is that you can add Alerts to your trading plan! This is super handy if you decide to implement our methods into different time frames across various markets and are looking for Intra-day Alerts, or if you're looking to Automate your trading strategy using external software.
Help and Advice for setting up Alerts or to Automate your Strategy can be found on our website.
----------
For more information on the Crypto Scalper Pro Strategy visit the link in our signature.
Good Luck and Happy Trading!
