Mining Cash Flow LineTakes QUANDL Bitcoin blockchain difficulty data, three variables (hashrate in THs/sec, power consumption in kWh, and electricity costs in cents/kWh) and calculates the base line for cash flow in US dollars. The default is an AntMiner S15 at 10 cents/kWh.
When price is above this line, miners with the given conditions have positive cash flow (i.e. they make more money mining than their running costs), and when below the line, they would be better off turning their rigs off (if this simple model can be applied to their particular circumstance).
Assumptions:
1. All costs are consolidated into one "electricity cost" variable, including things like rent and wages for mining farms.
2. 12.5 BTC/block emission schedule (update source code upon next halving).
Warnings:
It is likely that actual costs to miners varies in complex ways. This indicator only shows a cash flow calculation for a very simple set of parameters that will generally apply to miners, but not necessarily all of them. (For example, a miner may be locked into a prepaid contract for cheap electricity, or sell exhaust heat in the winter for extra revenue.)
Positive cash flow is also different from ROI, as this model does not take into account the cost of acquiring an ASIC mining rig.
加密貨幣

Multiple EMA MTF by ZekisA simple but effective strategy with multiple time frames for EMA.
Very useful so you don't have to change chart resolution to check it, you have direct confirmation.
I put 6 time frames for one EMA as bricks, sometimes is hard to see if a line is above or below the price and you need to zoom and zoom, so with this way of view, it will be easier.
Green = EMA is below price = bullish
Red = EMA is above price = bearish
Multi time frames as default (you can change it for your needs) - 5m, 15m, 30m, 1H, 2H and 4H.
Enjoy!
@Zekis

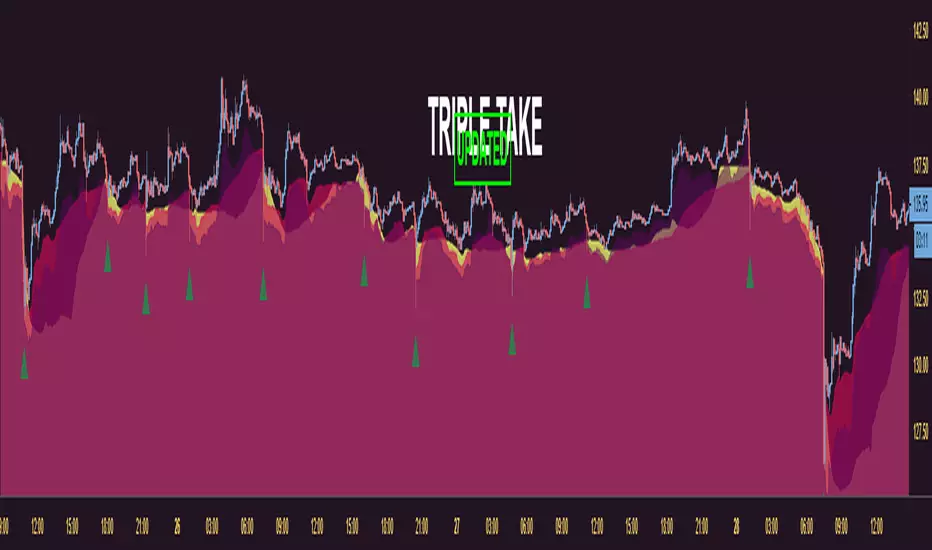
Triple Take - Buy SignalsTriple Take will snipe entry points for you based on our 3 step algorithm (plus bonus optional filter)
It's time to show the markets you're an Apex Predator and you're hungry for profits!
The options panel gives you the control to tweak this bad boy for any market and any time frame as well as increase or decrease how aggressive your entries are.
-------------------------------------------------------------------------------------------------
Unlike some other scripts, Triple Take has ZERO REPAINTING and uses no data from higher time frames!
-------------------------------------------------------------------------------------------------
Complete Ichimoku Trader *modified*I just found this script from @kingthies here and like it. So i just made some changes and added some little code into it.
Reduced some noise for the signals. Hope anyone can enjoy it. But keep in mind, did not test it on live trading! Had just some time and love to work in pine :)
Original
Happy Trading

EMA ClusterPlots 4 EMAs of your chosen length. Easy to manage multiple EMAs and saves on your allotted indicators for smaller tradingview plans.


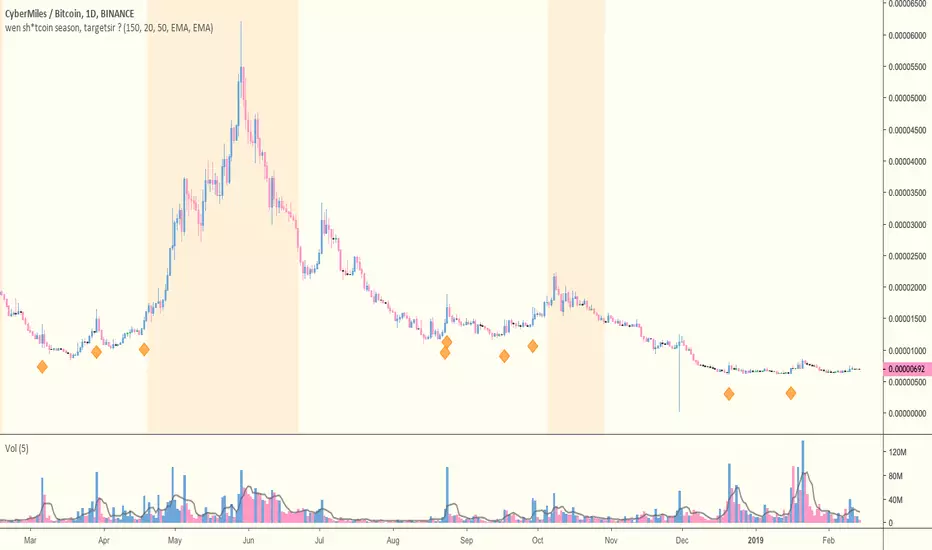
wen sh*tcoin season, targetsir ?Cheap thing to throw over your charts when scrolling through the likes of Binance, Bittrex or whatever
Highlights the Golden Cross region ("It's alt season!") -- configurable
Attempts to highlight potential "out of season" blatant accumulation via large volume spikes -- %age spike configurable

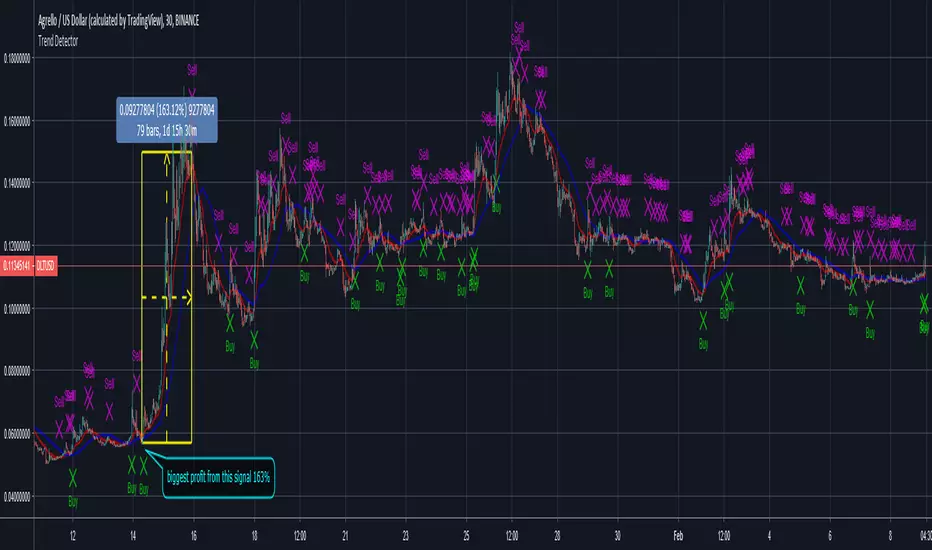
Trend Detector
New indicator for today called Trend Detector, follows the trend. It shows buy signals when coin is going up, sell signals when it is going down. Indicator showed plenty of Buy and Sell signals at the right times for buying and selling DLT . This indicator works on real time so you get the alerts on time so you can action it. Works on other cypto and stocks.
BTC Aggregate USD Volumeaggregated USD volume of BTC from Bittrex, Poloniex, OkCoin, Gemini, Binance, Bitstamp, Kraken, Bitfinex, Bitmex (leveraged), and Coinbase

Current volatilityHello everyone.
Today an other small indicator that show the current volatility .
It works on all tickers ( crypto-currencies / others ) .
Method :
- ((high-low) * 100) / open
Hope it will be useful for you :)

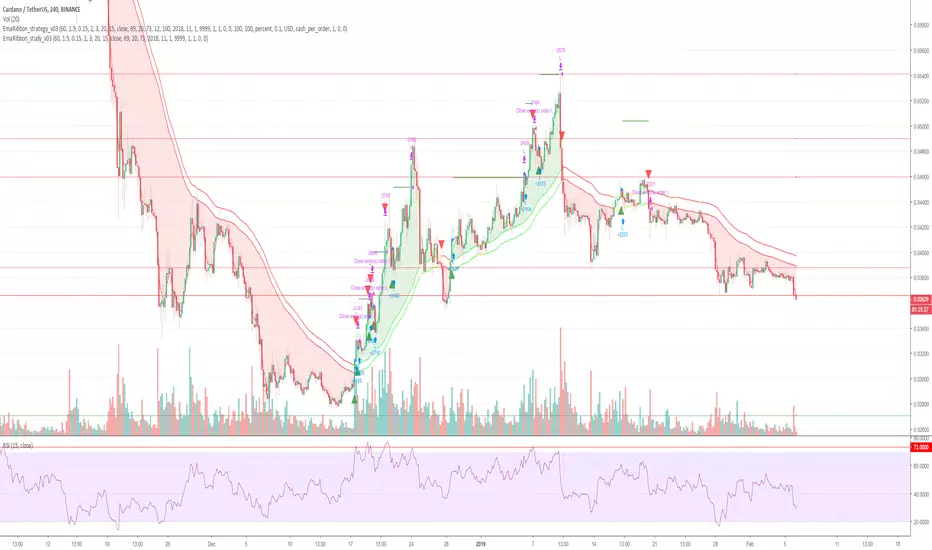
Cryptocurrency trend following EMA Ribbon LONG only studyThis strategy is based on EMA Ribbon and uses multiple indicators to find optimal time to enter/exit the trade and filter out false signals. The script with default setting is developed mainly for trading altcoins/stable coin pair such as ADA(USDT etc on 4h timeframe but it can be applied to any pair/any timeframe with some settings adjustments.
For plot on chart features make sure that you have both study and strategy scripts on chart with same settings.
Strategy settings description:
1. Signal EMA Length - Value for exponencial moving average (slowest from EMA Ribbon)
1a. Buy price toleration (%) - Price deviation for filtering bounces of EMA - price must close defined percents above EMA to open long trade
1b. Sell price toleration (%) - Price deviation for filtering bounces of EMA - price must close defined percents bellow EMA to close long trade
1c. EMA deelay - EMA id delayed by defined bars for smoothening
2. Filter by Fast EMA - Strategy filters signals to prevent buy while coin is dropping
2a. Fast EMA Length - Value for fast exponencial moving average
3. Filter by SMA - Strategy filters signals to confirm trend change
3a. SMA Length - Value for simple moving average
4. Filter by RSI - Strategy filters signals to prevent buing/selling overbought/oversold coins
4a. RSI Length - Length of RSI identificator
4b. RSI Source candle - What price of candle is used for RSI calculation (open, close, high, low)
4c. RSI Long condition - When buy, RSI indicator must be below this value to prevent of buying already overbought coin
4d. RSI Short condition - When sell, RSI indicator must be above this value to prevent of selling already oversold coin
5. RSI Close Trade Condition - Strategy sell coin once RSI reach defined value
5a. RSI close trade condition - Sell once RSI indicator acquires defined value
6. Close trade by Take Profit or Stop Loss Condition (STRATEGY ONLY) - Strategy sell coin once defined take profit / stoploss level is reached
6a. Take Profit (%) - Take profit value in percent
6b. Stop Loss (%) - Stop loss value in percent
6c. Plot targets on chart - defined targets will be plotted as lines on chart
7. Date range from
7a From Year - To run strategy in interval
7b From Month - To run strategy in interval
7c From Day - To run strategy in interval
8. Date range to
8a To Year - To run strategy in interval
8b To Month - To run strategy in interval
8c To Day - To run strategy in interval
9. Wait to confirm the signal
9a Wait candless to buy - strategy will wait defined candless to confirm the signal before buy
9b Wait candless to sell - strategy will wait defined candless to confirm the signal before sell
10. Plotting on chart (STUDY ONLY)
10a Plot signal line channel with bows on chart
10b Plot simple moving average on chart
10c Plot EMA Ribbon on chart
10d Plot recent support and resistance levels on chart
11. Show Every signal (STUDY ONLY) - Unchecked shows only first signal based on strategy. But if you use take profit/stoploss settings within your bot, you might want to rebuy on next signal. Checked shows signal on each candle.
Throw on chart also buld-in RSI indicator and set the same as strategy
Notice that there might be false signals, especially when the coin is not trending or is strongly manipulated. Overall strategy is profitable though. You just take some minor loses and wont miss the big move.
You may also consider to compare buy&hold return vs profit from trading this strategy. In downtrend as we have seen recently, profit may not be as high as you expect but it is still much better than just hold and hope.
You can use the strategy script for fine tunning settings and find best settings for yourself.
Study script helps you to automate trading with use of alerts perharps with 3commas bot or even trade manually based on email/sms notification setted by tradingview
Notice that study script does not handle takeprofit/stoploss order. That is why sell arrows could be plotted by study script later than strategy script. To rebuy after takeprofit/stop-loss use "11. Show Every signal (STUDY ONLY)" setting
Make sure that you keep same settings for strategy and study scripts.
If you need any help with settings do not hesitate to ask. I would also appriciate any feedback and ideas how to improve this script.
Here is backtest result from 1. Nov 2018 using constant 100USD Buy ammount:
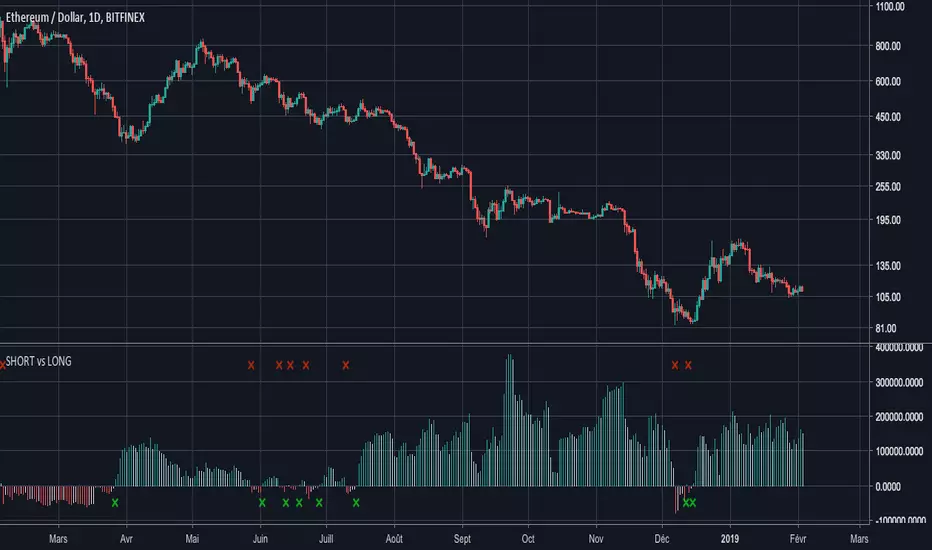
ETHUSDSHORTS - ETHUSDLONGS : balance of powerHello everyone,
I noticed that many people try to compare SHORTS and LONG positions (see:ETHUSDSHORTS and ETHUSDLONGS ), and the available indicators don't sufficiently highlight the balance of power .
That's why I programmed this indicator to answer this need ( which I also have ! ).
His ETHUSDSHORTS - ETHUSDLONGS crossover indicator e of power
I think you will understand quickly how it works, it's easy :
- If the histogram is negative, the color is red and that means that there are more BTCUSDSHORTS than ETHUSDLONGS
- If the histogram is positive, the color is green and that means that there are more ETHUSDLONGS than ETHUSDSHORTS
A small cross (red or green) appears when the power balance is reversed.
Have a good day.
Coinmarketcap - Live CryptoMarketCap TOP 20Hello everyone,
I hope you are fine.
Today an other important indicator : the TOP 20 crypto market cap !
It's better if you use it on BTC/USD to have more historical data.
Next cryptocurrencies have been used for this indicator :
BTC
ETH
XRP
EOS
BCH
LTC
USDT
TRX
XLM
BSV
ADA
BNB
XMR
IOTA
DASH
NEO
ETC
XEM
USDC
ZEC
Thank you and have a good day :)

BTCUSDSHORT - BTCUSDLONG : balance of powerHello everyone,
I noticed that many people try to compare SHORTS and LONG positions (see: BTCUSDSHORTS and BTCUSDLONGS ), and the available indicators don't sufficiently highlight the balance of power .
That's why I programmed this indicator to answer this need ( which I also have ! ).
His name is : BTCUSDSHORT - BTCUSDLONG crossover indicator
I think you will understand quickly how it works, it's easy :
- If the histogram is negative, the color is red and that means that there are more BTCUSDSHORTs than BTCUSDLONG
- If the histogram is positive, the color is green and that means that there are more BTCUSDLONDS than BTCUSDSHORTS
A small cross (red or green) appears when the power balance is reversed.
Have a good day.
EDIT 03/02 : Title has been changed

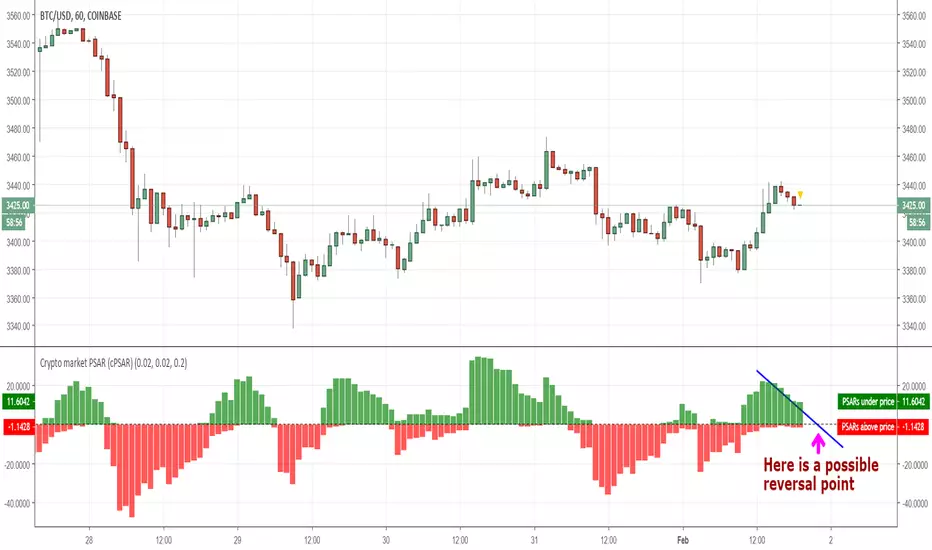
Crypto market PSAR (cPSAR)This indicator calculates the PSARs of the most liquid cryptocurrencies (as percent differences from the prices) and sums them together.
The PSARs under the closes, which act as support, are summed separately and shown in green. The PSARs over the closes (acting as resistance) are summed separately and shown in red.
The result is an indicator which can be interpreted somewhat like the RSI (but keep in mind that PSAR is a lagging indicator unlike the RSI which is a leading indicator). By interpreting this correctly you can - SOMETIMES - predict the short-term turns of the entire crypto market.
Many traders use the prices shown by PSAR (Parabolic Stop And Reverse) to set stop loss prices and/or to take profit and reverse their positions. This is why, on reversal of the PSARs (= when one of the red or green values becomes visibly larger than the other), a strong turning of the market can, sometimes, occur.
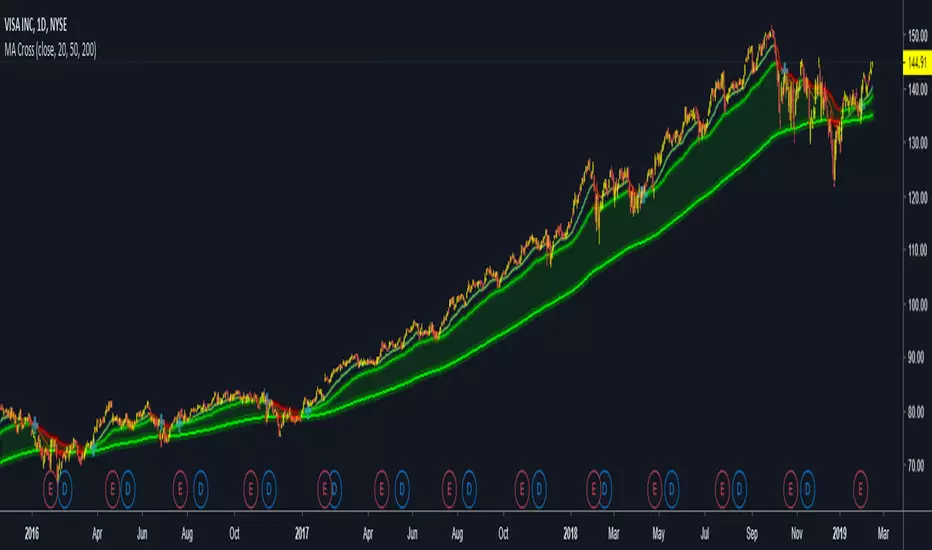
ASX300 Golden Cross stock alerts (A2M-ANZ)Golden Cross happens when the SMA50 crossover the SMA200, which usually signals profitable bullish trend and good buy entry. For example, for Aurelia Metals the Golden Cross buy signal had 250% buy and hold profit in about a year.
This indicator hunts for the Golden Cross of the first 20 stocks in the ASX300 (A2M to ANZ), once it it happens the indicator plots the name of the stock that had Golden cross which could be use as entry for that stock. As you can see various stocks were plotted in the chart, those had crossedover at the time of plotting.
Due to TradingView Pinescript limitations, only 20 stocks can be watched in one indicator. Therefore 15 Golden Cross indicators are required to watch the entire ASX300.
This can also be applied to crypto coins with some adjustments in the script, so you can be alerted of the Golden Cross in crypto coins and buy bullish coins.

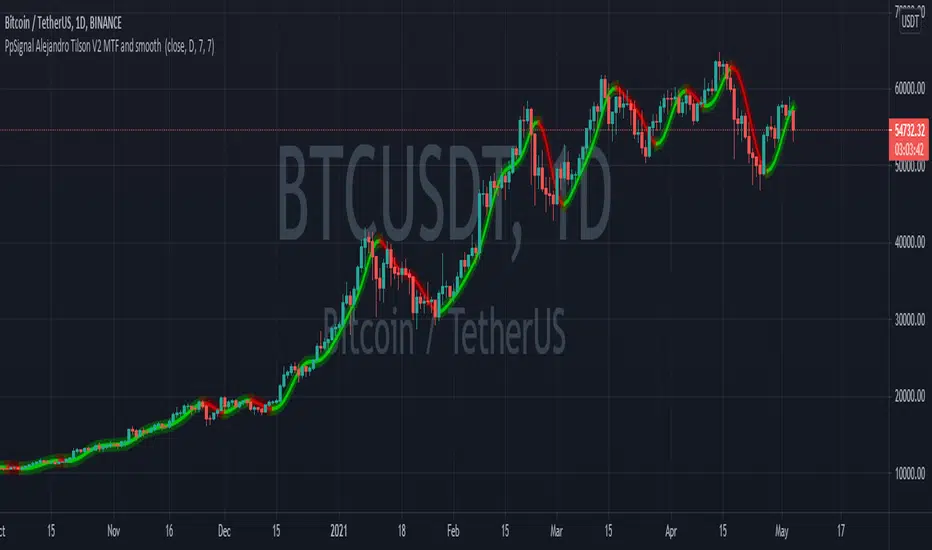
Alejandro Tilson T3 V2 MTFTilson Move average with John Ehlers smooth system adn buy or sell signal trade.
enjoy
ck - Inner Bars Indicator with Alerts and Trailing Stop v1*** Please check out the matching Strategy to accompany this Indicator to allow you to fully backtest! ***
Inner Bar trading strategy is where the "inside" bar (or candle to the right) within a pair is smaller and within the high to low range of the prior bar, as this pattern tends to be somewhat predictable; especially in "chop" or sideways trading, it is useful to have in your tool box.
Features include:
Complimentary strategy you can add as well as the indicator to backtest and tune your settings before live trading
Trailing Stoploss to wring every cent from a trade
Clear Alert labels have been coded in for use with trading bots, 3commas is recommended.
Enable/Disable Shorts in addition to Longs
Visual chart shapes - Pink Triangle = Long, Purple Triangle = Short, Thin Green Arrow = Profit, Thin Red Arrow = Loss
Realtime Deal Status - Plotlines include Yellow = Entry Price, Green = Trailing Stop Profit, Red - Hard Stoploss
A further feature is that you can disable Shorts (therefore only Longing) for use with exchanges
that only allow you to Long, such as Binance & Coinbase.
Additionally, this Indicator will close a trade before opening the next, so a single exchange
account (BitMEX for example) is all that is required versus having separate accounts to long or
short on the same chart.
This strategy is intended to use $100 of capital, traded at 2.5% per order with 10x lev on Bitmex.
If you like my work, please use my referral links (you will receive discounts!)
3commas trading bots (now with Bitmex support and a lot more!) - 3commas.io
BitMEX - www.bitmex.com
If you have any comments or suggestions, please message me via TradingView.
Based on the core "Inner Bars" concept found at:
backtest-rookies.com
with original inspiration/idea from babypips.com

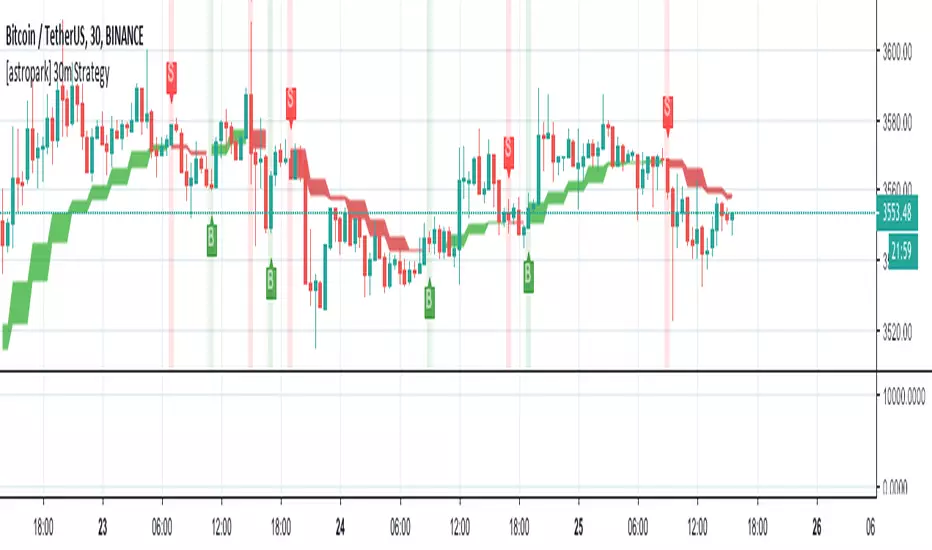
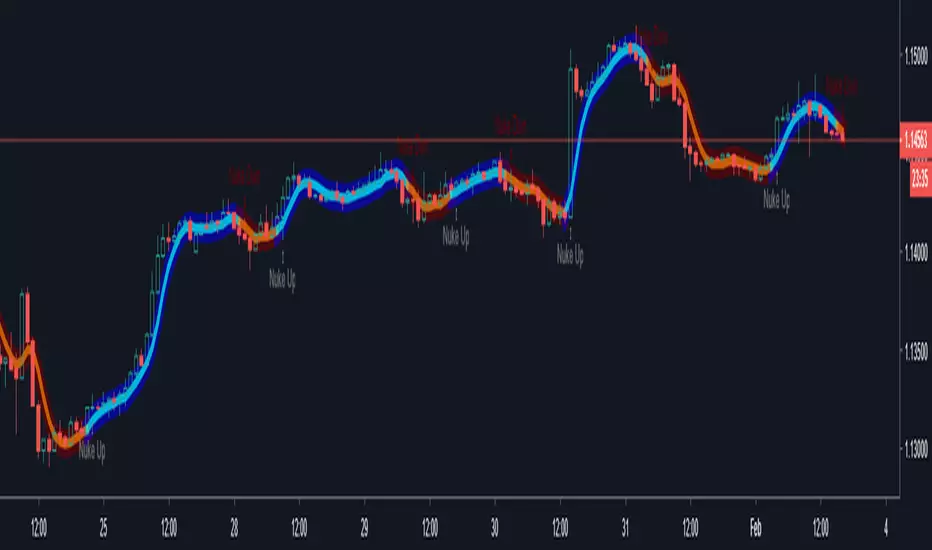
[astropark] Low TimeFrame Strategy (2H or lower)Buy/Long when you see a green "B" label on the screen "at best price you can", considering green cloud as support for more buys/longs
Sell/short when you see a red "S" label on the screen "at best price you can", considering red cloud as resistance for more shorts
BTC jar: 1K5kuYQPEqoNo6GRmJbHWMPmqwKM5S3oRR
ETH jar: 0x091b541a6dd6fe08c4e7bd909baafb2fce9b975e
LTC jar: LSVoAChsZrVsvbNyUfdpxtFpDAUSaUTUig
XRP jar: (XRP deposit tag) 103997763 (XRP deposit address) rEb8TK3gBgk5auZkwc6sHnwrGVJH8DuaLh