Bitcoin halving past datesThis indicator will help everyone to visualize the bitcoin halving effect on different assets
加密數字貨幣

Trade System Crypto InvestidorTrade System created to facilitate the visualization of crossing and extensions of the movements with Bollinger bands.
Composed by:
Moving Averages of 21, 50, 100 and 200.
Exponential Moving Averages: 17,34,72,144, 200 and 610.
Bollinger bands with standard deviation 2 and 3.
How it works?
The indicators work together, however there are some important cross-averages that need to be identified.
- Crossing the MA21 with 50, 100 and 200 up or down will dictate an up or down trend.
- MA200 and EMA200 are excellent indicators of resistance and support zone, if the price is above these averages it will be a great support, if the price is below these averages it will indicate strong resistance.
- Another important crossover refers to exponential moving averages of 17 to 72 indicates a possible start of a trend
- The crossing of the exponential moving average of 34 with 144 will confirm the crossing mentioned above.
- In addition, the exponential moving average of 610 used by Bo Williams is an excellent reference for dictating an upward or downward trend, if the price is above it it will possibly confirm an upward trend and the downside.
- To conclude we have bollinger bands with standard deviation 2 and 3, they help to identify the maximum movements.

MA25 EMA100 30min StratyHey, I coded this script to ease the diphunting and to identify a trend easily.
You have a FAST/SLOW Ma/Emas, and a LRL which is made of 2 different lenghts aswell.
LRL gives you the dominating trend.
SLOW EMA100 a LIME/RED signal, which you have to interpret in function of the LRL line.
The fast MA25 is useful as a moving Support/Resistance line.
Im still optimizing it, so you might find updates to this script.
I also made a strategy, which Im perfecting so I will give u an even easier tool if I find the holy grail :P
If you have any doubt, please consider asking.
Otherwise you will be helping me by leaving a feedback.
Good trades mai frenz!

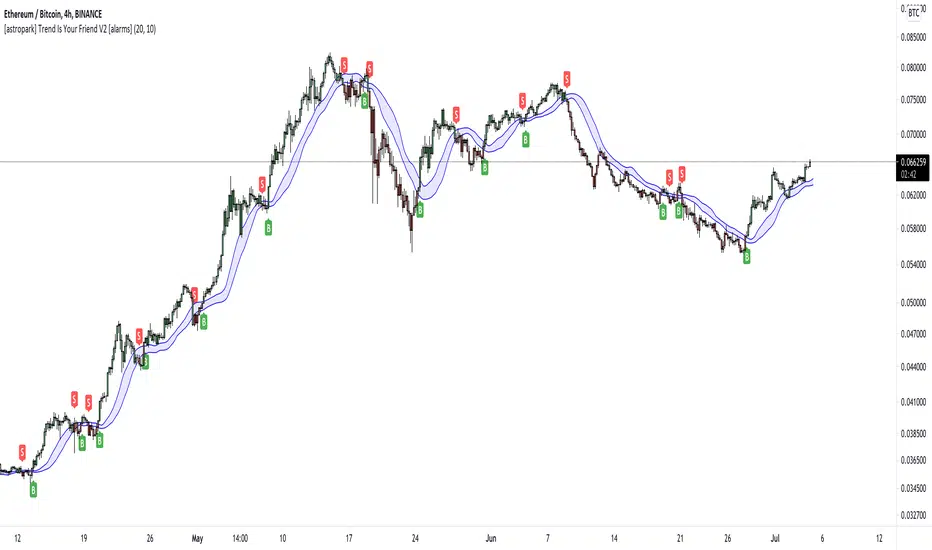
[astropark] Trend Is Your Friend V2 [alarms]Dear Followers,
today another awesome Swing and Scalping Trading Strategy indicator, runnable on a bot , which works great on High Timeframes (1D is suggested) but also on lower ones (just write me in order to help you find correct settings) and even better on 1m Renko chart!
If you are a scalper, you will love suggested entries for fast profit. You can run it on 1h timeframe (below is not suggested, there is "no-trend" below 1h!) if you are used to scalp trading and close each trade whenever you feel happy (a proper trailing stop strategy is suggested anyway).
This is a twin sister or the "Trend Is Your Friend V1" indicator you can see here below
This strategy differs for the engine used as basis, but has the same usage settings:
enable/disable signals on chart
enable/disable showing trend cloud
enable/disable bar coloring based on trend
enable/disable background coloring based on trend
edit trend period length (you have to increase it if you go on lower timeframes or you go on FOREX/Stocks market, direct message me in order to help you fine best settings)
This strategy only trigger 1 buy or 1 sell. In order to get notified when a signal is triggered, you need to use the "alarms" version of this indicator.
Strategy results are calculated on the timeframe from January 2015 to now, so on 5 years, using 10000$ as initial capital and working at 1x leverage (so no leverage at all! If you like to use leverage, be sure to use a safe option, like 3x or 5x at most in order to have liquidation price very far).
This is not the "Holy Grail", so use a proper risk management strategy.
This script will let you set all notifications you may need in order to be alerted on each triggered signals.
The one for backtesting purpose can be found by searching for the astropark's "trend is your friend" and then choosing the indicator with "strategy" suffix in the name, or you can find here below
This is a premium indicator , so send me a private message in order to get access to this script.
[astropark] Trend Is Your Friend V1 [alarms]Dear Followers,
today another awesome Swing and Scalping Trading Strategy indicator, runnable on a bot , which works great on High Timeframes (1D is suggested) but also on lower ones (just write me in order to help you find correct settings) and even better on 1m Renko chart!
If you are a scalper, you will love suggested entries for fast profit. You can run it on 1h timeframe (below is not suggested, there is "no-trend" below 1h!) if you are used to scalp trading and close each trade whenever you feel happy (a proper trailing stop strategy is suggested anyway).
This strategy let's you edit following settings:
enable/disable signals on chart
enable/disable showing trend cloud
enable/disable bar coloring based on trend
enable/disable background coloring based on trend
enable a special option to enhance trend cloud on FOREX/Stocks charts (optional)
edit trend period length (you have to increase it if you go on lower timeframes, like 1h)
This strategy only trigger 1 buy or 1 sell. In order to get notified when a signal is triggered, you need to use the "alarms" version of this indicator.
Strategy results are calculated on the timeframe from August 2017 to now, so on almost 2 years and half, using 10000$ as initial capital and working at 1x leverage (so no leverage at all! If you like to use leverage, be sure to use a safe option, like 3x or 5x at most in order to have liquidation price very far).
This is not the "Holy Grail", so use a proper risk management strategy.
This script will let you set all notifications you may need in order to be alerted on each triggered signals.
The one for backtesting purpose can be found by searching for the astropark's "trend is your friend" and then choosing the indicator with "strategy" suffix in the name, or you can find here below
This is a premium indicator , so send me a private message in order to get access to this script.

[astropark] Ichimoku Cloud Strategy [alarms]Dear Followers,
today a Great Swing Trading Strategy , runnable on a bot , which works great on High Timeframes (1D is suggested!) but also even better on 1m Renko chart.
If you are a scalper, you will love suggested entries for fast profit. You can run it on 1h timeframe (below is not suggested) if you are used to scalp trading and close each trade whenever you feel happy (a proper trailing stop strategy is suggested anyway).
This strategy is based on the Ichimoku Cloud Indicator and let's you set a lot of settings:
works on all timeframes (but 1D and above is suggested on normal candlesticks chart)
you can run this indicator on 1m Renko chart (be sure to enable the "USING RENKO CHART? ENABLE THIS OPTION" setting)
you can use 4 kind of Ichimoku Cloud (Custom, Slow, Standard and Fast - keep only one enabled)
you can make the Ichimoku Cloud show or not
you can enable showing the possibile re-entries
you can enable an heiking ashi analysis
you can enable a trailing stop strategy ("Auto Trailing Stop Loss" and "Close Trade When Price Breaks Above the Ichimoku Cloud" are two options very much suggested to keep enabled, especially on bot trading)
you can create your own trailing stop stategy and take profit strategy
you can enable a simple take profit strategy based on RSI Overbought and Oversold levels
This strategy only trigger 1 buy or 1 sell, but if you missed the possibility to open your long or short position don't get mad, but just enable the "show re-entry signals" option, so yout will be able to enter again (be sure to always use a proper money management ).
By the way, you can set any alarms you like in order to get notified when any kind of signal is triggered (you need to use the "alarms" version for this).
Strategy results are calculated on the timeframe from May 2017 to now, so on 2 years and half, using 10000$ as initial capital and working at 1x leverage (so no leverage at all! If you like to use leverage, be sure tp use a safe option, like 3x or 5x at most in order to have liquidation price very far).
This is not the "Holy Grail", so use a proper risk management strategy.
This script will let you set all notifications you may need in order to be alerted on each triggered signals (there is also an "ALL-IN-ONE" option for free tradingview users.
The backtesting version of this indicator, which will let you backtest how the indicator will perform on any chart you may test, can be found by searching for "Ichimoku Cloud Strategy" and then choosing the astropark indicator with "red and green arrows" at the end of the name. You can find it here below too:
This is a premium indicator , so send me a private message in order to get access to this script.

[astropark] Breaker Blocks, Supply Demand Order BlocksDear Followers,
today a new powerful indicator! Welcome to the great world of Breaker Blocks (BB) and Supply-Demand Order Blocks !
So what's the point? As always, the point is how to trade as safer as possible!
Breaker Blocks are price ranges where you simply have to wait for a pullback and sell-buy on its touch and price bounce, like in the screenshot below:
Supply and Demand are very important concepts, synonymous of Support and Resistance in most cases.
You should never sell whenever near a demand/support zone, unless price breaks through it as too weak. The same for supply/resistance: you should not buy near resistance, as most times you may start a trade with very high losing risk.
Here a screenshot how indicator works showing supply and demand order blocks (just enable them from indicator's option):
This indicator
can analyze chart based on high-low candle prices or open-close one
can show you Breaker Blocks (BB)
can show you Supply & Demand Order Blocks (OB)
lets you decide if you want to see high-low or open-close range of each OB
lets you edit the analysis window
lets you see local tops and bottoms of price as labels
This is a premium indicator , so send me a private message in order to get access to this script .

BEST Algorithm Builder CRYPTOHello traders 👋
I. 💎 SCRIPTS ACCESS AND TRIALS 💎
1. Every trial request access has to be done through my website.
2. My website URL is in this script signature at the very bottom (you'll have to scroll down a bit and going past the long description) and in my profile status available here: Daveatt
3. Many video tutorials explaining clearly how all our indicators work are available on your website > guides section and on our Discord forum.
4. You can also contact me directly for more information regarding the trading method included in the indicator or how to access it
II. Forewords
Algorithm trading has THE ambitious goal to reduce the number of decisions we have to make when trading.
It's so much easier to get a signal whenever all indicators are converging rather than monitoring each one individually.
Even better when that convergence has been found by experienced quant traders - so that our subscribers only worry about managing their trades according to our trading method.
We don't only provide scripts. They're based on our trading method we've built over years across many asset classes (including cryptocurrencies)
Feel free to check us out for more information (links in my profile or signature below)
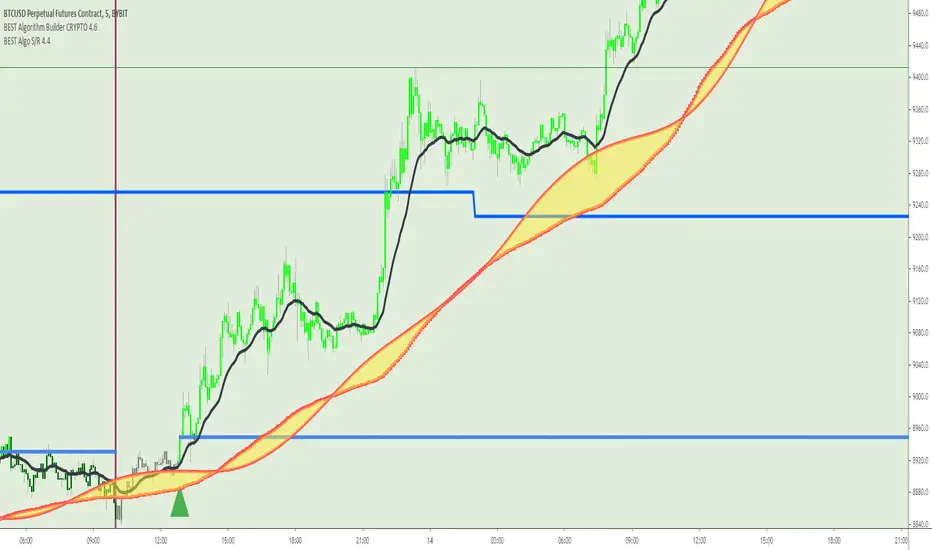
This indicator is for the Intraday CRYPTO traders looking for fixed entries based on a trading method designed by 2 experienced traders.
It's a variation of our Algorithm Builder with a custom method for intraday trading - can be coupled with the UNIVERSAL Algo Builder also for swing positions.
We designed this framework for CRYPTO/USD and CRYPTO/CRYPTO pairing (ex: LTC/BTC, XRP/ETH, ...)
Made for crypto with enough trading volume (big and mid-caps)
ETH/BTC
XRP/ETH
EOS/USD
It includes :
- our proprietary method with fixed entries
- a hard exit system (built-in stop-loss)
- 🔔 Compatible with dynamic alerts 🔔
Dynamic alerts are bringing automated trading to a whole new level. The third-party solutions capturing TradingView alerts are able to use them.
- (optional) we let the users decide to use or not our built-in Trade Manager.
Regardless of the Trade Manager is used or not, one must mandatory exit, once a vertical hard exit bar appears.
- the Algorithmic Supports and Resistances used as safeguards and take profit zones.
Final words
We made it as simple as we could (to be honest it's a very simple system for the end-user) - even with several hundreds of calculations in the indicator.
Please hit me up for any questions/feedback/comments
Become the BEST trader that you deserve to be
Dave
BTC BUY/SELL INDICATORThis script combines my personal MACD+RSI strategy which I've been using for years, into a simpler indicator so if both meet the right conditions It'll give a buy or sell signal depending on the circumstances this script is intended to be used along your set of other scripts as a confirmation of your bias for any particular trade, not to be use alone by itself, I recommend using it on high time frames.
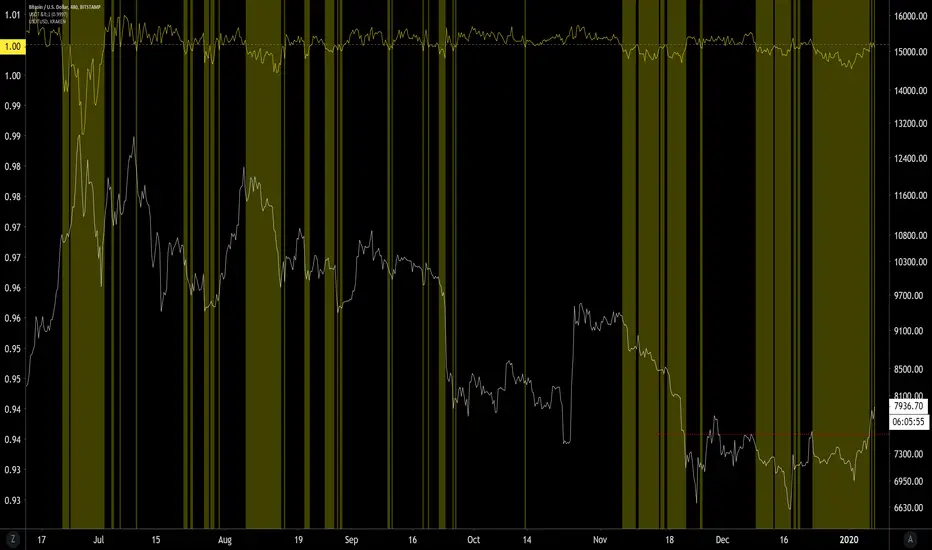
Bitcoin Halving CountdownHello traders,
I offer you today the BTC halving countdown updated in real-time on your charts
I inspired myself greatly from the gentleman @everget's script LTC halving countdown below
(
The countdown date is coming from that source www.bitcoinblockhalf.com.
The halving date is estimated to be around May 13th, 2020 .
That date is hardcoded in the script and is used for the countdown calculation.
The Bitcoin block mining reward halves every 210,000 blocks, the coin reward will decrease from 12.5 to 6.25 coins.
Enjoy the weekend
Dave

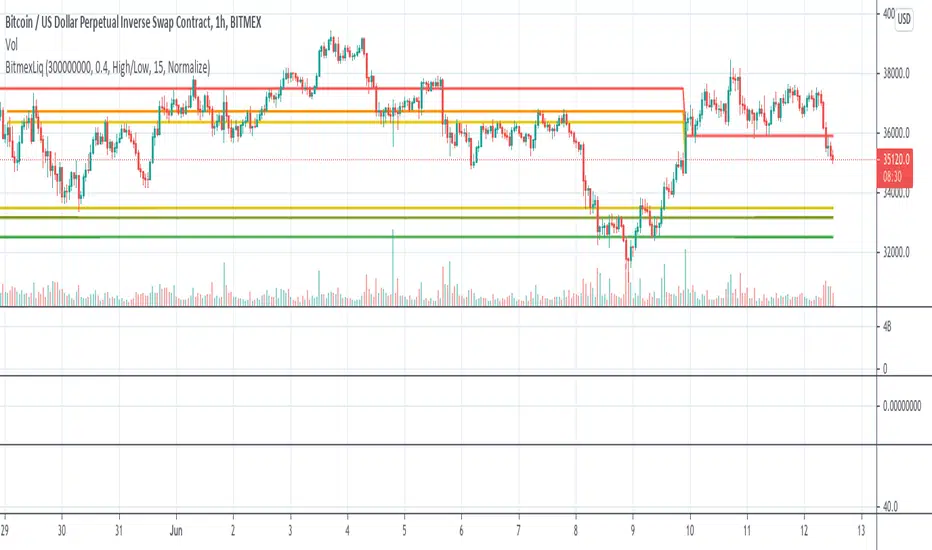
BitMEX Liquidation LevelsThis indicator plots BitMEX liquidation levels:
- 25x
- 50x
- 100x
The indicator works as following:
The underlying assumption (as with all liquidation calculations) obviously is that traders used fixed margin or go "all in" on their cross-margin account.
You then can configure a minimum trade volume and a minimum price change in percent for a candle to start computing liquidation levels from that candle
Additionally: configure the price base for the liqudation level: Candle high or low (default) works well, but you can also set "candle close" or "median high/low"
The indicator will then plot horizontal lines on the main chart showing price levels where many positions opened at the configured "start candle" will likely get liquidated.
It works for all BitMEX contracts and while it has been optimized for BitMEX, it will work on other exchanges with the same leverage levels (25x, 50x, 100x) and maintenance margin requirements too.
This indicator uses the Smart Volume indicator to compute the volume at the "start volume candle" setting where the liquidation level starts. This indicator can be found here: Smart Volume:
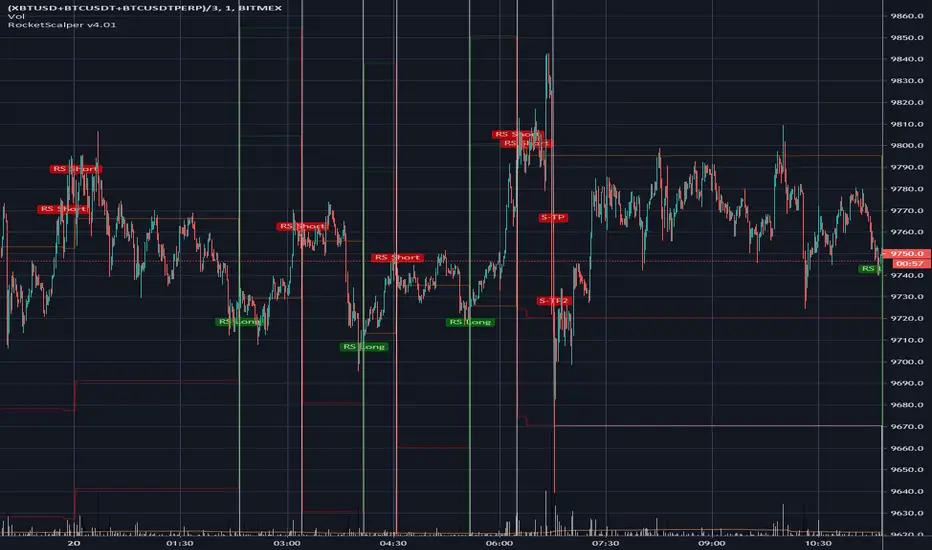
RocketScalper+ Long/Short IndicatorNOTE: To use together with RocketScalper Long/Short Indicator
About the Rocketscalper+ Indicator
Derives from the RocketScalper Long/Short indicator, was worked on by PM
Used by 180+ users as of today
Was first published on Sept 10, 2019
It had 1 iteration so far.
Will be updated as needed so it keeps giving good outputs (so far no update needed).
While the RocketScalper works by merging 3 oscillators and then checking the market balance between sells and buys to give you the final output, the RocketScalper+ uses MA Crossings and adds another layer to filter than final output. It IS NOT an upgrade, use both.
Main notes about the RocketScalper+:
Wavetrend ignored
Took weight off of Godmode for the final output
Added weight to Price Oscillator for the final output
Added TakeProfit and StopLoss conditions editable for users
Turned the scalper more neutral with a slight long bias for the upcoming trend
Has several outputs on the chart that you can activate/deactivate
Long / Short Signals
Self Explanatory / It suggests you should long or short the asset.
Show Price Oscillator signals
It'll output long/short signals based on the Price Oscillator.
Show Stop/Support/Resistance warning
Not working as of now, will need to update it soon.
No Text inputs on this indicator.
Should I use it on all timeframes and all pairs?
Yes, works very well with HTF and for all pairs. As you can see above on BTCUSDT (as an example), on the 6h use it as a confirmation to get in a trade, specially if you also use the TMA.
For access, please DM us or visit the link below in our Signature.

RocketScalper Long/Short IndicatorAbout the Rocketscalper Indicator
Was initially made by Rocket, PM, Hav0c, LiteralMonkey and PrimetimeBart.
It's our most used and advanced long/short indicator script so far, with over 450 users
Was first published in December 12, 2018.
It had 3 iterations, this is the 4th.
It has been continuously updated throughout the past year and as long as the market doesn't shift completely, it'll stay updated and giving good outputs.
It works by merging 3 oscillators and then checking the market balance between sells and buys to give you the final output.
Main notes about the 4th iteration:
RSI and Moving Averages back into the filtering conditions (for a while we removed it due to signal spam or trying to make a holy grail and i think we took steps back by doing that so they're back in)
Wavetrend settings closer to neutral
Loosened conditions on Godmode
Price Oscillator Changes
Added TakeProfit and StopLoss conditions editable for users
Turned the scalper more neutral with a slight long bias for the upcoming trend
Has several outputs on the chart that you can activate/deactivate
Long / Short Signals
Self Explanatory - It suggests you should long or short the asset.
Show Price Oscillator signals
It'll output long/short signals based on the Price Oscillator.
Show Stop/Support/Resistance warning
A warning label will pop-up when the trade is going against you. It's good to use as alerts, other than that, I wouldn't read much into it.
Plot Stop/Support/Resistance levels
It'll plot resistance and support horizontal lines in case you need guidance in your stops
Use background for Highlighting
It changes the background to red/green (or a color of your choosing) when its about to output a signal.
You also have, on the inputs tab, text inputs that you can edit such as:
Price Gain for Take Profit 1 and 2
Horizontal line (If you usually get at out at positive 50 points, put 50 in here and a line will plot once you get there) - Good for alerts.
Initial Stop Loss Percentage
Amount of $ Away from entry to Move SL After TP1
Trailing Stop Loss
Should I use it on all timeframes and all pairs?
You can, if you look at the historical outputs and they are good. However, I use it mostly on XBTUSD BTCUSDT ETHUSD XAUUSD and OILUS on LTF and HTF.
For altcoins, I would suggest only looking at 4h candlesticks and above.
For access, please DM us or visit the link below in our Signature.
Market BuySell RatioA script using 1m small candle size (configurable) to compute the volume of buy (up) vs sell (down) candles (instead of actual market buy vs sell orders which are not available in pine script).
It then plots the buy vs sell ratio as an oscillator below the cart.
This gives traders an idea of current order flow in the market.
To compute the small candles this script uses the "Smart Volume" script which can be found here:

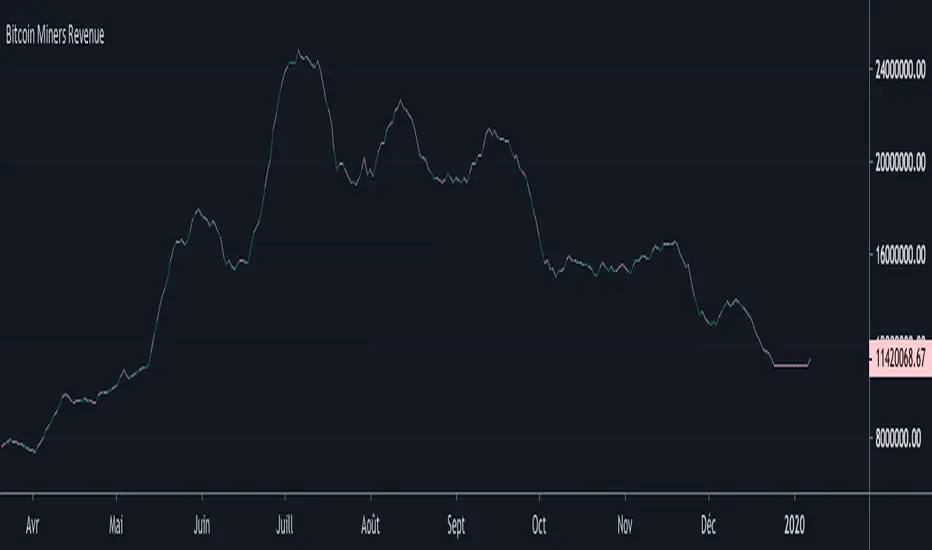
Bitcoin Miners RevenueHello everyone,
Bitcoin Miners Revenue Indicator :
Historical data showing (number of bitcoins mined per day + transaction fees) * market price.
Total value of coinbase block rewards and transaction fees paid to miner
Bitcoin Cost Per TransactionHello,
An indicator for Bitcoin, to have the cost per transaction, on a 10 days average.

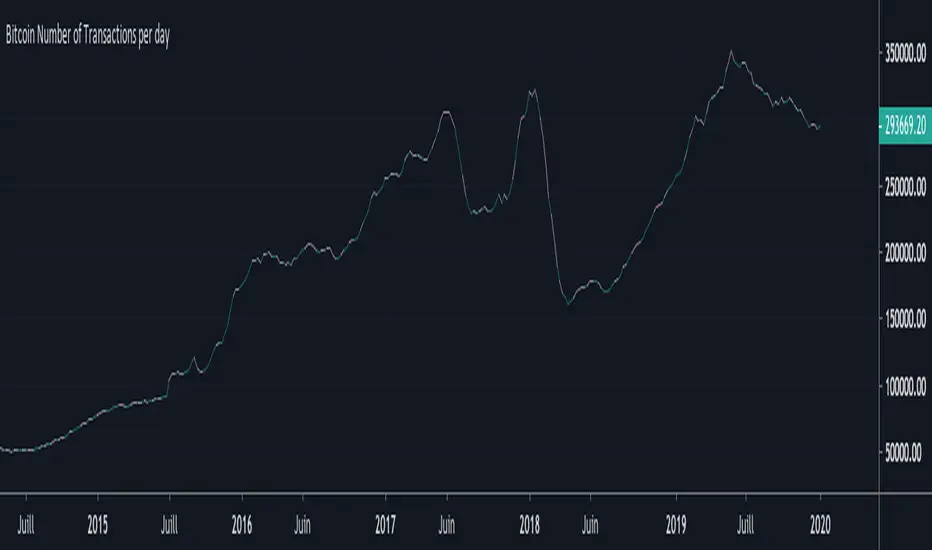
Bitcoin Number of Transactions per dayHello everyone,
Again an indicator for Bitcoin : the Number of Transactions / day.
Total number of unique bitcoin transactions per day
Precision : 10 DAYS AVERAGE
Bitcoin DifficultyHello everyone,
An other indicator for bitcoin : the difficulty
What is difficulty?
Difficulty is a measure of how difficult it is to find a hash below a given target.
The Bitcoin network has a global block difficulty. Valid blocks must have a hash below this target.
Mining pools also have a pool-specific share difficulty setting a lower limit for shares.

Bitcoin Hash RateHello everyone,
An interesting indicator for Bitcoin : the hash rate.
What is the Hash Rate ?
The estimated number of tera hashes per second (trillions of hashes per second) the Bitcoin network is performing.

PpSignal drake delay oscillatorDrake Delay Stochastic is a mt4 (MetaTrader 4) indicator and it can be used with any forex trading systems/strategies for additional confirmation of trading entries or exits use regression channel.
Buy when DDS is lime color and sell when the DDS is red.
Have background color aqua long and orange short.
have candle mode
have mtf mode.

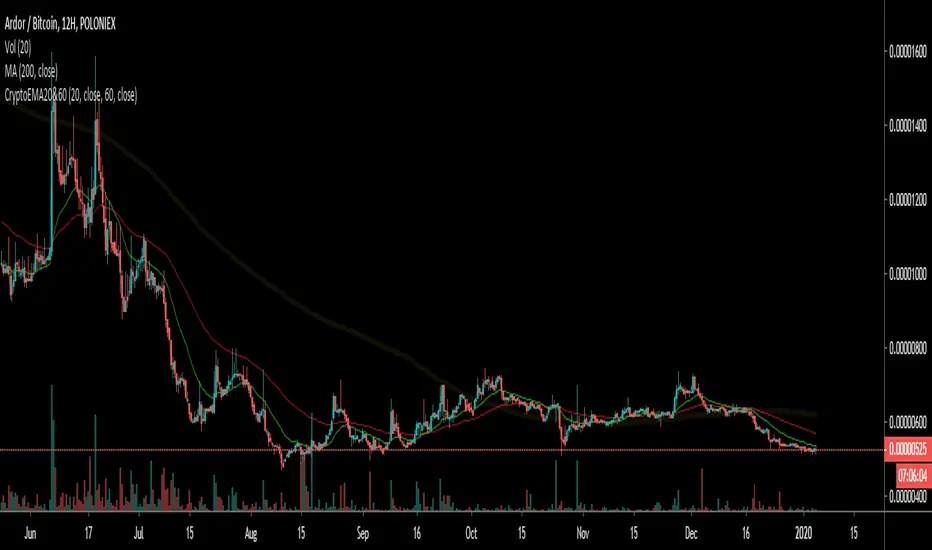
Crypto EMA 60/20Intended for use with Cryptocurrency Markets on the 12 hour time frame, the 60/20 exponential moving average frequency has proven successful for identifying trend bottom formations and for verifying head and shoulders top formations.
Combine the Crypto EMA 60/20 with classical RSI and MACD divergences to help verify impending reversals.
Useful for identifying trend changes in the frequency of four to six month price trends followed by a four to six week reversal, as historically found in cryptocurrency bull and bear markets.
This signal gets noisy if prices trend sideways for more than 30 days - consult daily views.
Trendy Bar Trend ColorTrendy Bar Trend Color
Inspired by trend candlestick charts on other trading platforms. Changes bar colors to stay in trend much like Heikin Ashi candles without the ATR price distortion. This is done by comparing the HL2 and/or Open-Close values of current candlestick to the prior candlestick.
